[PO01] Annual GHG emissions according to Decision No 406/2009/ES
[PO01] Annual GHG emissions according to Decision No 406/2009/ES

Key message

Slovenia is well on track to achieving its GHG emission reduction target for 2020, in 2017, emission were 11,9 % lower than the 2020 target value. Despite progress achieved, Slovenia should undertake additional measures to ensure long term limiting and reduction of greenhouse gasees. In 2017, GHG emission, emission from sectors not included in EU ETS, has been cut by 2,9 %. In all sectors except two: energy industries (electricity and heat production) and industry (fuel combuston and process emissions), emissions has been reduced.
Charts
Figure PO01-1: Non-ETS emissions in the period 2005−2017 compared to the target trajectory for emissions over 2013−2020 period that was calculated and based on 2005 emissions (Source: JSI-EEC)
Show data| Total GHG emmissions in nonETS sector | Target value set in Decision 406/2009/ES | |
|---|---|---|
| 2005 | 100 | |
| 2006 | 100.76 | |
| 2007 | 100.23 | |
| 2008 | 108.94 | |
| 2009 | 99.15 | |
| 2010 | 98.79 | |
| 2011 | 99.39 | |
| 2012 | 97.58 | |
| 2013 | 93.22 | 104.73 |
| 2014 | 89.32 | 104.98 |
| 2015 | 91.02 | 105.24 |
| 2016 | 95.20 | 105.49 |
| 2017 | 92.49 | 103.70 |
| 2018 | 104.00 | |
| 2019 | 104.29 | |
| 2020 | 104.59 |
Figure PO01-2: GHG emissions divided to non-ETS sectors in year 2017
Show data| Transport | Agricultural | Other | Waste | Energy | Industry and construction (with processes and use of solvents) | |
|---|---|---|---|---|---|---|
| 2017 | 0.51 | 0.16 | 0.13 | 0.05 | 0.05 | 0.10 |
Figure PO01-3: Non-ETS emissions divided to sectors in years 2005−2017
Show data| Transport | Other | Agricultural | Waste | Energy | Industry and construction (with processes and use of solvents) | |
|---|---|---|---|---|---|---|
| 2005 | 4416.47 | 2660.84 | 1709.38 | 847.59 | 590.91 | 1542.14 |
| 2006 | 4636.05 | 2441.33 | 1709.17 | 819.77 | 605.21 | 1645.09 |
| 2007 | 5217.33 | 1995.58 | 1762.86 | 778.89 | 588.97 | 1450.72 |
| 2008 | 6140.61 | 2364.88 | 1686.41 | 697.42 | 532.81 | 1397.21 |
| 2009 | 5311.57 | 2262.55 | 1697.55 | 638.21 | 535.61 | 1222.34 |
| 2010 | 5254.71 | 2289.61 | 1666.89 | 629.91 | 561.10 | 1223.24 |
| 2011 | 5691.57 | 2030.58 | 1648.12 | 633.95 | 576.25 | 1115.35 |
| 2012 | 5765.08 | 1782.87 | 1631.43 | 615.65 | 559.72 | 1128.30 |
| 2013 | 5460.26 | 1700.47 | 1616.31 | 596.47 | 536.08 | 1059.60 |
| 2014 | 5387.07 | 1406.69 | 1663.12 | 563.82 | 427.84 | 1061.73 |
| 2015 | 5362.35 | 1513.95 | 1700.22 | 577.78 | 455.64 | 1100.25 |
| 2016 | 5734.29 | 1584.70 | 1722.08 | 571.87 | 480.28 | 1109.40 |
| 2017 | 5541.37 | 1456.21 | 1688.16 | 557.05 | 508.60 | 1132.07 |
Figure PO01-4: Non-ETS emissions for sectors in the period 2005−2017 compared to the linear trajectory targeting 2020 projection values for each sector (Source: JSI-EEC)
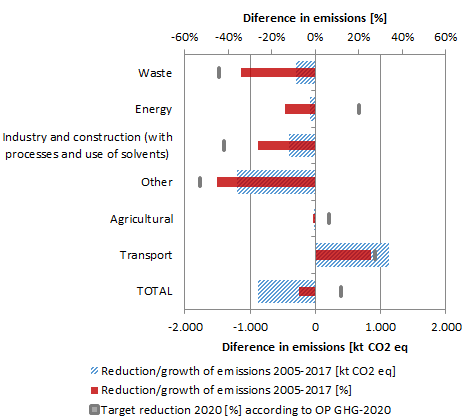
Figure PO01-5: Difference in GHG emissions divided to sectors and total difference in the period 2005−2017. Absolute (in kt CO2 eq) and relative (in %) values of emissions reduction/growth in same period are presented, as well as target reduction by year 2020 (Source: JSI-EEC)


