[PO01] Annual GHG emissions according to Decision No. 406/2009/ES

Key message

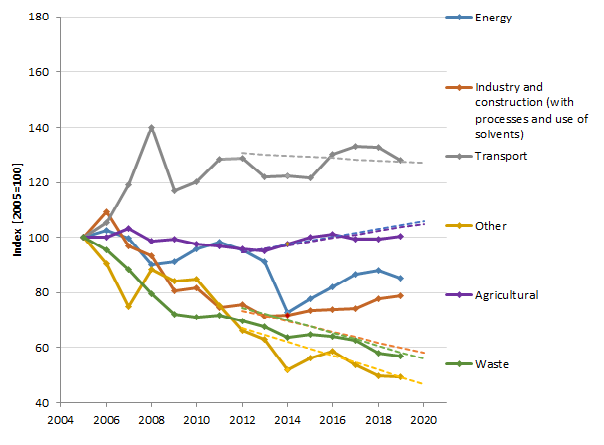
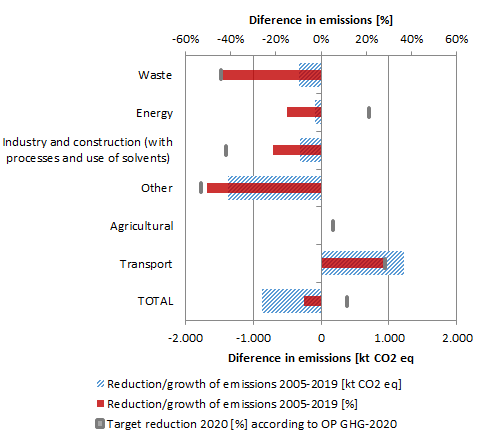
Slovenia is well on its way to compliance with the 2020 non-ETS target. In 2019 Slovenia's non-ETS greenhouse gas emissions were 12.2% below the 2020 target. In 2019 emissions decreased by 2%. Greenhouse gas (GHG) emissions decreased in sectors: other use, transport sektor and in energy and heat production sector. Other sectors saw an increase, with the highest increase in the industry sector, while in waste sector GHG emissions remained practically unchanged.
Despite the good results, additional measures are needed for long-term GHG emissions reduction in line with the mid- and long-term targets.
Charts
Jožef Stefan Institute - Energy Efficiency Centre
| Total GHG emmissions in non-ETS sector | Target value set in Decision 406/2009/ES | |
|---|---|---|
| 2005 | 100 | |
| 2006 | 100.87 | |
| 2007 | 100.72 | |
| 2008 | 109.48 | |
| 2009 | 97.96 | |
| 2010 | 99.40 | |
| 2011 | 99.30 | |
| 2012 | 97.05 | |
| 2013 | 92.72 | 105.50 |
| 2014 | 89.60 | 105.76 |
| 2015 | 91.18 | 106.01 |
| 2016 | 95.35 | 106.27 |
| 2017 | 95.25 | 104.47 |
| 2018 | 94.42 | 104.77 |
| 2019 | 92.56 | 105.06 |
| 2020 | 105.36 |
Jožef Stefan Institute - Energy Efficiency Centre
| Transport | Agricultural | Other sectors | Waste | Power sector and district heating | Manufacturing industry and construction (including process emissions) | |
|---|---|---|---|---|---|---|
| 2019 | 0.52 | 0.16 | 0.12 | 0.11 | 0.05 | 0.04 |
Jožef Stefan Institute - Energy Efficiency Centre
| Transport [kt CO2 ekv] | Other [kt CO2 ekv] | Agricultural [kt CO2 ekv] | Waste [kt CO2 ekv] | Energy [kt CO2 ekv] | Industry and construction (with processes and use of solvents) [kt CO2 ekv] | |
|---|---|---|---|---|---|---|
| 2005 | 4406.82 | 2700.32 | 1713.82 | 766.46 | 6974.51 | 3871.26 |
| 2006 | 4642.73 | 2447.64 | 1713.63 | 731.09 | 7042.22 | 4056.03 |
| 2007 | 5246.23 | 2027.34 | 1769.69 | 677.40 | 7270.66 | 3826.10 |
| 2008 | 6166.83 | 2384.02 | 1692.75 | 609.73 | 7025.76 | 3664.19 |
| 2009 | 5162.79 | 2268.17 | 1705.59 | 553.87 | 6733.27 | 2954.40 |
| 2010 | 5303.28 | 2293.54 | 1675.23 | 543.92 | 6865.95 | 2931.62 |
| 2011 | 5654.17 | 2034.57 | 1657.25 | 549.91 | 6895.28 | 2749.21 |
| 2012 | 5673.42 | 1784.26 | 1641.75 | 535.15 | 6574.22 | 2708.82 |
| 2013 | 5372.68 | 1701.18 | 1627.28 | 516.55 | 6235.89 | 2767.38 |
| 2014 | 5389.32 | 1408.03 | 1674.34 | 486.90 | 4810.17 | 2812.74 |
| 2015 | 5360.38 | 1518.46 | 1714.36 | 495.65 | 4935.20 | 2736.90 |
| 2016 | 5734.75 | 1583.47 | 1734.74 | 490.66 | 5329.84 | 2743.01 |
| 2017 | 5865.06 | 1453.55 | 1700.90 | 479.69 | 5327.72 | 2869.68 |
| 2018 | 5844.31 | 1351.08 | 1700.56 | 443.24 | 5194.05 | 2988.49 |
| 2019 | 5635.18 | 1333.79 | 1718.38 | 435.08 | 4954.41 | 2988.61 |
Jožef Stefan Institute - Energy Efficiency Centre
Jožef Stefan Institute - Energy Efficiency Centre
Methodology
The indicator methodology is available only in Slovene (link to the indicator)


