[EN18] Renewable energy sources

Key message

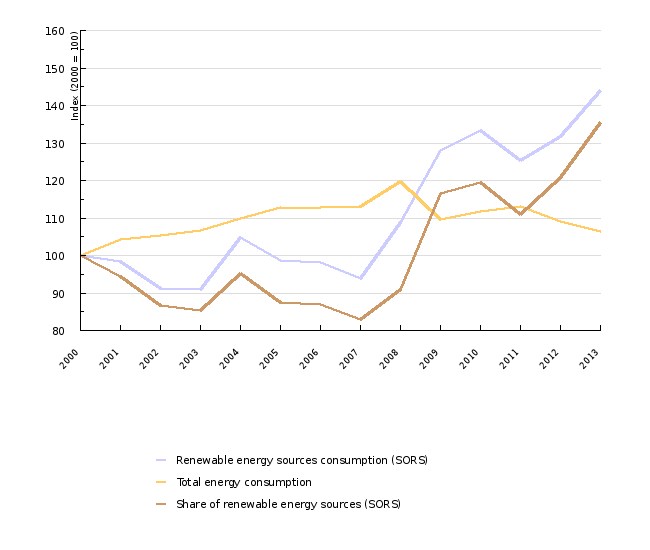
In 2013, renewables accounted for 16.6% of total energy consumption. In comparison to the previous year, their share was higher due to increased use of renewable energy sources as well as the reduction in total energy consumption. The target share for 2010 was exceeded. The share of biofuels in transport was substantially below the target value for 2013.
Definition
The indicator shows the consumption from renewable energy sources in Slovenia, incorporating the use of solar energy, biomass (wood, biogas, biofuels) and waste, geothermal energy, hydropower and wind energy.
The indicator can be shown in relative (share of renewable energy sources) or absolute units (use of renewable energy sources). For the indication in absolute units, a thousand tonnes of oil equivalent (ktoe) are used.
Charts
Statistical Office of the RS, 2012; Jožef Stefan Institute, 2012.
Statistical Office of the RS, 2012; Jožef Stefan Institute, 2012.
| 2000 | 2001 | 2002 | 2003 | 2004 | 2005 | 2006 | 2007 | 2008 | 2009 | ||
|---|---|---|---|---|---|---|---|---|---|---|---|
| Renewable energy sources consumption (SORS) | ktoe | 785 | 772 | 715 | 714 | 822 | 774 | 770 | 737 | 853 | 1004 |
| Total energy consumption | ktoe | 6394 | 6665 | 6730 | 6823 | 7030 | 7207 | 7220 | 7233 | 7650 | 7012 |
| Share of renewable energy sources (SORS) | % | 12 | 12 | 11 | 10 | 12 | 11 | 11 | 10 | 11 | 14 |
| Renewable energy sources consumption (SORS) | Index (2000 = 100) | 100 | 98 | 91 | 91 | 105 | 99 | 98 | 94 | 109 | 128 |
| Total energy consumption | Index (2000 = 100) | 100 | 104 | 105 | 107 | 110 | 113 | 113 | 113 | 120 | 110 |
| Share of renewable energy sources (SORS) | Index (2000 = 100) | 100 | 94 | 87 | 85 | 95 | 87 | 87 | 83 | 91 | 117 |
| 2010 | 2011 | 2012 | 2013 | ||||||||
| Renewable energy sources consumption (SORS) | ktoe | 1045 | 983 | 1034 | 1129 | ||||||
| Total energy consumption | ktoe | 7136 | 7231 | 6981 | 6797 | ||||||
| Share of renewable energy sources (SORS) | % | 15 | 14 | 15 | 17 | ||||||
| Renewable energy sources consumption (SORS) | Index (2000 = 100) | 133 | 125 | 132 | 144 | ||||||
| Total energy consumption | Index (2000 = 100) | 112 | 113 | 109 | 106 | ||||||
| Share of renewable energy sources (SORS) | Index (2000 = 100) | 119 | 111 | 121 | 135 |
Jožef Stefan Institute, 2012; Statistical Office of the RS, 2012.
| 1992 | 1993 | 1994 | 1995 | 1996 | 1997 | 1998 | 1999 | - | 2000 | ||
|---|---|---|---|---|---|---|---|---|---|---|---|
| Wood | ktoe | 236.7 | 264.3 | 263.2 | 262.9 | 262.7 | 262.6 | 262.8 | 230.2 | 451.4 | |
| Biogas | ktoe | 0 | 0 | 0 | 0 | 0 | 0 | 0 | 3.7 | 3.6 | |
| Hydropower | ktoe | 293.4 | 259.8 | 292.3 | 278.6 | 315.3 | 265.9 | 296.6 | 321.5 | 329.7 | |
| Geothermal energy | ktoe | np | np | np | np | np | np | np | np | np | |
| Solar thermal energy | ktoe | np | np | np | np | np | np | np | np | np | |
| Liquid biofuels | ktoe | np | np | np | np | np | np | np | np | np | |
| Total | ktoe | 530.2 | 524 | 555.5 | 541.5 | 578 | 528.5 | 559.4 | 555.4 | 784.7 | |
| 2001 | 2002 | 2003 | 2004 | 2005 | 2006 | 2007 | 2008 | - | 2008 | ||
| Wood | ktoe | 441.2 | 425.5 | 453.8 | 463.4 | 469.5 | 448.7 | 430.2 | 468.7 | 529.7 | |
| Biogas | ktoe | 4.3 | 5.1 | 5.8 | 6.6 | 6.8 | 8.4 | 11.9 | 14.1 | 22.4 | |
| Hydropower | ktoe | 326.4 | 284.9 | 254.3 | 352 | 297.6 | 308.8 | 280.8 | 345.5 | 405.2 | |
| Geothermal energy | ktoe | np | np | np | np | np | np | np | np | 8 | |
| Solar thermal energy | ktoe | np | np | np | np | np | np | np | np | 8.1 | |
| Liquid biofuels | ktoe | np | np | np | np | np | 4.1 | 13.8 | 24.6 | 30.4 | |
| Total | ktoe | 772 | 715.5 | 713.9 | 822.1 | 773.9 | 770 | 736.8 | 852.9 | 1003.8 | |
| 2008 | 2008 | 2008 | 2008 | ||||||||
| Wood | ktoe | 543.2 | 559.4 | 551.4 | 571.5 | ||||||
| Biogas | ktoe | 30.4 | 36 | 38.1 | 34.7 | ||||||
| Hydropower | ktoe | 387.9 | 306 | 334.7 | 396.6 | ||||||
| Geothermal energy | ktoe | 28.9 | 31.3 | 34.6 | 38.4 | ||||||
| Solar thermal energy | ktoe | 9.4 | 14.5 | 23.4 | 28.1 | ||||||
| Liquid biofuels | ktoe | 45.7 | 36.3 | 52 | 60.1 | ||||||
| Total | ktoe | 1045.5 | 983.5 | 1034.3 | 1129.4 |
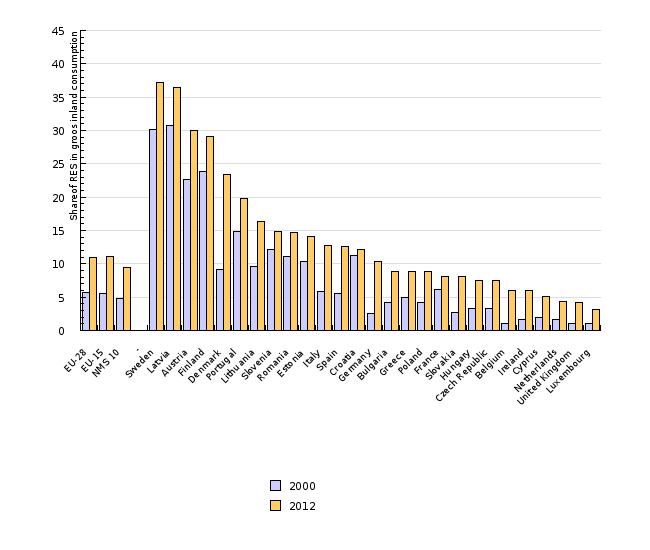
EUROSTAT, 2012
Eurostat, 2012.
| EU-28 | EU-15 | NMS 10 | - | Sweden | Latvia | Austria | Finland | Denmark | Portugal | ||
|---|---|---|---|---|---|---|---|---|---|---|---|
| 2000 | % | 5.645 | 5.606 | 4.852 | 30.147 | 30.822 | 22.686 | 23.905 | 9.104 | 14.868 | |
| 2012 | % | 10.955 | 11.101 | 9.475 | 37.174 | 36.394 | 30.051 | 29.175 | 23.333 | 19.789 | |
| Lithuania | Slovenia | Romania | Estonia | Italy | Spain | Croatia | Germany | Bulgaria | Greece | ||
| 2000 | % | 9.551 | 12.209 | 11.025 | 10.3 | 5.805 | 5.512 | 11.231 | 2.608 | 4.192 | 4.958 |
| 2012 | % | 16.395 | 14.842 | 14.668 | 14.075 | 12.766 | 12.551 | 12.131 | 10.355 | 8.924 | 8.872 |
| Poland | France | Slovakia | Hungary | Czech Republic | Belgium | Ireland | Cyprus | Netherlands | United Kingdom | ||
| 2000 | % | 4.272 | 6.136 | 2.667 | 3.282 | 3.254 | 1.079 | 1.644 | 1.903 | 1.651 | 0.982 |
| 2012 | % | 8.802 | 8.161 | 8.135 | 7.513 | 7.502 | 5.936 | 5.931 | 5.141 | 4.275 | 4.145 |
| Luxembourg | |||||||||||
| 2000 | % | 1.069 | |||||||||
| 2012 | % | 3.098 |
Goals
- 12 % share of renewable energy sources in total energy consumption in 2010;
- 20 % share of renewable energy sources in total energy consumption in the EU in 2020;
- 25 % share of renewable energy sources in final energy use in Slovenia in 2020;
- attainment of the target shares for the content of biofuels in motor vehicle fuels: 2% in 2007, 3% in 2008, 4% in 2009, 5% in 2010, 6,5% in 2013, 7% in 2014 and 7,5% in 2015 (MOP, 2007); (EU, 2009);
- Targets for 2020 are alaborated in EN24 Share of renewables in final energy consumption.
Comment
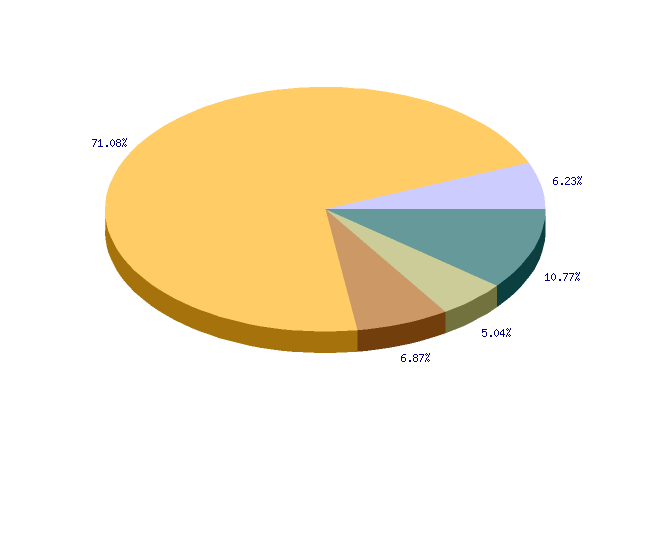
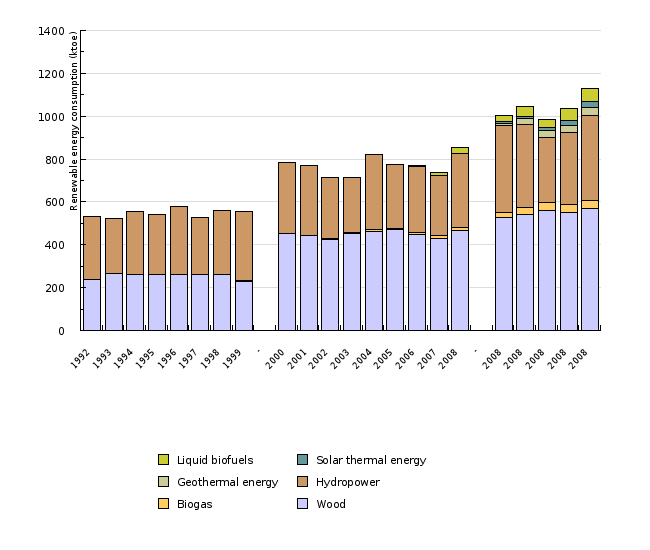
The use of renewable energy sources (RES) in 2013 amounted to 1,129 ktoe, which was 9.2% more than a year earlier (Figure EN 18-1). The highest share was taken by wood and other solid biomass (50.6%); the second most important source was hydropower (35.1%). The shares of other sources were as follows: liquid biofuels 5.3%, geothermal energy 3.4%, biogas 3.1% and solar energy 2.5%.
Given its large forested area (58.4% in 2011 according to the Slovenia Forest Service, 2012), extensive use of wood biomass in Slovenia is expected and rational. Besides wood, solid biomass encompasses bone meal and fats, paper sludge and digestate used in industry. In 2013, wood represented 99% of the use of solid biomass. Most solid biomass is used in households (472 ktoe in 2013), followed by industry (48 ktoe) and transformation (45 ktoe). The Statistical Office of the Republic of Slovenia does not monitor the use of wood biomass in services and agriculture (jointly referred to as ‘other use’), which makes its use in Slovenia underestimated. In 2009, its use in households increased markedly with regard to the preceding years. This increase was largely a consequence of improved methodology for monitoring the use of wood biomass in households. In the period 2002–2008, use of biomass was constant. On the basis of a survey on energy consumption in households, a model was developed in 2009, which has now been used annually to estimate the use of wood biomass. From 2009 onwards, the use of wood biomass in households has been increasing, which can be attributed to a variety of factors: higher prices of fuel oil, economic crisis, promotion of purchase of wood burning boilers and a high percentage of forest owners among Slovenian residents. The use of biomass in industry has been declining since 2005. The main reason for this decline is the shutting down of the Vipap cellulose plant and the decline of the wood processing industry. In 2013, use increased by 19%; however, it was still 27% below the 2000 value. In the field of transformation, the use of wood biomass increased. In 2001 it was 121% higher than in 2000. It increased significantly in 2008 when the large TEŠ, TET and TE-TOL thermal power plants started using wood. In the period 2009–2013, the TE-TOL plant was the only larger thermal power plant that still used wood. The use of wood in district heating is increasing as well since the number of smaller wood biomass systems has been growing due to the incentives provided by the ministry responsible for energy.
The second most important renewable energy source in Slovenia is hydropower. Electricity generated from hydropower amounted to 4,613 GWh (excluding pumped storage hydroelectric power plants) in 2013, which was 18.5% more than a year earlier. Generating capacity increased by 30% in the period 2000–2013 due to the renovation of large hydroelectric power plants (HPP Boštanj, HPP Blanca, HPP Krško) as well as the construction and renovation of small hydroelectric power plants. By 2019, the construction of the last two in the chain of six hydroelectric power plants on the lower Sava is planned to be completed. The total amount of electricity generated by five HPPs (excluding HPP Vrhovo, which was constructed in 1993) will be 720 GWh. Other projects to exploit hydro potential are also being prepared, including: an HPP on the middle Sava, an HPP on the Mura, etc. Electricity generation in HPP is largely influenced by hydrology, which has been worse than average in recent years. In 2013, hydrologic conditions were favourable. The utilisation period of maximum demand was 4,122 h, which was 7% above the average for the last 15 years.
Other renewable energy sources used in Slovenia are as follows: biogas (landfill gas, gas from water treatment plants and other biogases – biogas systems in agriculture), geothermal energy, solar energy and liquid biofuels. The use of biogas increased by 951% over the period 2000–2012. The growth was particularly high after 2008. In 2013, the use of biogas decreased for the first time (by 8.9%), which can be attributed to stricter regulations regarding the use of input substrates. The use of liquid biofuels in transport appeared in 2006 for the first time and increased until 2010. In 2011, use decreased by 20.7%. Growth resumed in 2012 and 2013, reaching 15.6% in 2013. Use of geothermal (heat pumps) and solar energy (thermal solar collectors) in households appeared in the statistics for the first time in 2009, with direct use of geothermal energy in health resorts and agriculture following in 2010. The statistics also follow electricity generation in solar power plants. In 2013, the use of solar energy (thermal solar collectors) was 3% higher than a year earlier. The use of electricity generation in solar power plants has also been increasing (a 32% increase compared to 2012). Total use of geothermal energy increased by 11% in 2013, largely as a result of growth in the number of heat pumps.
The consumption of renewable energy sources in 2013 represented 16.6% of total energy consumption. Thus, the 12% goal set for 2010 was surpassed, which happened in 2009. Meeting the goal was not only a result of the increased use of renewable energy sources and the improved monitoring of their use by the statistics, it was also greatly influenced by the reduction in total energy consumption as a result of the economic crisis and the implementation of energy efficiency measures (for more information, see indicators EN16 Total energy consumption by fuel and EN10 Final energy consumption by sector).
In 2013, the share of biofuels in the structure of fuels used in transport increased by 3.1% compared to the preceding year. This was considerably below the target share for that year (6.5%). The shares notably below the target values were also observed in earlier years. Cancellation of an exemption from excise duty on biofuels, which was introduced in 2014, made meeting the goals even more difficult.
In Slovenia, the use of renewable energy sources is encouraged through various mechanisms. Investments in new devices are stimulated by the Environmental Fund of the Republic of Slovenia through favourable loans and subsidies, which are also provided to final customers by large taxpayers pursuant to the Decree on energy savings requirements. The use of wood biomass and geothermal energy in district heating systems is stimulated by the ministry responsible for energy. Electricity generation from RES is promoted by the support scheme for electricity production from renewable energy sources (for more information see indicator EN19 Electricity production from renewable energy sources). The use of biofuels is encouraged by excise tax exemption which, however, is has only been available for 100% biofuels (and not for blends) since 2014. Also, distributers of liquid motor fuels must meet goals defined by the Decree on the promotion of the use of biofuels and other renewable fuels for the propulsion of motor vehicles (Official Gazette of the Republic of Slovenia, no. 103/07). In order to promote the use of renewable energy sources and meet the target share of RES in gross final energy consumption, the Renewable Energy Action plan was adopted in 2010 (for more information, see indicator EN24 The share of renewables in final energy consumption).
Methodology
Data for Slovenia and other countries
Objectives summarised by: Resolucija o Nacionalnem energetskem programu (ReNEP) (Resolution on the National Energy Programme, Official Gazette of the RS, No. 57/04), proposal of the climate-energy package, Directive 2009/28/EC on the promotion of the use of energy from renewable sources and Pravilnik o vsebnosti biogoriv v gorivih za pogon motornih vozil (Rules on the content of biofuels in motor vehicle fuels, Official Gazette of the RS, No. 83/05, 108/05, 103/07).
Source database or source:
- Joint questionnaire - EUROSTAT (1992-2002) and EUROSTAT > Environment and energy.
- SI-STAT Data Portal > Environment and natural resources > Renewables and wastes > Renewable energy and waste use, Slovenia, annual (after 2002).
- EurObserv'ER.
Data administrator: Statistical Office of the Republic of Slovenia (Jože Zalar), IJS (geothermal and solar energy – Fouad Al Mansour), MESP (biofuels - Mirko Bizjak) and EUROSTAT.
Date of acquisition for this indicator: 8 December 2009
Methodology and frequency of data collection for the indicator: The data were prepared on an annual basis. The data for the period 1992-2002 were obtained from completed questionnaires that were communicated by SORS to EUROSTAT (Joint Annual Questionnaire).
The data after 2002 were obtained on the SORS website on the SI-STAT Data Portal (Environment and natural resources > Renewables and wastes > Renewable energy and waste use, Slovenia, annual). The Statistical Office of the Republic of Slovenia is monitoring the use of hydropower, biomass (wood, wood waste, other renewable waste), biogas and industrial and municipal waste. For the calculation of the share of RES in total energy consumption, the total energy consumption from the EN16 indicator was used. For the use of solar and geothermal energy, the IJS data were used, and for the use of biofuels, the data of the Ministry of Environment and Spatial Planning.
The data for the EU-25 were obtained on the EUROSTAT website under the column »Environment and energy«. The data for the use of individual renewable sources were used: solar energy 5530 gross inland consumption 100900 + biomass and waste 5540 gross inland consumption 100900 + geothermal energy 5550 gross inland consumption 100900 + hydropower 5510 gross inland consumption 100900 + wind energy 5520 gross inland consumption 100900. For the calculation of the share of RES, sector 100900 »Gross inland consumption« was used as the denominator.
Data processing methodology:
Average annual rate of growth calculated using: [(last year/base year) ^ (1/number of years) –1]*100
The share of renewable energy sources in total energy consumption is calculated as the quotient between the total consumption from renewable energy sources and the total energy consumption in an individual year.
For the calculation of the share of RES in total energy consumption, total energy consumption is the denominator and the total energy consumption from RES is the numerator.
A percentage point is a unit used for the comparison of different rates of growth. A percentage point includes an absolute comparison calculated by the formula (nthis year)-(nlast year)=16 %–15 %=1 pp (for instance: if last year the growth was 15 % and this year 16 %, then this year the growth was higher by 1 percentage point). The difference in growth can also be expressed in a relative comparison using the formula [(nthis year/nlast year)*100]–100=[(16 %/15 %)*100]–100=6.7 %, where the growth is indicated in percentages.
Geographical coverage: The EU-15 is composed of the old EU Member States: Austria, Belgium, Denmark, Finland, France, Germany, Greece, Ireland, Italy, Luxembourg, the Netherlands, Portugal, Spain, Sweden, the United Kingdom. The EU-10 (NMS-10) includes the Member States that joined the EU in 2004 (Cyprus, the Czech Republic, Estonia, Hungary, Lithuania, Latvia, Malta, Poland, Slovenia, Slovakia). The EU-25 includes the EU-15 and EU-10.
Information concerning data quality:
- Advantages and disadvantages of the indicator: /
- Relevance, accuracy, robustness, uncertainty:
Reliability of the indicator (archival data): Data reliability is limited, since the use of wood biomass, which represents the most important renewable energy source, is assessed every five years and does not enable the monitoring of the trends of the use of wood biomass. Moreover, the Statistical Office of the Republic of Slovenia also does not monitor the use of solar energy and geothermal energy. The data for 1992–1999 and after 2000 are not comparable due to different assessments on the use of wood biomass.
Uncertainty of the indicator (scenarios/projections): Scenarios and projections are not available.
- Overall assessment (1 = no major comments, 3 = data to be considered with reservation):
Relevance: 1
Accuracy: 2
Completeness over time: 3
Completeness over space: 1
References:
- EEA, 2007. EN29 Renewable Energy.
- EurObserv'ER, 2007. Barometri za toploto iz sonca, fotovoltaiko in geotermalno energijo (Barometers for heat from sun, photovoltaics and geothermal energy).
- IBE, 2005. Indikativni razvojni načrt energetskega sektorja (Indicative development plan of the energy sector).
- MESP, 2009a. Operativni program zmanjševanja emisij toplogrednih plinov do leta 2012 (Operational programme for limiting greenhouse gas emissions until 2012).
- MESP, 2009b. Raba biogoriv v transportnem sektorju v Republiki Sloveniji v letu 2008 (The use of biofuels in transport sector in the Republic of Slovenia in 2008).
- Nowak, 2009. The EU RES Directive and heat pumps.
- Renewable Energy Road Map: Renewable energies in the 21st century: building a more sustainable future (COM(2006) 848 – final).
- Ljubljana thermal power and heating plant, 2009. Megavat (21 March 2009).
- Šoštanj thermal power plant, 2009. Annual report 2008 – Energy for the future.
- Trbovlje thermal power plant, 2009. Annual report for 2008.
- Slovenian Forest Service, 2009. Poročilo ZGS o gozdovih Slovenije za leto 2008 (Slovenian Forest Service report on Slovenia's forests for 2008).


