[KM01] Consumption of pesticides

Key message

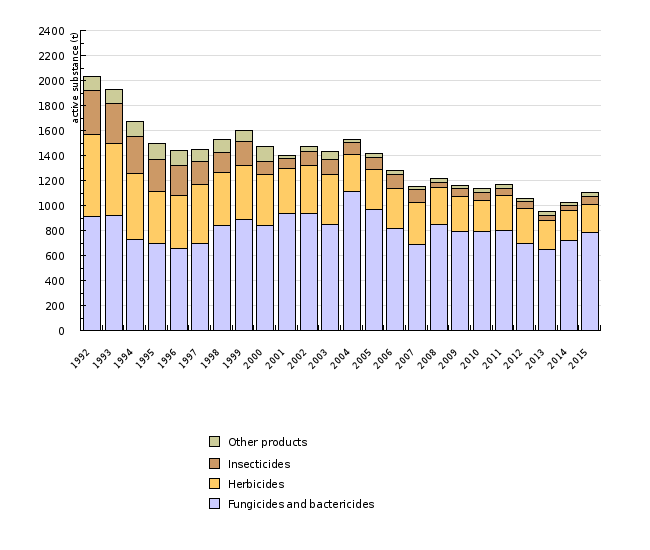
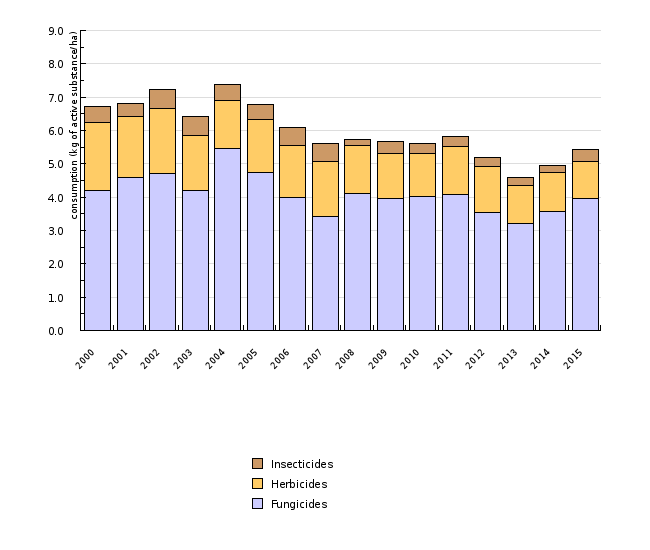
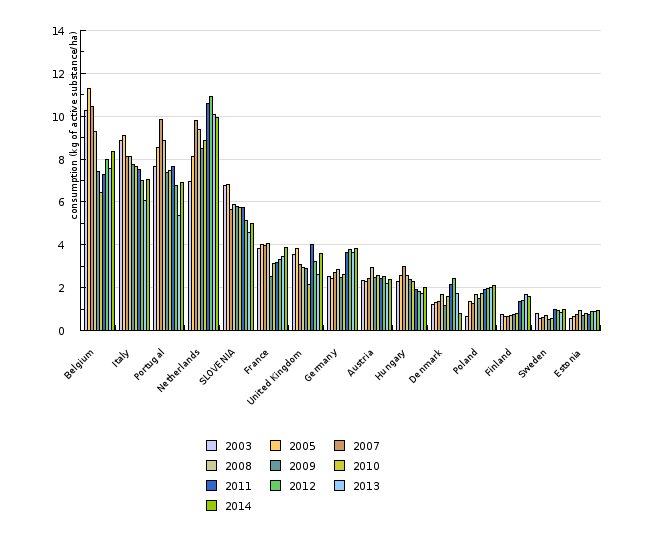
The use of plant protection products (PPPs) in Slovenia in the past 20 years has decreased by almost half, from 2,031 tonnes in 1992 to 1,102 tonnes in 2015. Despite the significant reduction in the use of PPPs in Slovenia, their consumption is still higher than in the majority of other EU Member States, which is due to the greater share of permanent crops in Slovenia. Therefore, fungicides represent 2/3 of total PPPs used in Slovenia, although their consumption has also been reduced considerably in recent years. In 2015, the total consumption of PPPs was 5.6 kilograms per hectare, which is similar to the amounts observed in the last 10-year monitoring period.
Definition
This indicator presents the sale of active substances making up plant protection products (PPPs) and the use of PPPs per hectare of arable land (fields, kitchen gardens and permanent crops).
Plant protection products (PPPs) are active substances or preparations thereof intended to protect plants or plant products. Active substances have general or special effects on detrimental organisms or plants, parts of plants or plant products.
In its present form, the indicator should be seen as only temporary and will need to be improved in the future, particularly with more reliable data on actual surface area of arable land and data on the use of PPPs on arable land. The Statistical Office of the Republic of Slovenia takes into account only agricultural land within agricultural holdings, while the sale of PPPs also takes into account PPPs used outside such holdings. According to various estimates, this land category in Slovenia represents 50,000 hectares or more. In particular, it includes permanent crops, kitchen gardens and some other non-agricultural land (e.g. railways, roads, urban green areas, golf courses and other sports facilities) where PPPs are used for plant protection.
Charts
Statistical Office of the Republic of Slovenia, 2013.
| 1992 | 1993 | 1994 | 1995 | 1996 | 1997 | 1998 | 1999 | 2000 | 2001 | ||
|---|---|---|---|---|---|---|---|---|---|---|---|
| Fungicides and bactericides | t | 916 | 917 | 731 | 693 | 656 | 694 | 839 | 886 | 842.6 | 932.7 |
| Herbicides | t | 655 | 576 | 526 | 418 | 425 | 478 | 428 | 432 | 408.5 | 365.9 |
| Insecticides | t | 353 | 324 | 296 | 260 | 243 | 180 | 154 | 192 | 98 | 80.9 |
| Other products | t | 107 | 109 | 119 | 124 | 117 | 100 | 105 | 92 | 119 | 18.8 |
| Total | t | 2031 | 1962 | 1672 | 1495 | 1444 | 1452 | 1526 | 1602 | 1468.1 | 1398.3 |
| 2002 | 2003 | 2004 | 2005 | 2006 | 2007 | 2008 | 2009 | 2010 | 2011 | ||
| Fungicides and bactericides | t | 936.7 | 844.1 | 1114.5 | 968 | 817 | 689 | 847 | 794 | 789.3 | 796.6 |
| Herbicides | t | 385 | 400.5 | 291.2 | 320 | 322 | 334 | 296 | 276 | 253.8 | 284.9 |
| Insecticides | t | 109.5 | 122.9 | 99.9 | 97 | 110 | 106 | 42 | 69 | 61.8 | 57 |
| Other products | t | 40.8 | 67 | 25.2 | 29 | 32 | 26 | 32 | 23 | 29.4 | 28.7 |
| Total | t | 1471.9 | 1434.5 | 1530.7 | 1414 | 1281 | 1155 | 1218 | 1163 | 1134.4 | 1167.1 |
| 2012 | 2013 | 2014 | 2015 | ||||||||
| Fungicides and bactericides | t | 699.8 | 646.1 | 724 | 785 | ||||||
| Herbicides | t | 279.6 | 232 | 233 | 220 | ||||||
| Insecticides | t | 53.1 | 44.3 | 43 | 69 | ||||||
| Other products | t | 25.9 | 26.3 | 28 | 27 | ||||||
| Total | t | 1058.3 | 950 | 1028 | 1102 |
Phytosanitary Administration of the Republic of Slovenia, 2011.
Statistical Office of the Republic of Slovenia, 2011; Ministry of Agriculture, Forestry and Food, 2005; Phytosanitary Administration of the Republic of Slovenia, 2011.
| 2000 | 2001 | 2002 | 2003 | 2004 | 2005 | 2006 | 2007 | 2008 | 2009 | ||
|---|---|---|---|---|---|---|---|---|---|---|---|
| Fungicides | kg/ha | 4.2 | 4.6 | 4.7 | 4.2 | 5.5 | 4.7 | 4 | 3.4 | 4.1 | 3.9 |
| Herbicides | kg/ha | 2 | 1.8 | 1.9 | 1.6 | 1.4 | 1.6 | 1.6 | 1.7 | 1.4 | 1.4 |
| Insecticides | kg/ha | 0.5 | 0.4 | 0.6 | 0.6 | 0.5 | 0.5 | 0.5 | 0.5 | 0.2 | 0.3 |
| Total | kg/ha | 7.3 | 6.9 | 7.4 | 6.8 | 7.5 | 6.9 | 6.2 | 5.7 | 5.9 | 5.8 |
| 2010 | 2011 | 2012 | 2013 | 2014 | 2015 | ||||||
| Fungicides | kg/ha | 4 | 4.1 | 3.5 | 3.2 | 3.6 | 4 | ||||
| Herbicides | kg/ha | 1.3 | 1.5 | 1.4 | 1.2 | 1.2 | 1.1 | ||||
| Insecticides | kg/ha | 0.3 | 0.3 | 0.3 | 0.2 | 0.2 | 0.4 | ||||
| Total | kg/ha | 5.8 | 6 | 5.3 | 4.7 | 5.1 | 5.6 |
Eurostat, 2009; Statistical Office of the Republic of Slovenia, 2008; Phytosanitary Administration of the Republic of Slovenia, 2009.
| Belgium | Italy | Portugal | Netherlands | SLOVENIA | France | United Kingdom | Germany | Austria | Hungary | ||
|---|---|---|---|---|---|---|---|---|---|---|---|
| 2003 | kg/ha | 10.3 | 8.9 | 7.6 | 6.9 | 6.8 | 3.8 | 3.6 | 2.5 | 2.3 | 2.3 |
| 2005 | kg/ha | 11.3 | 9.1 | 8.6 | 8.1 | 6.8 | 4 | 3.8 | 2.4 | 2.3 | 2.5 |
| 2007 | kg/ha | 10.5 | 8.1 | 9.9 | 9.8 | 5.6 | 4 | 3.1 | 2.7 | 2.4 | 3 |
| 2008 | kg/ha | 9.3 | 8.1 | 8.9 | 9.4 | 5.9 | 4.1 | 2.9 | 2.9 | 3 | 2.6 |
| 2009 | kg/ha | 7.4 | 7.7 | 7.4 | 8.5 | 5.8 | 2.5 | 2.9 | 2.5 | 2.5 | 2.4 |
| 2010 | kg/ha | 6.4 | 7.6 | 7.5 | 8.9 | 5.8 | 3.1 | 2.1 | 2.6 | 2.6 | 2.3 |
| 2011 | kg/ha | 7.3 | 7.5 | 7.7 | 10.6 | 5.7 | 3.2 | 4 | 3.6 | 2.4 | 1.9 |
| 2012 | kg/ha | 8 | 7 | 6.8 | 10.9 | 5.1 | 3.3 | 3.2 | 3.8 | 2.5 | 1.8 |
| 2013 | kg/ha | 7.6 | 6.1 | 5.4 | 10.1 | 4.6 | 3.4 | 2.6 | 3.6 | 2.2 | 1.7 |
| 2014 | kg/ha | 8.4 | 7 | 6.9 | 9.9 | 5 | 3.9 | 3.6 | 3.8 | 2.4 | 2 |
| Denmark | Poland | Finland | Sweden | Estonia | |||||||
| 2003 | kg/ha | 1.2 | 0.6 | 0.8 | 0.8 | 0.6 | |||||
| 2005 | kg/ha | 1.3 | 1.4 | 0.6 | 0.6 | 0.7 | |||||
| 2007 | kg/ha | 1.4 | 1.3 | 0.7 | 0.6 | 0.8 | |||||
| 2008 | kg/ha | 1.7 | 1.7 | 0.7 | 0.7 | 0.9 | |||||
| 2009 | kg/ha | 1.2 | 1.5 | 0.7 | 0.5 | 0.7 | |||||
| 2010 | kg/ha | 1.6 | 1.7 | 0.8 | 0.6 | 0.8 | |||||
| 2011 | kg/ha | 2.1 | 1.9 | 1.3 | 1 | 0.7 | |||||
| 2012 | kg/ha | 2.4 | 1.9 | 1.4 | 0.9 | 0.9 | |||||
| 2013 | kg/ha | 1.7 | 2 | 1.7 | 0.8 | 0.9 | |||||
| 2014 | kg/ha | 0.8 | 2.1 | 1.6 | 1 | 0.9 |
Goals
- Significant improvement of groundwater quality and meeting of limit values for PPPs and their metabolites in drinking water and its sources in compliance with the Rules on Drinking Water,
- reduced use of PPPs, introduction of organic and other environmentally friendly agricultural practices and prevention of further pollution from the point and non-point sources,
- to define trading, control and use of PPPs in order to prevent their adverse effects on people and the environment as a whole.
Comment
Plant protection substances (PPPs, phytopharmaceutical substances, a subgroup of pesticides) are active substances or preparations thereof that affect detrimental organisms or plants, parts of plants or plant products with the purpose of protecting plants. According to data on the sale of PPPs, their consumption in Slovenia has almost halved in the last two decades. 2,031 tonnes of PPPs were used in 1992, which was reduced to only 1,102 tonnes in 2015. Consumption of PPPs over the last five years is rather constant with approximately 5.7 kg of active substances per hectare of arable land. Fluctuations between individual years are largely a consequence of weather conditions. After 2013, when total consumption of PPPs was only 5.1 kg per hectare, which was the lowest value in the entire monitored period, it increased again in 2015, to 5.56 kg per hectare.
In analysing the presented use of PPPs per hectare, it has to be noted that the amount is slightly overestimated, since the official data of the Statistical office of the Republic of Slovenia doesn’t include all the land where plant protection products are applied (agricultural land owned by non-farmers, urban green areas, sports facilities, roads, etc.).
Consumption of PPPs per hectare of arable land in Slovenia is higher than in most other EU countries, but still comparable to countries with similar crops and similar conditions of production. Slovenia is characterised by a large share of permanent crops – orchards, vineyards and hops gardens where the use of PPPs (especially fungicides) per hectare is much higher than in cereals and most root crops. Fungicides represent more than two thirds of all used PPPs in Slovenia. Among them, the largest share is represented by environmentally less problematic inorganic fungicides on the basis of sulphur.
The decreasing consumption of herbicides is a consequence of the use of newer groups of preparations with a lower quantity of active substances per hectare, and a significant change in the seed structure. Consumption of insecticides, which represent less than 5% of all used pesticides, is changing mostly in accordance with weather conditions that affect the development of pests. For the purposes of the protection of consumers of agricultural products and environmental protection, registration, trade and the use of PPPs is regulated by legislation, where special restrictions for their use on water protection areas are laid down.


