[KM01] Consumption of pesticides

Key message

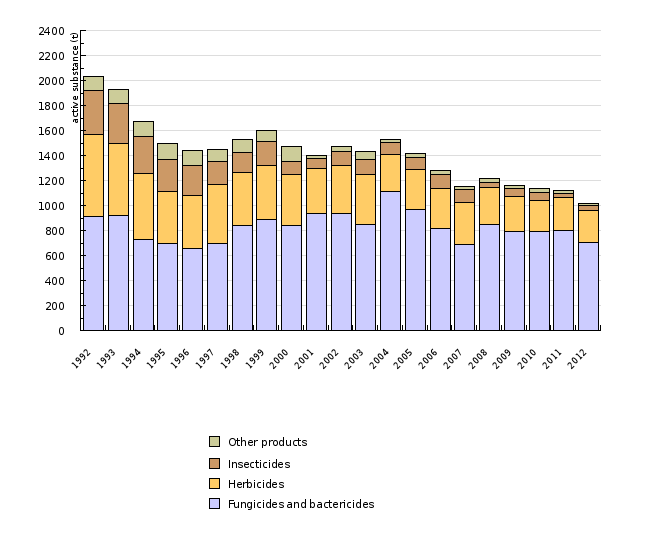
Overall consumption of plant protection products (PPPs) has been decreasing.
Definition
Charts
Statistical Office of the Republic of Slovenia, 2013.
| 1992 | 1993 | 1994 | 1995 | 1996 | 1997 | 1998 | 1999 | 2000 | 2001 | ||
|---|---|---|---|---|---|---|---|---|---|---|---|
| Fungicides and bactericides | t | 916 | 917 | 731 | 693 | 656 | 694 | 839 | 886 | 842.6 | 932.7 |
| Herbicides | t | 655 | 576 | 526 | 418 | 425 | 478 | 428 | 432 | 408.5 | 365.9 |
| Insecticides | t | 353 | 324 | 296 | 260 | 243 | 180 | 154 | 192 | 98 | 80.9 |
| Other products | t | 107 | 109 | 119 | 124 | 117 | 100 | 105 | 92 | 119 | 18.8 |
| Total | t | 2031 | 1962 | 1672 | 1495 | 1444 | 1452 | 1526 | 1602 | 1468.1 | 1398.3 |
| 2002 | 2003 | 2004 | 2005 | 2006 | 2007 | 2008 | 2009 | 2010 | 2011 | ||
| Fungicides and bactericides | t | 936.7 | 844.1 | 1114.5 | 968 | 817 | 689 | 847 | 794 | 789 | 797.1 |
| Herbicides | t | 385 | 400.5 | 291.2 | 320 | 322 | 334 | 296 | 276 | 254 | 264.3 |
| Insecticides | t | 109.5 | 122.9 | 99.9 | 97 | 110 | 106 | 42 | 69 | 62 | 38.6 |
| Other products | t | 40.8 | 67 | 25.2 | 29 | 32 | 26 | 32 | 23 | 29 | 21.9 |
| Total | t | 1471.9 | 1434.5 | 1530.7 | 1414 | 1281 | 1155 | 1218 | 1163 | 1134 | 1121.9 |
| 2012 | |||||||||||
| Fungicides and bactericides | t | 700.2 | |||||||||
| Herbicides | t | 257 | |||||||||
| Insecticides | t | 41.7 | |||||||||
| Other products | t | 17.1 | |||||||||
| Total | t | 1016.1 |
Phytosanitary Administration of the Republic of Slovenia, 2011.
| 2012 | ||
|---|---|---|
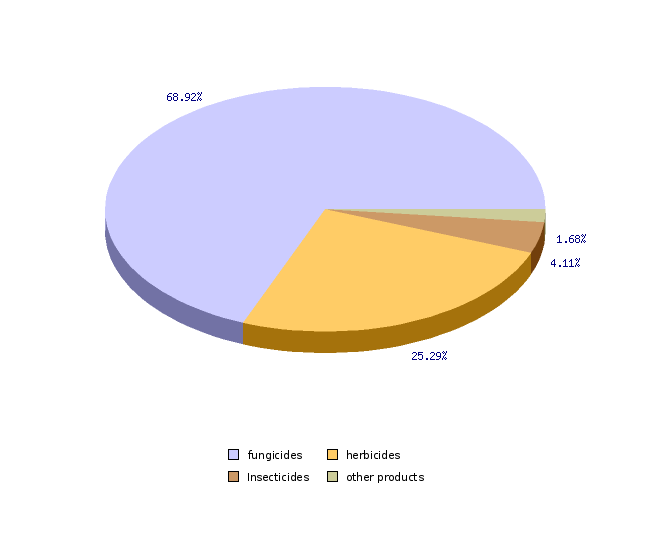
| fungicides | t | 700.2 |
| herbicides | t | 257 |
| Insecticides | t | 41.7 |
| other products | t | 17.1 |
| total | t | 1016.1 |
| fungicides | % | 68.9 |
| herbicides | % | 25.3 |
| Insecticides | % | 4.1 |
| other products | % | 1.7 |
| total | % | 100 |
Statistical Office of the Republic of Slovenia, 2011; Ministry of Agriculture, Forestry and Food, 2005; Phytosanitary Administration of the Republic of Slovenia, 2011.
| 2000 | 2001 | 2002 | 2003 | 2004 | 2005 | 2006 | 2007 | 2008 | 2009 | ||
|---|---|---|---|---|---|---|---|---|---|---|---|
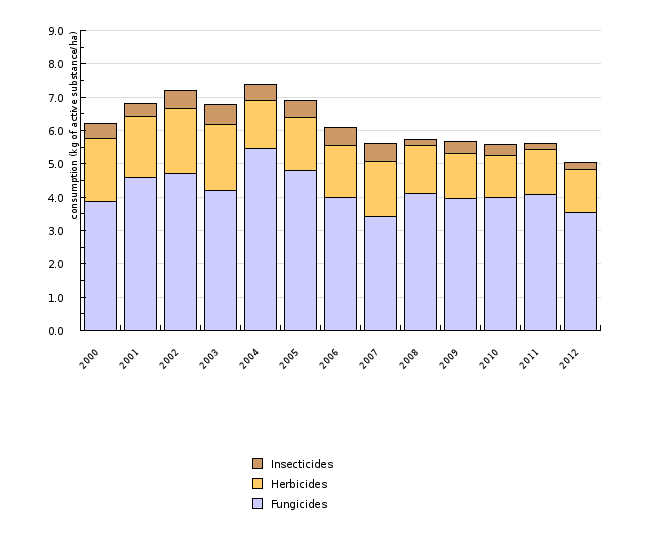
| Fungicides | kg of active substance per ha | 3.9 | 4.6 | 4.7 | 4.2 | 5.5 | 4.8 | 4 | 3.4 | 4.1 | 4 |
| Herbicides | kg of active substance per ha | 1.9 | 1.8 | 1.9 | 2 | 1.4 | 1.6 | 1.6 | 1.7 | 1.4 | 1.4 |
| Insecticides | kg of active substance per ha | 0.5 | 0.4 | 0.6 | 0.6 | 0.5 | 0.5 | 0.5 | 0.5 | 0.2 | 0.3 |
| Total | kg of active substance per ha | 6.8 | 6.9 | 7.4 | 7.1 | 7.5 | 6.9 | 6.2 | 5.7 | 5.9 | 5.8 |
| 2010 | 2011 | 2012 | |||||||||
| Fungicides | kg of active substance per ha | 4 | 4.1 | 3.5 | |||||||
| Herbicides | kg of active substance per ha | 1.3 | 1.4 | 1.3 | |||||||
| Insecticides | kg of active substance per ha | 0.3 | 0.2 | 0.2 | |||||||
| Total | kg of active substance per ha | 5.7 | 5.7 | 5.1 |
Eurostat, 2009; Statistical Office of the Republic of Slovenia, 2008; Phytosanitary Administration of the Republic of Slovenia, 2009.
| Belgium | Italy | Portugal | Netherlands | SLOVENIA | France | United Kingdom | Irland | Gremany | Austria | ||
|---|---|---|---|---|---|---|---|---|---|---|---|
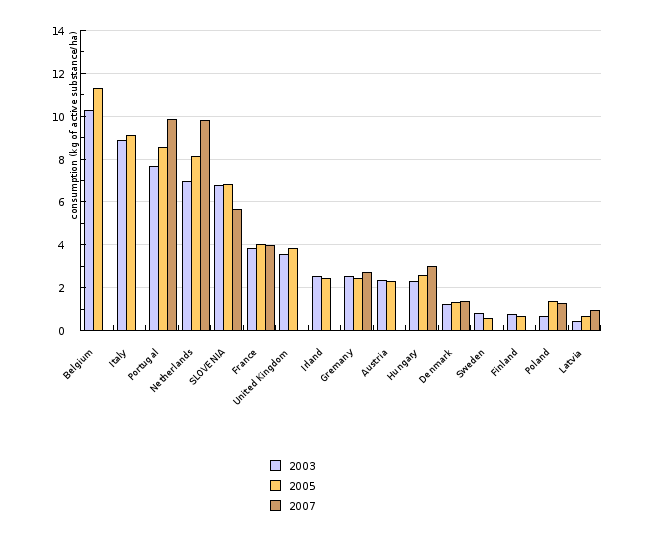
| 2003 | kg/ha | 10.3 | 8.9 | 7.6 | 6.9 | 6.8 | 3.8 | 3.6 | 2.5 | 2.5 | 2.3 |
| 2005 | kg/ha | 11.3 | 9.1 | 8.6 | 8.1 | 6.8 | 4 | 3.8 | 2.4 | 2.4 | 2.3 |
| 2007 | kg/ha | 9.9 | 9.8 | 5.6 | 4 | 2.7 | |||||
| Hungary | Denmark | Sweden | Finland | Poland | Latvia | ||||||
| 2003 | kg/ha | 2.3 | 1.2 | 0.8 | 0.8 | 0.6 | 0.4 | ||||
| 2005 | kg/ha | 2.5 | 1.3 | 0.6 | 0.6 | 1.4 | 0.7 | ||||
| 2007 | kg/ha | 3 | 1.4 | 1.3 | 0.9 |
Comment
Plant protection products (PPPs) (phyto-pharmaceutical products, subgroup of pesticides) are active substances or their preparations intended to protect
plants by producing effects on harmful organisms or plants, parts of plants or plant products.
According to the sales data, the consumption of PPPs in Slovenia decreased by half, from 2,031 tons in 1992 to 1,016 tons in 2012. In the last five years,
consumption has remained steady at around 5.7 kg of active substance per hectare of arable land, with fluctuations, mainly caused by weather conditions. In
2012, the total use of PPPs was 5.1 kg per hectare, which is the lowest use of PPPs in the entire observed period. It should be taken into consideration
that the presented consumption per hectare is slightly overestimated since the data on land do not include all the land where PPPs are used (agricultural
areas owned by non-farmers, lawns, sports fields, etc.).
The consumption of PPPs per hectare of arable land in Slovenia exceeds the average consumption in most EU countries, but it is comparable with the
consumption in the countries with a similar types of crops and production conditions. Slovenia is characterized by a high percentage of permanent crops –
orchards, vineyards and hop fields; in these areas, the consumption of pesticides (mainly fungicides) per hectare is considerably higher than the
consumption of such products in cereals and the majority of root crops. The fungicides still account for more than two thirds of all PPPs used in Slovenia;
the largest share among these is comprised of inorganic fungicides based on sulphur, which are less harmful to the environment.
The consumption of herbicides is declining, owing to the use of new groups of preparations containing lower doses of active substances per hectare and
significant changes in the sowing structure. The consumption of insecticides, accounting for less than one-twentieth of all pesticides used, has varied,
primarily due to weather conditions that favour the development of pests. With a view to protecting consumers of agricultural products as well as the
environment – mainly water resources – the registration, turnover and consumption of PPPs are governed by law. Special restrictions apply to the use of
PPPs in water protection areas.


