[KM01] Consumption of pesticides

Key message

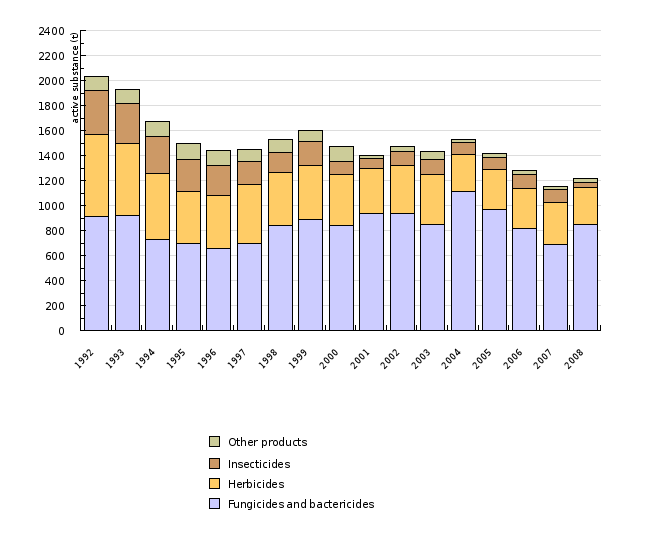
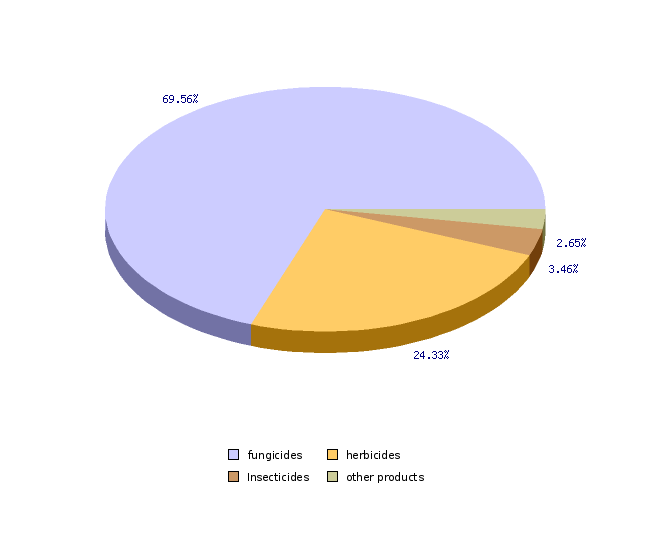
The use of plant protection products (PPPs) in Slovenia has been decreasing in the last ten years, although it is still wider than in most other EU countries. Fungicides represent more than two thirds of all PPPs used in Slovenia, although their use has been radically reduced in the last three years. In 2008, the total use of PPPs was 5.9 kg per hectare.
Definition
The indicator presents the sale of active substances making up the PPPs and the use of PPPs per hectare of arable land (fields, kitchen gardens and permanent crops).
Plant protection products (PPPs) are active substances or their preparations intended to protect plants or plant products. Active substances have general or special effects on adverse organisms or plants, parts of plants or plant products.
Charts
Statistical Office of the Republic of Slovenia, 2008; Phytosanitary Administration of the Republic of Slovenia, 2009.
| 1992 | 1993 | 1994 | 1995 | 1996 | 1997 | 1998 | 1999 | 2000 | 2001 | ||
|---|---|---|---|---|---|---|---|---|---|---|---|
| Fungicides and bactericides | t | 916 | 917 | 731 | 693 | 656 | 694 | 839 | 886 | 842.6 | 932.7 |
| Herbicides | t | 655 | 576 | 526 | 418 | 425 | 478 | 428 | 432 | 408.5 | 365.9 |
| Insecticides | t | 353 | 324 | 296 | 260 | 243 | 180 | 154 | 192 | 98 | 80.9 |
| Other products | t | 107 | 109 | 119 | 124 | 117 | 100 | 105 | 92 | 119 | 18.8 |
| Total | t | 2031 | 1962 | 1672 | 1495 | 1444 | 1452 | 1526 | 1602 | 1468.1 | 1398.3 |
| 2002 | 2003 | 2004 | 2005 | 2006 | 2007 | 2008 | |||||
| Fungicides and bactericides | t | 936.7 | 844.1 | 1114.5 | 968 | 817 | 689 | 847 | |||
| Herbicides | t | 385 | 400.5 | 291.2 | 320 | 322 | 334 | 296 | |||
| Insecticides | t | 109.5 | 122.9 | 99.9 | 97 | 110 | 106 | 42 | |||
| Other products | t | 40.8 | 67 | 25.2 | 29 | 32 | 26 | 32 | |||
| Total | t | 1471.9 | 1434.5 | 1530.7 | 1414 | 1281 | 1155 | 1218 |
Phytosanitary Administration of the Republic of Slovenia, 2009.
| 2008 | ||
|---|---|---|
| fungicides | kg | 847333 |
| herbicides | kg | 296393 |
| Insecticides | kg | 42187 |
| other products | kg | 32239 |
| total | kg | 1218151 |
| fungicides | % | 69.6 |
| herbicides | % | 24.3 |
| Insecticides | % | 3.5 |
| other products | % | 2.6 |
| total | % | 100 |
Phytosanitary Administration of the Republic of Slovenia, 2009.
| 2008 | ||
|---|---|---|
| inorganic fungicides based on copper compounds | kg | 53050 |
| other inorganic fungicides (mainly on the basis of sulfur) | kg | 427609 |
| fungicides based on dithiocarbamates | kg | 176602 |
| other fungicides | kg | 190072 |
| total | kg | 847333 |
| inorganic fungicides based on copper compounds | % | 6.3 |
| other inorganic fungicides (mainly on the basis of sulfur) | % | 50.5 |
| fungicides based on dithiocarbamates | % | 20.8 |
| other fungicides | % | 22.4 |
| total | % | 100 |
Statistical Office of the Republic of Slovenia, 2008; Ministry of Agriculture, Forestry and Food, 2005; Phytosanitary Administration of the Republic of Slovenia, 2009.
| 2000 | 2001 | 2002-SURS | 2002 - MKGP | 2003 | 2004 | 2005 | 2006 | 2007 | 2008 | ||
|---|---|---|---|---|---|---|---|---|---|---|---|
| Fungicides | kg/ha | 3.9 | 4.6 | 4.7 | 3.5 | 4.2 | 5.5 | 4.8 | 4 | 3.4 | 4.1 |
| Herbicides | kg/ha | 1.9 | 1.8 | 1.9 | 1.4 | 2 | 1.4 | 1.6 | 1.6 | 1.7 | 1.4 |
| Insecticides | kg/ha | 0.5 | 0.4 | 0.6 | 0.4 | 0.6 | 0.5 | 0.5 | 0.5 | 0.5 | 0.2 |
| Total | kg/ha | 6.8 | 6.9 | 7.4 | 5.5 | 7.1 | 7.5 | 6.9 | 6.2 | 5.7 | 5.9 |
Eurostat, 2009; Statistical Office of the Republic of Slovenia, 2008; Phytosanitary Administration of the Republic of Slovenia, 2009.
| Latvia | Poland | Sweden | Ireland | Finland | Austria | Denmark | United Kingdom | Germany | Hungary | ||
|---|---|---|---|---|---|---|---|---|---|---|---|
| 2003 | kg/ha | 0.3 | 0.5 | 0.7 | 0.7 | 0.7 | 1 | 1.1 | 1.4 | 1.8 | 2 |
| 2005 | kg/ha | 0.4 | 1.1 | 0.5 | 0.7 | 0.6 | 1 | 1.2 | 1.5 | 1.7 | 2.3 |
| 2007 | kg/ha | 0.6 | 1 | np | np | np | np | 1.3 | np | 1.9 | 2.6 |
| France | Slovenia | Netherlands | Portugal | Belgium | Italy | ||||||
| 2003 | kg/ha | 2.7 | 2.8 | 3.9 | 4.6 | 6.3 | 6.6 | ||||
| 2005 | kg/ha | 2.8 | 2.9 | 4.8 | 4.4 | 7.1 | 6.7 | ||||
| 2007 | kg/ha | 2.8 | 2.3 | 5.6 | 4.8 | np | np |
Goals
- major improvement of the groundwater situation and reaching of margin values for PPPs and their metabolites in drinking water and its sources in compliance with the Rules on Drinking Water,
- reduced use of PPPs, introduction of organic and other environment friendly forms of agriculture, and prevention of further pressure from the point and non-point sources,
- defining the trading, control and use of PPPs in order to prevent their adverse effects on the people and the environment as a whole.
Comment
The use of plant protection products (PPP) in the context of protecting plants against diseases, pests and weeds is one of the basic technological measures in crop growing for improving growth and development, and increasing the quantity and quality of the crop yield.
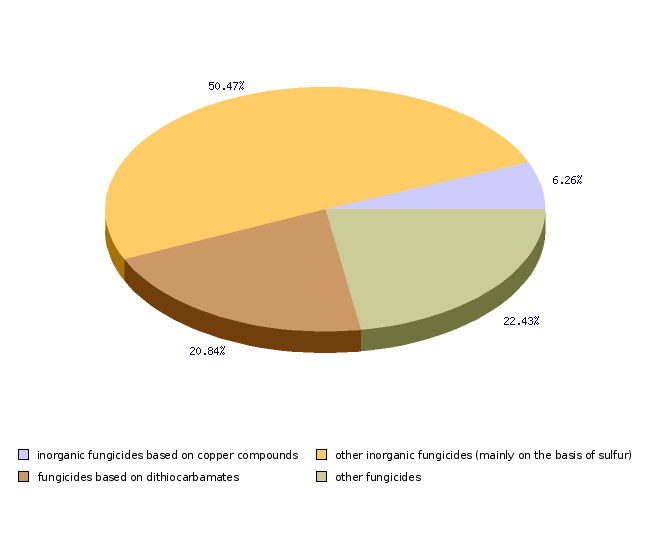
The use of PPPs in Slovenia in the last ten years has been quite constant with some minor oscillations. After 2004, when the use of PPPs increased somewhat unexpectedly compared to the use in 2000-2003 on the account of the fungicides, the trend of reduction has continued in the last four years, so that in 2007 we noticed the lowest use since the sale of PPPs is being recorded. In 2008, the use of PPPs was slightly higher again, but still much lower than in the previous years. Regarding the structure of the use of PPPs, the fungicides still account for more than two thirds of all PPPs used in Slovenia; among them the largest share are inorganic fungicides based on sulphur which are less pressing on the environment.
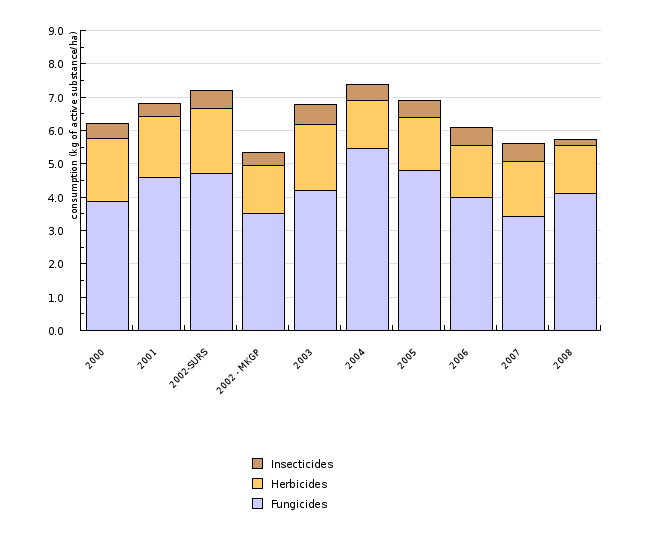
The use of PPPs per hectare of arable land in the period 2000–2007 has been slightly increasing until 2004, namely from 6.8 kg of active substances/ha in 2000 to 7.5 kg of active substances/ha in 2004, while in 2005 it was reduced again to 6.9 kg of active substances/ha. In the years 2006 and 2007, the load on agricultural land decreased additionally by more than one kg - to 5.74 kg of active substances/ha, which is the lowest level so far, or in the period since the sale of PPPs has been officially recorded. In 2008, the use of PPPs per hectare slightly increased again to 5.9 kg per hectare. Among the plant protection products, the use of fungicides has been reduced most radically in the last three years, although in 2008 these represented more than 2/3 of all used plant protection products in Slovenia (69.5%). As regards herbicides, their use was again a little lower in 2008 compared to the last three-year period and was comparable with the 2004 level, namely 1.44 kg per hectare. This is much lower compared to the years between 2000 and 2003, when the use of herbicides per ha was higher by 25% in average. In the case of insecticides, after seven years of quite constant use ranging between 0.45 kg of active substances/ha in 2000 and 0.53 kg of active substances/ha in 2007, we recorded in average more than 50% lower use in 2008, only 0.2 kg per hectare, which, taking into account the professional use of insecticides, is primarily the result of unfavourable weather conditions for the development of adverse organisms in the previous year.
In analysing the presented use of PPPs per hectare it has to be noted that it is slightly overestimated, since the official data of the Statistical office of the Republic of Slovenia do not include all the land where plant protection products have been applied. Slovenia is namely characterised by fragmented parcels and ownership of the cultivated land. Much of this land is owned by non-farmers who are not included in the official statistics, which prevents any reliable data processing. Comparison of the estimated use of PPPs based on two sources on the surfaces of arable land in 2002 (SORS and MAFF) shows that the use based on SORS data could be overestimated by approximately 35% (Figure KM01-4).
The use of plant protection products per hectare of arable land in Slovenia is higher than in most other EU countries, but still comparable to the countries with similar crops and similar conditions of production. Slovenia is characterised by a large share of permanent plantations – orchards, vineyards and hop gardens where the use of plant protection products (especially fungicides) per hectare is much higher than in cereals and most field crops.
Methodology
Data for Slovenia:
Objectives summarized by: the National Environmental Action Programme (NEAP) (OG RS No 83/99) and the Plant Protection Products Act (OG RS Nos 98/04 and 35/07, official consolidated text).
Source database or source: Data on the production and sale of plant protection products (PPPs) in Slovenia are collected by the Phytosanitary Administration of the Republic of Slovenia (PARS), and data on the utilised agricultural area and arable land by the Statistical office of the Republic of Slovenia (SORS). Data on agricultural land are occasionally prepared and managed also at the Ministry of Agriculture, Forestry and Food (MAFF) (the years 2002 and 2005).
Data administrator: SORS and PARS
Data acquisition date for this indicator: 18.11.2009
Methodology and frequency of data collection for the indicator: Data on the production and sale of PPPs in Slovenia are collected annually by the PARS following the obligatory data reporting by companies engaged in the marketing and sale of PPPs. Due to the method of collecting and processing data for the previous year, data are available for a little more than a year ago (e.g. in the beginning of 2008 for 2006). In the case of data concerning the sale of PPPs for 2008, we therefore used data which were obtained from PARS. Data on utilised agricultural area and arable land are collected by the SORS under periodic surveys published annually in the Statistical Yearbooks of the Republic of Slovenia. Data on agricultural land are occasionally also prepared and managed by the MAFF (the years 2002 and 2005), where these data differ quite a lot from those prepared by the Statistical Office of the Republic of Slovenia, and are based on aerial photographs.
Data processing methodology: Figures show the total quantity of PPPs sold, the sale of individual groups of PPPs (fungicides, herbicides, insecticides), and the share of PPPs sale in the period 1992-2008. The use of PPPs per hectare of arable land is calculated (fields, kitchen gardens and permanent crops), and a comparison given with some of the Member States (EU-27), for which we managed to obtain data from the Eurostat database.
Information concerning data quality:
- Advantages and disadvantages of the indicator: The indicator shows official data of PPPs sale and circulation in Slovenia which could be seen as sufficiently reliable. This is also confirmed by the estimate of the PPPs consumption which is prepared separately by companies involved in the PPPs circulation and sale in Slovenia. To a small extent, this estimate is made difficult by the free flow of goods and services within the EU countries, as it is difficult to control the quantities of unofficially exported and imported PPPs by their users. The indicator on the use of PPPs per ha is much less reliable. There is no doubt that it is overestimated, since the official data of the RS Statistical office does not cover the entire land surface where PPPs are applied in our country. The RS Statistical office namely takes into account only agricultural land within farm holdings, while the sale also includes PPPs used outside farm holdings. According to some estimates, such category of land in Slovenia covers more than 50,000 ha. Slovenia is namely characterised by fragmented parcels and ownership of the cultivated land. Much of arable land owned by non-farmers (kitchen gardens, vineyards) and some other non-agricultural land subject to plant protection measures by using PPPs are not included in the official statistics thus preventing a more reliable data processing.
- Relevance, accuracy, robustness, uncertainty:
Reliability of the indicator (archival data): data on the use of PPPs are reliable, while data on the use per ha have to be improved. The indicator will have to be upgraded in the future, especially with more reliable data on the actual arable land surface, and data on the use of PPPs on this land.
Uncertainty of the indicator (scenarios/projections): Scenarios and projections are not available.
- Overall assessment (1 = no major comments, 3 = data to be considered with reservation): 3
Relevance: 1 for data for the use of PPPs, 2-3 for data on the use of PPPs per ha.
Accuracy: 1 for data for the use of PPPs, 2-3 for data on the use of PPPs per ha.
Completeness over time: 1
Completeness over space: 1 for data on the use of PPPs, 2 for data on the use of PPPs per ha.
Data for other countries:
Source database or source: Data on the production, sale and the use of PPPs have been collected by different organisations, of which the most important include Eurostat, OECD and the ECPA (European Crop Protection Association). Data which individual organisations dispose of have been obtained in various ways and for different periods which is why they differ among each other.
In case of Eurostat data, the problem is insufficient data for the EU-27 countries. Data are available at: Eurostat > Agriculture, forestry and fisheries > Food: From farm to fork statistics (food) > Inputs to the food chain (food_in) > Input into agriculture: feedingstuffs, seed, fertilisers, plant protection products (food_in_a) > Use of plant protection products and agriculture (food_in_apest2).
Data administrator: Eurostat, OECD, ECPA
Data acquisition date for this indicator: 20.11.2009
Methodology and frequency of data collection for the indicator: Data on the production, sale and the use of PPPs have been collected by different organisations, of which the most important include Eurostat, OECD and the European Crop Protection Association (ECPA). Data which individual organisations dispose of have been obtained in various ways and for different periods which is why they differ among each other. In case of Eurostat data, the problem is insufficient data for the EU-27 countries, since a fair number of countries still fail to send the agreed information.
Data processing methodology: Figures show the total quantity of PPPs sold, the sale of individual PPPs groups (fungicides, herbicides, insecticides), and the share of PPPs sale in the period 1992-2008. The use of PPPs per hectare of arable land has been calculated (fields, kitchen gardens and permanent crops), and a comparison with some Member States given (EU-27), for which we managed to obtain data from the Eurostat database.
Information concerning data quality:
- Advantages and disadvantages of the indicator: The indicator shows official data of PPPs sale and circulation in Slovenia which could be seen as sufficiently reliable. The problem or the weakness of the indicator is insufficient data for the EU-27 countries, since a fair number of countries still fail to send the agreed information.
- Relevance, accuracy, robustness, uncertainty:
Reliability of the indicator (archival data): data for the use of PPPs are reliable and comparable only for certain countries within the EU-27, while data on the use per ha in the past are even less comparable and reliable.
Uncertainty of the indicator (scenarios/projections): Scenarios and projections are not available.
- Overall assessment (1 = no major comments, 3 = data to be considered with reservation): 2
Relevance: 1
Accuracy: 1
Completeness over time: 2
Completeness over space: 3
Other sources and literature:
- Phytosanitary Administration of RS, 2009; Sector for PPPs and mineral fertilisers, personal communication.
- The RS Statistical Office, 2009. The RS Statistical Yearbooks 2001-2008.


