[ZR09] Emissions of substances that cause acidification and eutrophication
[ZR09] Emissions of substances that cause acidification and eutrophication

Key message

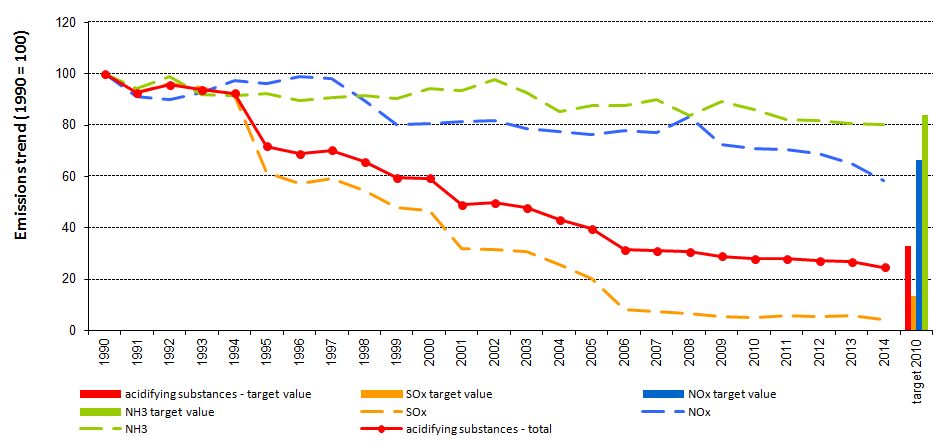
The total emissions of the pollutants that contribute to acidification and eutrophication decreased by 75% in Slovenia in the period 1990–2014. Emissions of SOx decreased by 96%, NOx by 42% and NH3 by 20%. In 2014, emissions of sulphur oxides, nitrogen oxides and ammonia were below the prescribed target values.
Charts
Figure ZR09-1: Emissions of substances that cause acidification and eutrophication, Slovenia, 1990-2014
Sources:
National database on air emissions, Slovenian Environment Agency, 2016
| 1990 | 1991 | 1992 | 1993 | 1994 | 1995 | 1996 | 1997 | 1998 | 1999 | ||
|---|---|---|---|---|---|---|---|---|---|---|---|
| SOx | kt acid equivalents | 6.3 | 5.8 | 6 | 5.9 | 5.7 | 3.9 | 3.6 | 3.7 | 3.4 | 3 |
| NOx | kt acid equivalents | 1.5 | 1.3 | 1.3 | 1.4 | 1.4 | 1.4 | 1.5 | 1.4 | 1.3 | 1.2 |
| NH3 | kt acid equivalents | 1.4 | 1.3 | 1.4 | 1.3 | 1.3 | 1.3 | 1.3 | 1.3 | 1.3 | 1.3 |
| acidifying substances - total | kt acid equivalents | 9.1 | 8.5 | 8.7 | 8.6 | 8.5 | 6.6 | 6.3 | 6.4 | 6 | 5.4 |
| SOx | index (1990 = 100) | 100 | 92.7 | 96.2 | 94.7 | 91.5 | 61.6 | 57.4 | 59.2 | 54.6 | 47.7 |
| NOx | index (1990 = 100) | 100 | 91.1 | 89.9 | 92.7 | 97.4 | 96 | 98.9 | 98 | 89.6 | 80.1 |
| NH3 | index (1990 = 100) | 100 | 94.2 | 98.7 | 91.7 | 91.4 | 92.2 | 89.5 | 90.8 | 91.3 | 90.5 |
| acidifying substances - total | index (1990 = 100) | 100 | 92.7 | 95.6 | 93.9 | 92.4 | 71.8 | 69 | 70.2 | 65.8 | 59.5 |
| SOx target value | index (1990 = 100) | ||||||||||
| NOx target value | index (1990 = 100) | ||||||||||
| NH3 target value | index (1990 = 100) | ||||||||||
| acidifying substances - target value | index (1990 = 100) | ||||||||||
| 2000 | 2001 | 2002 | 2003 | 2004 | 2005 | 2006 | 2007 | 2008 | 2009 | ||
| SOx | kt acid equivalents | 2.9 | 2 | 2 | 1.9 | 1.6 | 1.3 | 0.5 | 0.5 | 0.4 | 0.3 |
| NOx | kt acid equivalents | 1.2 | 1.2 | 1.2 | 1.2 | 1.1 | 1.1 | 1.1 | 1.1 | 1.2 | 1.1 |
| NH3 | kt acid equivalents | 1.3 | 1.3 | 1.4 | 1.3 | 1.2 | 1.2 | 1.2 | 1.3 | 1.2 | 1.2 |
| acidifying substances - total | kt acid equivalents | 5.4 | 4.5 | 4.6 | 4.4 | 3.9 | 3.6 | 2.9 | 2.9 | 2.8 | 2.6 |
| SOx | index (1990 = 100) | 46.6 | 31.8 | 31.6 | 30.8 | 25.5 | 20.4 | 8.3 | 7.4 | 6.5 | 5.4 |
| NOx | index (1990 = 100) | 80.5 | 81.2 | 81.7 | 78.8 | 77.5 | 76.5 | 77.7 | 77.2 | 83.2 | 72.3 |
| NH3 | index (1990 = 100) | 94.1 | 93.3 | 97.8 | 92.5 | 85.2 | 87.6 | 87.6 | 89.9 | 83.8 | 89 |
| acidifying substances - total | index (1990 = 100) | 59.3 | 49.2 | 49.8 | 48 | 43 | 39.7 | 31.6 | 31.2 | 30.7 | 28.9 |
| SOx target value | index (1990 = 100) | ||||||||||
| NOx target value | index (1990 = 100) | ||||||||||
| NH3 target value | index (1990 = 100) | ||||||||||
| acidifying substances - target value | index (1990 = 100) | ||||||||||
| 2010 | 2011 | 2012 | 2013 | 2014 | target 2010 | ||||||
| SOx | kt acid equivalents | 0.3 | 0.4 | 0.3 | 0.4 | 0.3 | 0.8 | ||||
| NOx | kt acid equivalents | 1 | 1 | 1 | 1 | 0.9 | 1 | ||||
| NH3 | kt acid equivalents | 1.2 | 1.2 | 1.1 | 1.1 | 1.1 | 1.2 | ||||
| acidifying substances - total | kt acid equivalents | 2.6 | 2.6 | 2.5 | 2.4 | 2.3 | 3 | ||||
| SOx | index (1990 = 100) | 5 | 5.9 | 5.4 | 5.8 | 4.4 | |||||
| NOx | index (1990 = 100) | 70.8 | 70.5 | 68.9 | 65 | 58.4 | |||||
| NH3 | index (1990 = 100) | 85.9 | 82.2 | 81.8 | 80.6 | 80.3 | |||||
| acidifying substances - total | index (1990 = 100) | 28 | 28 | 27.3 | 26.8 | 24.7 | |||||
| SOx target value | index (1990 = 100) | 13.4 | |||||||||
| NOx target value | index (1990 = 100) | 66.5 | |||||||||
| NH3 target value | index (1990 = 100) | 84 | |||||||||
| acidifying substances - target value | index (1990 = 100) | 32.8 |
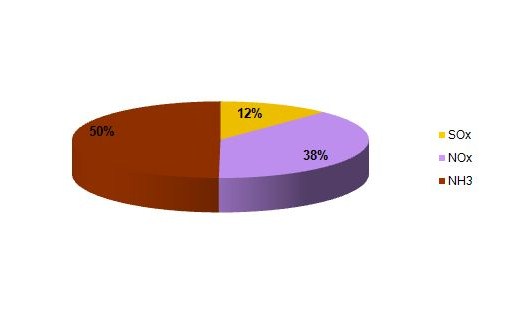
Figure ZR09-2: Structure of of substances that cause acidification and eutrophication, by substance, Slovenia, 2014
Sources:
National database on air emissions, Slovenian Environment Agency, 2016
| 2014 | ||
|---|---|---|
| SOx | kt acid equivalents | 0 |
| NOx | kt acid equivalents | 1 |
| NH3 | kt acid equivalents | 1 |
| acidifying substances - total | kt acid equivalents | 2 |
| SOx | % | 12 |
| NOx | % | 37 |
| NH3 | % | 48 |
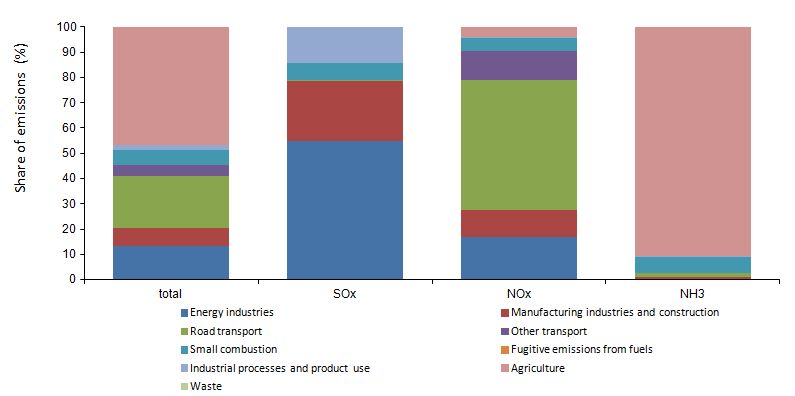
Figure ZR09-3: Structure of of substances that cause acidification and eutrophication, by sector, Slovenia, 2014
Sources:
National database on air emissions, Slovenian Environment Agency, 2016
| total | SOx | NOx | NH3 | ||
|---|---|---|---|---|---|
| Energy industries | kt acid equivalents | 0.3 | 0.15 | 0.15 | 0 |
| Manufacturing industries and construction | kt acid equivalents | 0.16 | 0.07 | 0.09 | 0.01 |
| Road transport | kt acid equivalents | 0.47 | 0 | 0.44 | 0.02 |
| Other transport | kt acid equivalents | 0.1 | 0 | 0.1 | 0 |
| Small combustion | kt acid equivalents | 0.13 | 0.02 | 0.04 | 0.07 |
| Fugitive emissions from fuels | kt acid equivalents | 0 | 0 | 0 | 0 |
| Industrial processes and product use | kt acid equivalents | 0.05 | 0.04 | 0 | 0 |
| Agriculture | kt acid equivalents | 1.05 | 0 | 0.03 | 1.02 |
| Waste | kt acid equivalents | 0 | 0 | 0 | 0 |
| total | kt acid equivalents | 2.26 | 0.28 | 0.86 | 1.13 |
| Energy industries | % | 13.15 | 54.78 | 17.03 | 0 |
| Manufacturing industries and construction | % | 7.23 | 23.86 | 10.3 | 0.81 |
| Road transport | % | 20.66 | 0.38 | 51.76 | 1.92 |
| Other transport | % | 4.28 | 0.16 | 11.22 | 0 |
| Small combustion | % | 5.97 | 6.62 | 5.22 | 6.37 |
| Fugitive emissions from fuels | % | 0 | 0 | 0.01 | 0 |
| Industrial processes and product use | % | 2.08 | 14.17 | 0.47 | 0.34 |
| Agriculture | % | 46.55 | 0 | 3.94 | 90.44 |
| Waste | % | 0.08 | 0.03 | 0.05 | 0.12 |
Figure ZR09-4: Emissions of substances that cause acidification and eutrophication, EU-28 countries, 2013 [ in kg/capita]
Sources:
CLRTAP/EMEP, CEIP, 2016, Eurostat, 2016
Note: Data for Greece is not availible.
| Estonia | Luxembourg | Ireland | Poland | Bulgaria | Lithuania | Cyprus | Denmark | Finland | Czech Republic | ||
|---|---|---|---|---|---|---|---|---|---|---|---|
| NOx | kt acid equivalents | 1.28 | 0.05 | 0.6 | 25 | 5.9 | 0.56 | 0.52 | 0.36 | 1.36 | 3.97 |
| SOx | kt acid equivalents | 0.72 | 0.61 | 1.67 | 15.72 | 2.9 | 1.12 | 0.37 | 2.46 | 2.99 | 3.71 |
| NH3 | kt acid equivalents | 0.77 | 0.36 | 6.19 | 15.59 | 1.83 | 2.41 | 0.27 | 4.31 | 2.17 | 4.07 |
| emissions of acidifying substances | kt acid equivalents | 2.77 | 1.02 | 8.47 | 56.32 | 10.63 | 4.08 | 1.17 | 7.13 | 6.52 | 11.74 |
| country population | number | 1315819 | 549680 | 4605501 | 38017856 | 7245677 | 2943472 | 858000 | 5627235 | 5451270 | 10512419 |
| emissions per capita | kg/capita | 2.1 | 1.85 | 1.84 | 1.48 | 1.47 | 1.39 | 1.36 | 1.27 | 1.2 | 1.12 |
| Slovenia | Germany | Spain | France | Slovakia | Romania | EU-28 | Latvia | Austria | Malta | ||
| NOx | kt acid equivalents | 0.28 | 12.13 | 7.96 | 5.29 | 1.41 | 5.49 | 95.91 | 0.12 | 0.5 | 0.15 |
| SOx | kt acid equivalents | 0.86 | 26.62 | 17.43 | 19.25 | 1.84 | 4.74 | 168.78 | 0.75 | 3.28 | 0.14 |
| NH3 | kt acid equivalents | 1.13 | 43.51 | 21.92 | 41.62 | 2.17 | 9.55 | 228.92 | 1.03 | 3.94 | 0.09 |
| emissions of acidifying substances | kt acid equivalents | 2.26 | 82.26 | 47.31 | 66.16 | 5.43 | 19.79 | 493.61 | 1.9 | 7.72 | 0.38 |
| country population | number | 2061085 | 80767463 | 46512199 | 65889148 | 5415949 | 19947311 | 506944075 | 2001468 | 8506889 | 425384 |
| emissions per capita | kg/capita | 1.1 | 1.02 | 1.02 | 1 | 1 | 0.99 | 0.97 | 0.95 | 0.91 | 0.89 |
| Belgium | Hungary | Netherlands | Croatia | Italy | United Kingdom | Portugal | Sweden | ||||
| NOx | kt acid equivalents | 1.32 | 0.85 | 0.91 | 0.49 | 4.08 | 9.61 | 1.09 | 0.75 | ||
| SOx | kt acid equivalents | 4.28 | 2.61 | 5.11 | 1.2 | 17.18 | 20.64 | 3.47 | 2.94 | ||
| NH3 | kt acid equivalents | 3.9 | 4.91 | 7.87 | 1.5 | 23.14 | 16.54 | 2.91 | 3.17 | ||
| emissions of acidifying substances | kt acid equivalents | 9.51 | 8.37 | 13.88 | 3.19 | 44.4 | 46.79 | 7.46 | 6.86 | ||
| country population | number | 11203992 | 9877365 | 16829289 | 4246809 | 60782668 | 64351155 | 10427301 | 9644864 | ||
| emissions per capita | kg/capita | 0.85 | 0.85 | 0.83 | 0.75 | 0.73 | 0.73 | 0.72 | 0.71 |
Methodology
Date of data source summarization


![Figure ZR09-4: Emissions of substances that cause acidification and eutrophication, EU-28 countries, 2013 [ in kg/capita]](/sites/default/files/charts/migrated_charts/graph_16074_en.jpg)