[VD05] Nitrates in groundwater

Key message

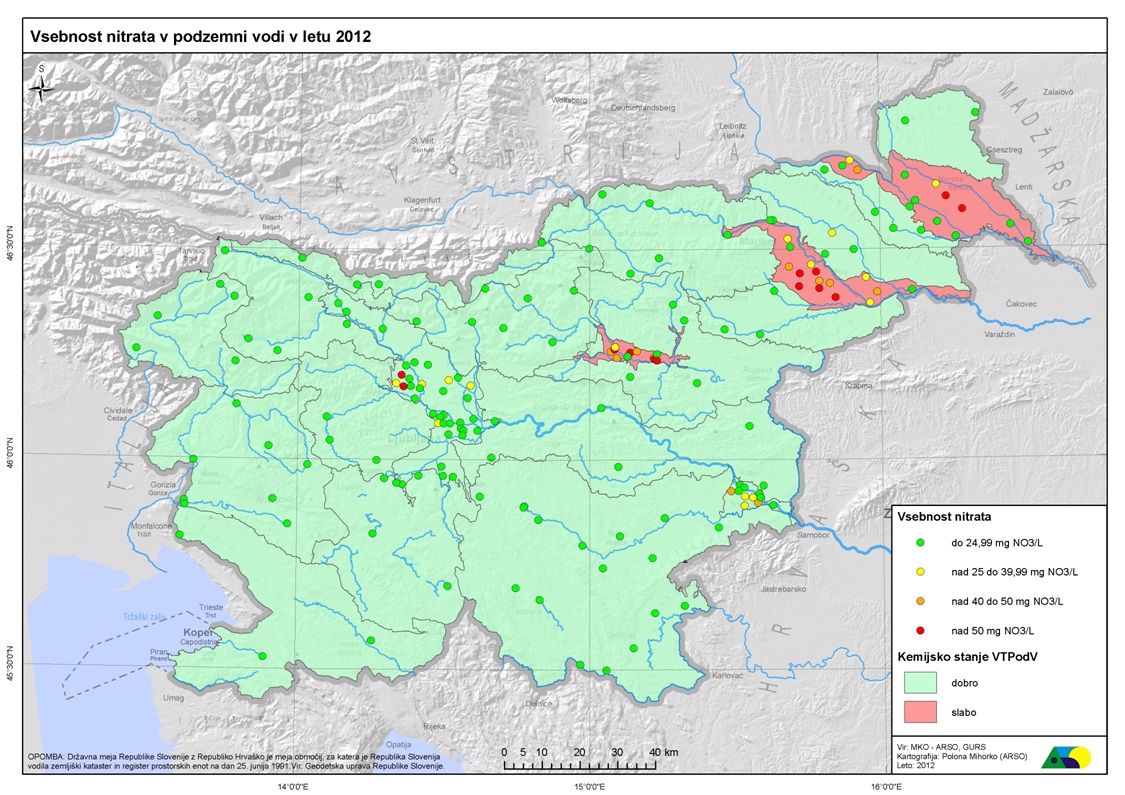
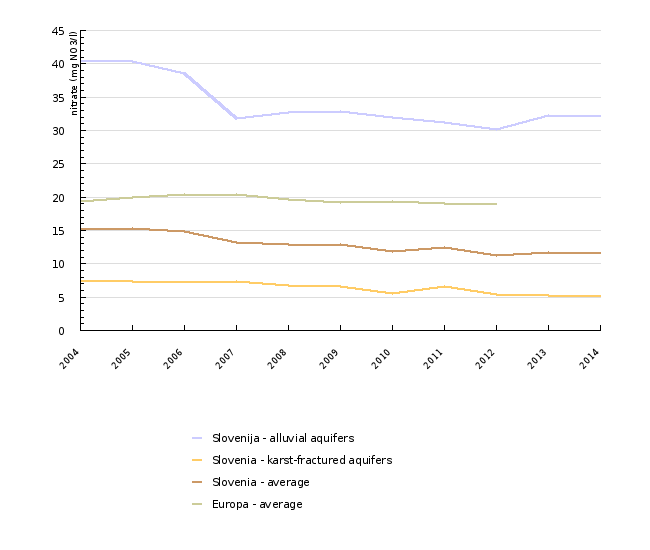
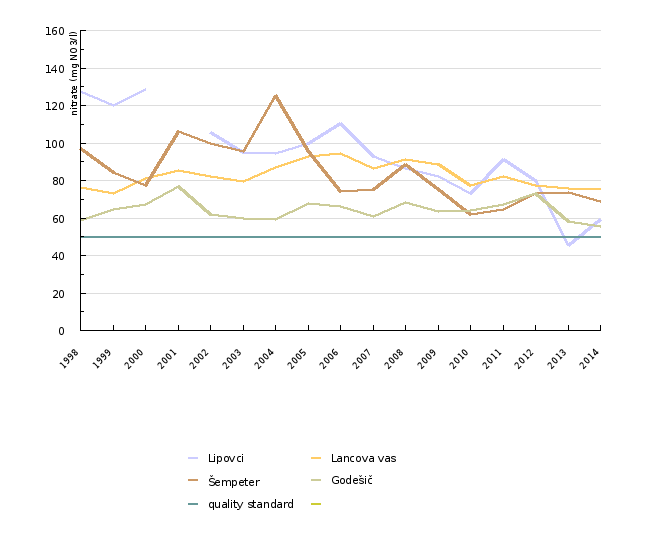
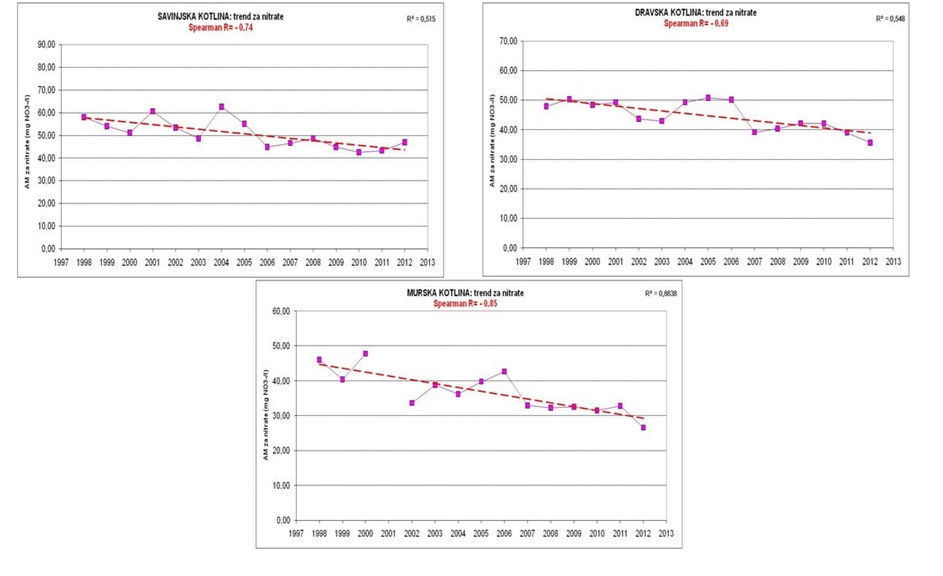
Slovenian groundwater bodies most polluted with nitrates are those with intergranular (alluvium) aquifers, particularly in northeastern Slovenia. Groundwater in karst and fractured aquifers is due to geographical conditions, low population density and scarce agricultural land less burdened with nitrates. On water bodies Mura basin and Savinja basin average annual levels of nitrate in the period from 1998 to 2014 show a statistically significant downward trend in nitrate levels. On the other water bodies declining nitrate levels are not statistically significant.
Definition
Charts
Standardised Database for Water Quality Monitoring, Slovenian Environmental Agency, 2015
Standardised Database for Water Quality Monitoring, Environmental Agency of the Republic of Slovenia, 2015; EEA Waterbase_groundwater_v14, 2015
| 2004 | 2005 | 2006 | 2007 | 2008 | 2009 | 2010 | 2011 | 2012 | 2013 | ||
|---|---|---|---|---|---|---|---|---|---|---|---|
| Slovenija - alluvial aquifers | mg/l | 40.6 | 40.3 | 38.6 | 31.8 | 32.8 | 32.9 | 31.9 | 31.2 | 30.2 | 32.3 |
| Slovenia - karst-fractured aquifers | mg/l | 7.5 | 7.4 | 7.4 | 7.3 | 6.8 | 6.6 | 5.5 | 6.6 | 5.4 | 5.3 |
| Slovenia - average | mg/l | 15.4 | 15.2 | 14.8 | 13.1 | 13 | 12.8 | 11.8 | 12.5 | 11.3 | 11.7 |
| Europa - average | mg/l | 19.3 | 19.9 | 20.4 | 20.4 | 19.7 | 19.2 | 19.3 | 19 | 19.1 | |
| 2014 | |||||||||||
| Slovenija - alluvial aquifers | mg/l | 32.2 | |||||||||
| Slovenia - karst-fractured aquifers | mg/l | 5.3 | |||||||||
| Slovenia - average | mg/l | 11.7 | |||||||||
| Europa - average | mg/l |
Standardised Database for Water Quality Monitoring, Slovenian Environmental Agency, 2015
| 1998 | 1999 | 2000 | 2001 | 2002 | 2003 | 2004 | 2005 | 2006 | 2007 | ||
|---|---|---|---|---|---|---|---|---|---|---|---|
| 1001 Savska kotlina in Ljubljansko barje | mg/l | 23.4 | 22.8 | 21.6 | 21.9 | 20.7 | 20.7 | 20.9 | 22.9 | 22.7 | 18.4 |
| 1002 Savinjska kotlina | mg/l | 50 | 43.8 | 47.2 | 55.5 | 43.9 | 50.5 | 65 | 57.8 | 45.4 | 47.3 |
| 1003 Krška kotlina | mg/l | 21.8 | 23.8 | 20.4 | 25.7 | 33 | 22.3 | 29.4 | 24.8 | 26.9 | 21.1 |
| 3012 Dravska kotlina | mg/l | 45.1 | 48.4 | 45.4 | 46.5 | 39.7 | 40.3 | 49.5 | 54 | 53.3 | 39.1 |
| 4016 Murska kotlina | mg/l | 47.6 | 39.8 | 47.3 | 34.4 | 39.9 | 38 | 42 | 44.7 | 32.9 | |
| quality standard | mg/l | 50 | 50 | 50 | 50 | 50 | 50 | 50 | 50 | 50 | 50 |
| 2008 | 2009 | 2010 | 2011 | 2012 | 2013 | 2014 | |||||
| 1001 Savska kotlina in Ljubljansko barje | mg/l | 19.6 | 20.6 | 19.2 | 19.2 | 18.2 | 18.9 | 18.8 | |||
| 1002 Savinjska kotlina | mg/l | 48.7 | 44.8 | 42.5 | 43.2 | 46.9 | 40.2 | 44 | |||
| 1003 Krška kotlina | mg/l | 23.2 | 24.2 | 24.1 | 21.6 | 23.7 | 28.7 | 24.5 | |||
| 3012 Dravska kotlina | mg/l | 40.3 | 42.1 | 42.2 | 39 | 35.6 | 42.3 | 40 | |||
| 4016 Murska kotlina | mg/l | 32.2 | 32.6 | 31.8 | 32.9 | 26.7 | 31.4 | 33.7 | |||
| quality standard | mg/l | 50 | 50 | 50 | 50 | 50 | 50 | 50 |
Standardised Database for Water Quality Monitoring, Slovenian Environmental Agency, 2015
| 1998 | 1999 | 2000 | 2001 | 2002 | 2003 | 2004 | 2005 | 2006 | 2007 | ||
|---|---|---|---|---|---|---|---|---|---|---|---|
| Lipovci | mg/l | 127.3 | 120.3 | 128.6 | 105.9 | 95.2 | 94.5 | 100 | 110.3 | 92.8 | |
| Lancova vas | mg/l | 76.2 | 73 | 81.1 | 85.3 | 82 | 79.7 | 87.1 | 93 | 94.5 | 86.5 |
| Šempeter | mg/l | 97 | 84.2 | 77.6 | 106.1 | 99.7 | 95.2 | 125.5 | 95.5 | 74 | 75.3 |
| Godešič | mg/l | 58.5 | 64.4 | 67.2 | 76.9 | 62 | 59.8 | 59.1 | 67.8 | 66.3 | 60.7 |
| quality standard | mg/l | 50 | 50 | 50 | 50 | 50 | 50 | 50 | 50 | 50 | 50 |
| 2008 | 2009 | 2010 | 2011 | 2012 | 2013 | 2014 | |||||
| Lipovci | mg/l | 86.5 | 82 | 73 | 91 | 80 | 45.5 | 59 | |||
| Lancova vas | mg/l | 91 | 88.5 | 77.5 | 82 | 77.5 | 75.5 | 75.5 | |||
| Šempeter | mg/l | 88.5 | 75 | 62 | 64.5 | 73 | 73.5 | 69 | |||
| Godešič | mg/l | 68.3 | 63.7 | 64.2 | 67.3 | 73.3 | 58 | 55.5 | |||
| quality standard | mg/l | 50 | 50 | 50 | 50 | 50 | 50 | 50 |
Standardised Database for Water Quality Monitoring, Environmental Agency of the Republic of Slovenia, 2015


