[ZR09] Emissions of substances that cause acidification and eutrophication

Key message

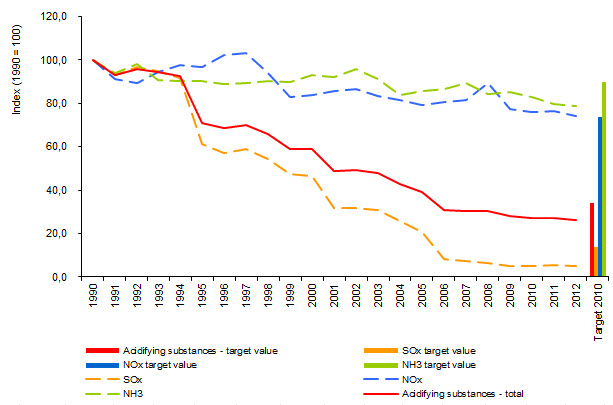
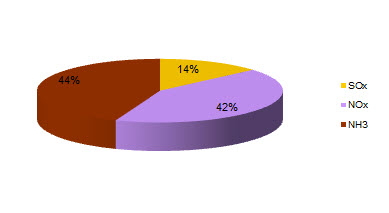
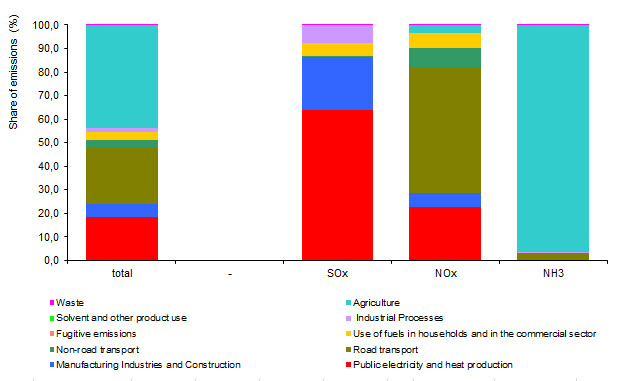
Total emissions of pollutants that contribute to acidification and eutrophication (SOx, NOx and NH3) have decreased by 74 % in Slovenia between 1990 and 2012. The most significant drop of emissions was observed for SOx. Emissions of SOx have decreased by 95 %, NOx by 26 % and NH3 by 21%. Emissions of SOx and NH3 were in the year 2012 below the national emissions ceiling, while emissions of NOx exceeded the specified target value. Comparison of emissions per capita in EU-28 for the year 2011 ranks Slovenia to the 15th place and is only slightly above the European Union average.
Definition
Charts
National database on air emissions, Slovenian Environment Agency, 2014
| SOx | NOx | NH3 | SOx | NOx | NH3 | acidifying substances - total | SOx | NOx | NH3 | acidifying substances - total | SOx target value | NOx target value | NH3 target value | acidifying substances - target value | |
|---|---|---|---|---|---|---|---|---|---|---|---|---|---|---|---|
| 1990 | 200.88 | 67.46 | 23.57 | 6.28 | 1.47 | 1.39 | 9.13 | 100 | 100 | 100 | 100 | 0 | 0 | 0 | 0 |
| 1991 | 186.19 | 61.56 | 22.21 | 5.82 | 1.34 | 1.31 | 8.46 | 92.69 | 91.25 | 94.27 | 92.70 | 0 | 0 | 0 | 0 |
| 1992 | 193.32 | 60.79 | 23.29 | 6.04 | 1.32 | 1.37 | 8.73 | 96.24 | 90.10 | 98.84 | 95.65 | 0 | 0 | 0 | 0 |
| 1993 | 190.21 | 62.63 | 21.63 | 5.94 | 1.36 | 1.27 | 8.58 | 94.69 | 92.84 | 91.79 | 93.95 | 0 | 0 | 0 | 0 |
| 1994 | 183.80 | 65.85 | 21.56 | 5.74 | 1.43 | 1.27 | 8.44 | 91.50 | 97.60 | 91.49 | 92.48 | 0 | 0 | 0 | 0 |
| 1995 | 123.77 | 64.86 | 21.73 | 3.87 | 1.41 | 1.28 | 6.56 | 61.62 | 96.14 | 92.21 | 71.81 | 0 | 0 | 0 | 0 |
| 1996 | 115.30 | 66.82 | 21.08 | 3.60 | 1.45 | 1.24 | 6.30 | 57.40 | 99.04 | 89.46 | 68.96 | 0 | 0 | 0 | 0 |
| 1997 | 118.85 | 66.21 | 21.42 | 3.71 | 1.44 | 1.26 | 6.41 | 59.17 | 98.14 | 90.89 | 70.24 | 0 | 0 | 0 | 0 |
| 1998 | 109.64 | 60.56 | 21.53 | 3.43 | 1.32 | 1.27 | 6.01 | 54.58 | 89.77 | 91.35 | 65.82 | 0 | 0 | 0 | 0 |
| 1999 | 95.79 | 54.12 | 21.31 | 2.99 | 1.18 | 1.25 | 5.42 | 47.69 | 80.22 | 90.45 | 59.41 | 0 | 0 | 0 | 0 |
| 2000 | 93.65 | 54.37 | 22.33 | 2.93 | 1.18 | 1.31 | 5.42 | 46.62 | 80.59 | 94.76 | 59.38 | 0 | 0 | 0 | 0 |
| 2001 | 63.91 | 54.87 | 22.13 | 2.00 | 1.19 | 1.30 | 4.49 | 31.82 | 81.33 | 93.92 | 49.20 | 0 | 0 | 0 | 0 |
| 2002 | 63.55 | 55.21 | 23.20 | 1.99 | 1.20 | 1.36 | 4.55 | 31.64 | 81.84 | 98.45 | 49.84 | 0 | 0 | 0 | 0 |
| 2003 | 61.94 | 53.20 | 21.94 | 1.94 | 1.16 | 1.29 | 4.38 | 30.84 | 78.86 | 93.09 | 48.00 | 0 | 0 | 0 | 0 |
| 2004 | 51.26 | 52.37 | 20.18 | 1.60 | 1.14 | 1.19 | 3.93 | 25.52 | 77.63 | 85.62 | 43.02 | 0 | 0 | 0 | 0 |
| 2005 | 41.02 | 51.67 | 20.75 | 1.28 | 1.12 | 1.22 | 3.63 | 20.42 | 76.59 | 88.04 | 39.71 | 0 | 0 | 0 | 0 |
| 2006 | 16.63 | 52.50 | 20.76 | 0.52 | 1.14 | 1.22 | 2.88 | 8.28 | 77.82 | 88.08 | 31.57 | 0 | 0 | 0 | 0 |
| 2007 | 14.85 | 52.14 | 21.29 | 0.46 | 1.13 | 1.25 | 2.85 | 7.39 | 77.28 | 90.33 | 31.21 | 0 | 0 | 0 | 0 |
| 2008 | 13.05 | 56.21 | 19.84 | 0.41 | 1.22 | 1.17 | 2.80 | 6.50 | 83.32 | 84.20 | 30.63 | 0 | 0 | 0 | 0 |
| 2009 | 10.82 | 48.87 | 21.07 | 0.34 | 1.06 | 1.24 | 2.64 | 5.39 | 72.43 | 89.41 | 28.91 | 0 | 0 | 0 | 0 |
| 2010 | 10.14 | 47.83 | 20.34 | 0.32 | 1.04 | 1.20 | 2.55 | 5.05 | 70.89 | 86.32 | 27.96 | 0 | 0 | 0 | 0 |
| 2011 | 11.89 | 47.61 | 19.46 | 0.37 | 1.04 | 1.14 | 2.55 | 5.92 | 70.57 | 82.57 | 27.94 | 0 | 0 | 0 | 0 |
| 2012 | 10.84 | 46.53 | 19.37 | 0.34 | 1.01 | 1.14 | 2.49 | 5.40 | 68.97 | 82.18 | 27.27 | 0 | 0 | 0 | 0 |
| 2013 | 11.59 | 43.94 | 19.09 | 0.36 | 0.96 | 1.12 | 2.44 | 5.77 | 65.13 | 81.00 | 26.73 | 0 | 0 | 0 | 0 |
| 2014 | 8.82 | 39.41 | 19.01 | 0.28 | 0.86 | 1.12 | 2.25 | 4.39 | 58.42 | 80.68 | 24.65 | 0 | 0 | 0 | 0 |
| 2015 | 5.46 | 35.16 | 19.24 | 0.17 | 0.76 | 1.13 | 2.07 | 2.72 | 52.11 | 81.66 | 22.64 | 0 | 0 | 0 | 0 |
| target 2010 | 27 | 45 | 20 | 0.84 | 0.98 | 1.18 | 3.00 | 0 | 0 | 0 | 0 | 13.44 | 66.55 | 83.97 | 32.77 |
National database on air emissions, Slovenian Environment Agency, 2014
| 2012 | ||
|---|---|---|
| SOx | kt acid equivalents | 0.3 |
| NOx | kt acid equivalents | 1 |
| NH3 | kt acid equivalents | 1 |
| acidifying substances - total | kt acid equivalents | 2.3 |
| SOx | % | 13.6 |
| NOx | % | 42.2 |
| NH3 | % | 44.2 |
National database on air emissions, Slovenian Environment Agency, 2014
| total | - | SOx | NOx | NH3 | ||
|---|---|---|---|---|---|---|
| Public electricity and heat production | kt acid equivalents | 0.43 | 0.2 | 0.23 | 0 | |
| Manufacturing Industries and Construction | kt acid equivalents | 0.13 | 0.07 | 0.06 | 0 | |
| Road transport | kt acid equivalents | 0.56 | 0 | 0.52 | 0.03 | |
| Non-road transport | kt acid equivalents | 0.08 | 0 | 0.08 | 0 | |
| Other | kt acid equivalents | 0.08 | 0.02 | 0.06 | 0 | |
| Fugitive emissions | kt acid equivalents | 0 | 0 | 0 | 0 | |
| Industrial Processes | kt acid equivalents | 0.03 | 0.02 | 0 | 0.01 | |
| Solvent and other product use | kt acid equivalents | 0 | 0 | 0 | 0 | |
| Agriculture | kt acid equivalents | 1.03 | 0 | 0.03 | 0.99 | |
| Waste | kt acid equivalents | 0 | 0 | 0 | 0 | |
| total | kt acid equivalents | 2.34 | 0.32 | 0.99 | 1.03 | |
| Public electricity and heat production | % | 18.34 | 63.97 | 22.81 | 0 | |
| Manufacturing Industries and Construction | % | 5.54 | 22.28 | 5.94 | 0 | |
| Road transport | % | 23.77 | 0.35 | 53.15 | 2.91 | |
| Non-road transport | % | 3.49 | 0.23 | 8.19 | 0 | |
| Use of fuels in households and in the commercial sector | % | 3.54 | 5.6 | 6.57 | 0 | |
| Fugitive emissions | % | 0 | 0 | 0 | 0 | |
| Industrial Processes | % | 1.37 | 7.47 | 0.03 | 0.76 | |
| Solvent and other product use | % | 0 | 0 | 0 | 0 | |
| Agriculture | % | 43.9 | 0 | 3.29 | 96.28 | |
| Waste | % | 0.04 | 0.09 | 0.02 | 0.04 |
Air pollutant emissions data viewer (LRTAP Convention), European Environment Agency, 2014, Eurostat, 2014
| Bulgaria | Estonia | Luxembourg | Ireland | Greece | Poland | Cyprus | Finland | Denmark | Czech Republic | ||
|---|---|---|---|---|---|---|---|---|---|---|---|
| NOx | kt acid equivalents | 2.95 | 0.78 | 1.04 | 1.53 | 6.42 | 18.5 | 0.45 | 3.33 | 2.73 | 4.91 |
| SOx | kt acid equivalents | 16.08 | 2.27 | 0.06 | 0.73 | 8.19 | 28.44 | 0.66 | 1.91 | 0.43 | 5.28 |
| NH3 | kt acid equivalents | 2.81 | 0.61 | 0.27 | 6.39 | 3.62 | 15.91 | 0.3 | 2.18 | 4.36 | 3.86 |
| emissions of acidifying substances | kt acid equivalents | 21.83 | 3.66 | 1.37 | 8.66 | 18.23 | 62.84 | 1.41 | 7.42 | 7.53 | 14.06 |
| country population | number | 7284552 | 1320174 | 537039 | 4591087 | 11062508 | 38533299 | 865878 | 5426674 | 5602628 | 10516125 |
| emissions per capita | kg/capita | 3 | 2.77 | 2.55 | 1.89 | 1.65 | 1.63 | 1.63 | 1.37 | 1.34 | 1.34 |
| Lithuania | Spain | Romania | Malta | Slovenia | Croatia | EU-28 | France | Slovakia | Austria | ||
| NOx | kt acid equivalents | 1.1 | 22.03 | 4.82 | 0.17 | 1.01 | 1.44 | 192.33 | 21.86 | 1.85 | 3.97 |
| SOx | kt acid equivalents | 1.11 | 16.84 | 10.35 | 0.25 | 0.34 | 1.21 | 143.01 | 7.96 | 2.14 | 0.58 |
| NH3 | kt acid equivalents | 1.72 | 22.54 | 9.36 | 0.09 | 1.05 | 2.17 | 215.95 | 39.64 | 1.42 | 3.67 |
| emissions of acidifying substances | kt acid equivalents | 3.93 | 61.41 | 24.53 | 0.51 | 2.4 | 4.82 | 551.29 | 69.46 | 5.41 | 8.22 |
| country population | number | 2971905 | 46727890 | 20020074 | 421367 | 2058821 | 4262140 | 505665739 | 65578819 | 5410836 | 8451860 |
| emissions per capita | kg/capita | 1.32 | 1.31 | 1.23 | 1.21 | 1.17 | 1.13 | 1.09 | 1.06 | 1 | 0.97 |
| Germany | Belgium | Italy | Netherlands | United Kingdom | Hungary | Latvia | Portugal | Sweden | |||
| NOx | kt acid equivalents | 28.11 | 4.57 | 20.21 | 5.64 | 22.46 | 2.81 | 0.7 | 3.82 | 3.16 | |
| SOx | kt acid equivalents | 13.9 | 1.74 | 6.1 | 1.05 | 11.84 | 1.09 | 0.1 | 1.46 | 0.92 | |
| NH3 | kt acid equivalents | 33.14 | 3.97 | 22.49 | 6.98 | 17.07 | 3.81 | 0.76 | 2.75 | 3.04 | |
| emissions of acidifying substances | kt acid equivalents | 75.14 | 10.27 | 48.8 | 13.67 | 51.36 | 7.71 | 1.56 | 8.02 | 7.13 | |
| country population | number | 80523746 | 11161642 | 59685227 | 16779575 | 63896071 | 9908798 | 2023825 | 10487289 | 9555893 | |
| emissions per capita | kg/capita | 0.93 | 0.92 | 0.82 | 0.81 | 0.8 | 0.78 | 0.77 | 0.76 | 0.75 |


![Figure ZR09-4: Emissions of substances that cause acidification and eutrophication per capita, EU-27 [kg/capita], 2011](/sites/default/files/charts/migrated_charts/graph_12470_en.jpg)