[MR02] Sea level

Key message

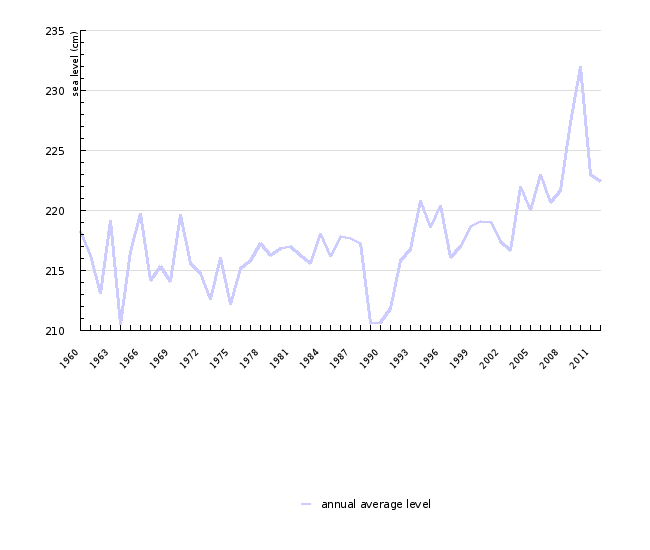
In the period 1960–2012 the average sea level on the Slovenian coast rose by 1 mm/year, in the last decade the rate of sea level rise has accelerated.
Definition
Charts
Slovenian Environment Agency, 2012
| 1960 | 1961 | 1962 | 1963 | 1964 | 1965 | 1966 | 1967 | 1968 | 1969 | ||
|---|---|---|---|---|---|---|---|---|---|---|---|
| annual average level | cm | 218 | 216 | 213 | 219 | 211 | 217 | 220 | 214 | 215 | 214 |
| 1970 | 1971 | 1972 | 1973 | 1974 | 1975 | 1976 | 1977 | 1978 | 1979 | ||
| annual average level | cm | 220 | 216 | 215 | 213 | 216 | 212 | 215 | 216 | 217 | 216 |
| 1980 | 1981 | 1982 | 1983 | 1984 | 1985 | 1986 | 1987 | 1988 | 1989 | ||
| annual average level | cm | 217 | 217 | 216 | 216 | 218 | 216 | 218 | 218 | 217 | 211 |
| 1990 | 1991 | 1992 | 1993 | 1994 | 1995 | 1996 | 1997 | 1998 | 1999 | ||
| annual average level | cm | 211 | 212 | 216 | 217 | 221 | 219 | 220 | 216 | 217 | 219 |
| 2000 | 2001 | 2002 | 2003 | 2004 | 2005 | 2006 | 2007 | 2008 | 2009 | ||
| annual average level | cm | 219 | 219 | 217 | 217 | 222 | 220 | 223 | 221 | 222 | 227 |
| 2010 | 2011 | 2012 | |||||||||
| annual average level | cm | 232 | 223 | 222 |
Dolgoletni niz višin morja ARSO, Agencija Republike Slovenije za okolje, 2009
| 1963 | 1964 | 1965 | 1966 | 1967 | 1968 | 1969 | 1970 | 1971 | 1972 | ||
|---|---|---|---|---|---|---|---|---|---|---|---|
| maximal sea level | cm | 314 | 313 | 323 | 352 | 327 | 330 | 394 | 325 | 310 | 320 |
| 1973 | 1974 | 1975 | 1976 | 1977 | 1978 | 1979 | 1980 | 1981 | 1982 | ||
| maximal sea level | cm | 314 | 308 | 331 | 325 | 320 | 318 | 356 | 361 | 330 | 361 |
| 1983 | 1984 | 1985 | 1986 | 1987 | 1988 | 1989 | 1990 | 1991 | 1992 | ||
| maximal sea level | cm | 316 | 326 | 326 | 345 | 309 | 305 | 320 | 311 | 333 | 327 |
| 1993 | 1994 | 1995 | 1996 | 1997 | 1998 | 1999 | 2000 | 2001 | 2002 | ||
| maximal sea level | cm | 340 | 310 | 334 | 329 | 330 | 320 | 319 | 321 | 311 | 325 |
| 2003 | 2004 | 2005 | 2006 | 2007 | 2008 | 2009 | 2010 | 2011 | |||
| maximal sea level | cm | 305 | 342 | 322 | 316 | 326 | 372 | 338 | 342 | 321 |
Slovenian Environment Agency, 2012
| 1961 | 1962 | 1963 | 1964 | 1965 | 1966 | 1967 | 1968 | 1969 | 1970 | ||
|---|---|---|---|---|---|---|---|---|---|---|---|
| number of days per year when the high water exceeded 3m | number of days per year | 3 | 7 | 11 | 5 | 10 | 9 | 6 | 8 | 7 | 6 |
| 1971 | 1972 | 1973 | 1974 | 1975 | 1976 | 1977 | 1978 | 1979 | 1980 | ||
| number of days per year when the high water exceeded 3m | number of days per year | 4 | 2 | 2 | 3 | 3 | 4 | 1 | 5 | 15 | 5 |
| 1981 | 1982 | 1983 | 1984 | 1985 | 1986 | 1987 | 1988 | 1989 | 1990 | ||
| number of days per year when the high water exceeded 3m | number of days per year | 11 | 7 | 8 | 10 | 3 | 4 | 6 | 1 | 2 | 7 |
| 1991 | 1992 | 1993 | 1994 | 1995 | 1996 | 1997 | 1998 | 1999 | 2000 | ||
| number of days per year when the high water exceeded 3m | number of days per year | 3 | 16 | 9 | 5 | 7 | 16 | 16 | 7 | 10 | 12 |
| 2001 | 2002 | 2003 | 2004 | 2005 | 2006 | 2007 | 2008 | 2009 | 2010 | ||
| number of days per year when the high water exceeded 3m | number of days per year | 8 | 10 | 3 | 16 | 3 | 6 | 4 | 14 | 25 | 31 |
| 2011 | |||||||||||
| number of days per year when the high water exceeded 3m | number of days per year | 2 |
Comment
{0>V Koprskem zalivu spremljamo spremenljivost višin morja od leta 1960 dalje.<}0{>In the Gulf of Koper the sea level changes have been monitored
since 1960. <0} {0>Merilno mesto je primarno namenjeno spremljanju in napovedovanju poplavnih višin morja, daljši časovni nizi in analiza vplivnih
parametrov pa dajejo vpogled tudi v vpliv podnebnih sprememb.<}0{>The tide gauge is primarily intended for monitoring and forecasting flood levels of
the sea, while longer time series of data and analyses of influential parameters provide an insight into the effects of climate change.<0}
{0>Srednja letna višina morja se je v opazovanem obdobju gibala med 211 in 232 cm.<}54{>In the observation period, the annual mean sea level
ranged from 211 to 232 cm.<0} {0>Največje odstopanje od srednje vrednosti za dolgoletno obdobje 1960 - 2012, ki znaša 217 cm, je bilo 15 cm leta
2010.<}0{>The greatest deviation from the mean sea level value of 217 cm in the multi-annual period 1960–2012 was recorded in 2010, when it amounted
to 15 cm.<0}
{0>Višina morja na slovenski obali se zvišuje, kar je še posebej opazno v zadnjem desetletju.<}0{>The sea level on the Slovenian coast is rising,
which has been most evident in the last decade.<0} {0>V celoti je zviševanje višine morja še vedno enakega velikostnega reda kakor v Sredozemlju, 1
mm/leto.<}0{>The overall sea level rise is comparable in size to the rise in the sea level of the Mediterranean Sea. <0} {0>Po ocenah UNEP
(2001) naj bi se gladina morja v Sredozemskem morju zvišala od 12 do 30 cm do leta 2100. Pri globalni oceni zviševanja gladine morij se večji delež
zviševanja pripisuje raztezanju morij zaradi povišane temperature morja.<}0{>According to UNEP’s assessments (for 2001) the sea level of the
Mediterranean Sea should rise from 12 to 30 cm by 2100. In the global assessment of sea level rise, the major share of the rise is attributable to sea
water expansion caused by higher temperatures of the sea. <0}
{0>Zaradi značilne dinamike Jadranskega morja in lege merilne postaje Koper v njegovem severnem delu, spremljamo zviševanje višin morja ob slovenski
obali predvsem kot posledico pogostosti vremenskih sprememb.<}0{>Due to the dynamical characteristics of the Adriatic Sea and the location of the
Koper mareographic station in its northern part, the rise in sea level along the Slovenian coast is mostly observed as the consequence of climate changes
such as frequency and intensity of surface cyclones.<0}
{0>Nadpovprečno visoke plime povzročajo predvsem padanje zračnega pritiska, močni južni vetrovi in pojav resonance dolgoperiodičnega 23-urnega valovanja
(seischi), svoje pa doprinese tudi relativna zaprtost Jadranskega morja.<}0{>Above-average tides are caused in particular by the falling of
atmospheric pressure, strong southern winds and the occurrence of seishes (long-period 23-hour waving oscillations), which are attributable to a relative
closeness of the Adriatic Sea.<0}
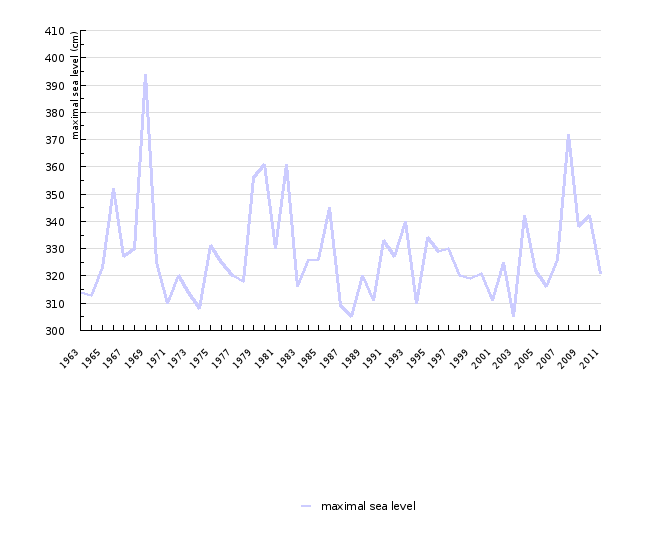
{0>V opazovanem obdobju je višina morja več kot 398-krat dosegla ali presegla točko poplavljanja (300 cm), povprečno za okoli 9 cm.<}44{>In the
observation period, the sea level reached or exceeded the flood point (300 cm) 398 times, i.e. on average by approximately 9 cm. <0} {0>Najvišja
izmerjena višina morja je bila 394 cm.<}75{>The highest sea level measured was 394 cm.<0} {0>Do poplav morja prihaja večinoma v jesenskozimskem
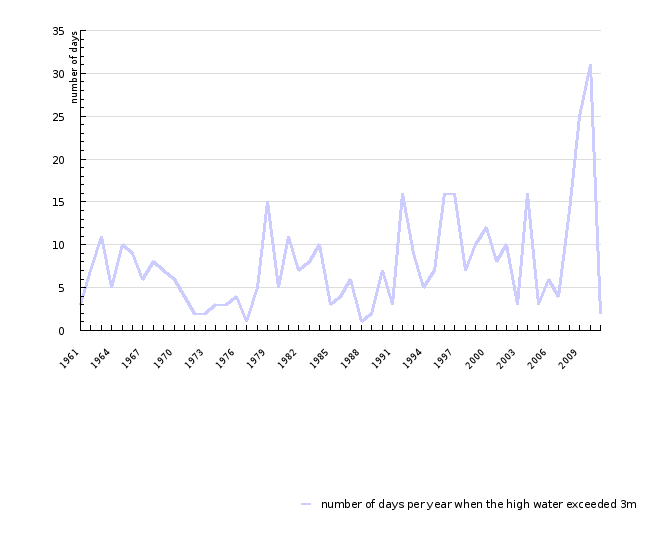
času, občasno tudi v spomladanskih mesecih, povprečno nekaj več kot osemkrat letno in največ 31-krat v letu.<}0{>Sea floods mainly occur in autumn,
temporarily also during spring months, and on average slightly more than eight times a year and up to 31 times a year.<0} {0>Poplave so posledica
nadpovprečno visokih plim, ki jih povzročijo zlasti vremenski pogoji.<}0{>Floods result from above-average tides which are mainly caused by weather conditions
[
<0}
{0>Zvišanje gladine morja zaradi podnebnih sprememb zahteva raznovrstno prilagajanje.<}40{>The sea level rise resulting from climate change
requires numerous adaptations.<0} {0>Urbana slovenska obala je delno prilagojena na sedanje poplavne razmere in napovedi zviševanja višin
morja.<}0{>The urban Slovenian coast is partly adjusted to the current flood situation and the predicted sea level rises.


