[PR09] Transport emissions of greenhouse gases

Key message

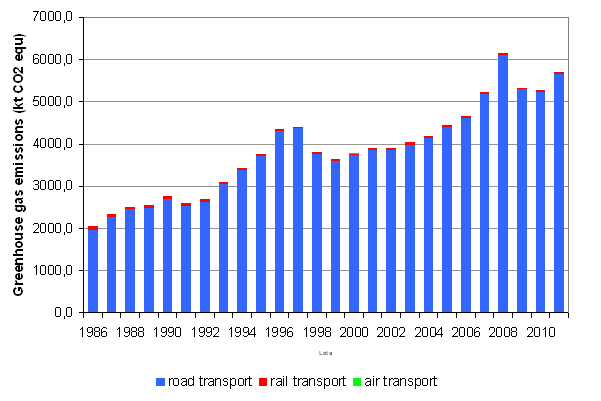
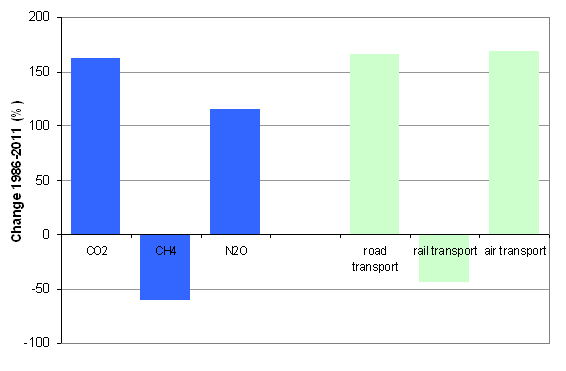
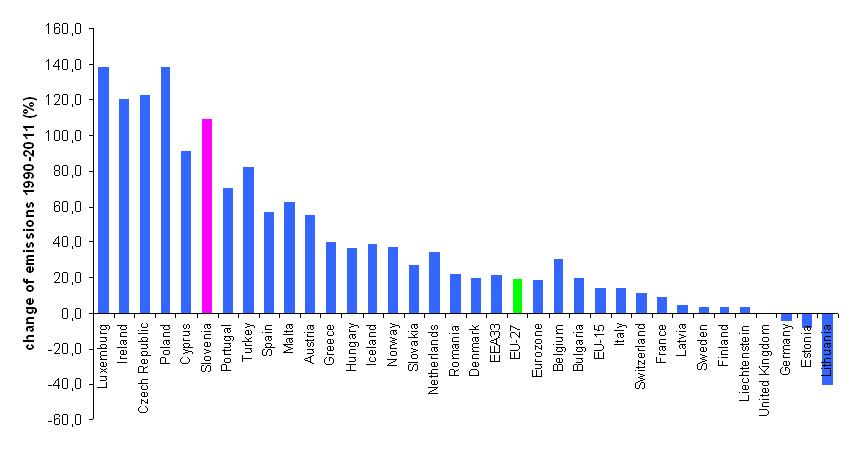
Greenhouse gas emissions from transport in Slovenia in 2011 increased by 181% compared to 1986. in EU GHG emissions from transport far beyond the growth. In the area of old EU member states in the period 1990-2010 increased by 16% across the EU by 20% (in Slovenia at the time for 92%). Source vast majority of GHG emissions from transport, road transport, which contributes 99.2%. The share held by emissions from transport in total emissions (29% in 2011) and not enough effective measures to reduce them difficult Slovenia's efforts to achieve the commitments of the Kyoto Protocol. As shown, the impact of the recession will contribute to this objective Slovenia nevertheless achieved.
Definition
The indicator shows the greenhouse gas (GHG) emissions from transport in the past. The total emissions are subdivided into road, air, rail and maritime transport. Emissions from international bunkers are not included.
The Kyoto Protocol considers six pollutants from the GHG group; namely carbon dioxide (CO2), methane (CH4), dinitrous oxide (N2O), hydrofluorocarbons (HFC), perfluorocarbons (PFC) and sulphur hexafluoride (SF6). Due to comparability, the GHG amounts are calculated to a CO2 equivalent that considers the differences between the global warming potential of individual gases.
Charts
Archive Greenhouse Gas Emissions, Environmental Agency of the Republic of Slovenia, march 2013.
| 1986 | 1987 | 1988 | 1989 | 1990 | 1991 | 1992 | 1993 | 1994 | 1995 | ||
|---|---|---|---|---|---|---|---|---|---|---|---|
| road transport | 1000 t CO2 equivalents | 1962.3 | 2255.6 | 2438 | 2469 | 2675.3 | 2515.1 | 2623.6 | 3049.2 | 3369.8 | 3706.2 |
| rail transport | 1000 t CO2 equivalents | 76.9 | 76.3 | 73.7 | 74.9 | 72.7 | 81.2 | 54.6 | 46.2 | 46.7 | 48.8 |
| air transport | 1000 t CO2 equivalents | 0.6 | 0.4 | 0.6 | 0.9 | 1.1 | 0.6 | 1 | 1.8 | 2.1 | 2 |
| total | 1000 t CO2 equivalents | 2039.8 | 2332.3 | 2512.3 | 2544.7 | 2749.1 | 2596.9 | 2679.1 | 3097.1 | 3418.6 | 3757 |
| 1996 | 1997 | 1998 | 1999 | 2000 | 2001 | 2002 | 2003 | 2004 | 2005 | ||
| road transport | 1000 t CO2 equivalents | 4302.3 | 4365.5 | 3760.4 | 3573.1 | 3717.5 | 3846.9 | 3849.8 | 3986.6 | 4126.9 | 4397.6 |
| rail transport | 1000 t CO2 equivalents | 45.3 | 43.9 | 42.9 | 41.9 | 42.6 | 41.6 | 43.8 | 41.1 | 41.7 | 42.4 |
| air transport | 1000 t CO2 equivalents | 2.3 | 2.4 | 3 | 2.9 | 2.9 | 2.4 | 2.4 | 2.4 | 1.9 | 1.7 |
| total | 1000 t CO2 equivalents | 4349.9 | 4411.9 | 3806.3 | 3617.9 | 3763 | 3890.9 | 3896 | 4030.2 | 4170.5 | 4441.7 |
| 2006 | 2007 | 2008 | 2009 | 2010 | |||||||
| road transport | 1000 t CO2 equivalents | 4608.4 | 5183.1 | 6105.1 | 5293.1 | 5227.6 | |||||
| rail transport | 1000 t CO2 equivalents | 42.3 | 42.3 | 45.8 | 42.3 | 42.3 | |||||
| air transport | 1000 t CO2 equivalents | 1.5 | 1.7 | 1.5 | 1.6 | 1.7 | |||||
| total | 1000 t CO2 equivalents | 4652.2 | 5227.1 | 6152.3 | 5337 | 5271.6 |
Archive Greenhouse Gas Emissions, Environmental Agency of the Republic of Slovenia, March 2013.
| CO2 | CH4 | N2O |
|---|
Annual European Union greenhouse gas inventory 1990 – 2011 and inventory report 2013 – data viewer.
| Luxemburg | Ireland | Czech Republic | Poland | Cyprus | Slovenia | Portugal | Turkey | Spain | Malta | ||
|---|---|---|---|---|---|---|---|---|---|---|---|
| change 1990-2010 | % | 1 | 1 | 1 | 1 | 1 | 1 | 1 | 1 | 1 | 1 |
| Austria | Greece | Hungary | Iceland | Norway | Slovakia | Netherlands | Romania | Denmark | EEA32 | ||
| change 1990-2010 | % | 1 | 1 | 0 | 0 | 0 | 0 | 0 | 0 | 0 | 0 |
| EU-27 | Eurozone | Belgium | Bulgaria | EU-15 | Italy | Switzerland | France | Latvia | Sweden | ||
| change 1990-2010 | % | 0 | 0 | 0 | 0 | 0 | 0 | 0 | 0 | 0 | 0 |
| Finland | Liechtenstein | United Kingdom | Germany | Estonia | Lithuania | ||||||
| change 1990-2010 | % | 0 | 0 | 0 | -0 | -0 | -0 |
Goals
- Slovenia does not have a direct objective for transport GHG emissions; indirectly it is stipulated within the framework of the Kyoto Protocol, under which Slovenia must in the period 2008-2012 achieve 8 % lower emissions in comparison with base emissions.
- The Operational Programme for Limiting Greenhouse Gas Emissions until 2012, adopted in 2009, stipulates in the period 2008-2012 transport GHG emissions in the amount of 6.165 kt CO2 eq.
- In the proposal of the climate-energy package, the European Commission indicated that Slovenia must reduce GHG emissions by 2020 by approximately 6 % with regard to emissions in 2005 by:
• reducing emissions from sectors that are included in the European Emission Trading Scheme by 21 %,
• allowing a maximum 4 % increase of emissions from sectors that are not included in the European Emission Trading Scheme with regard to emissions from these sectors in 2005.


