[PR16] Road transport fuel prices

Key message

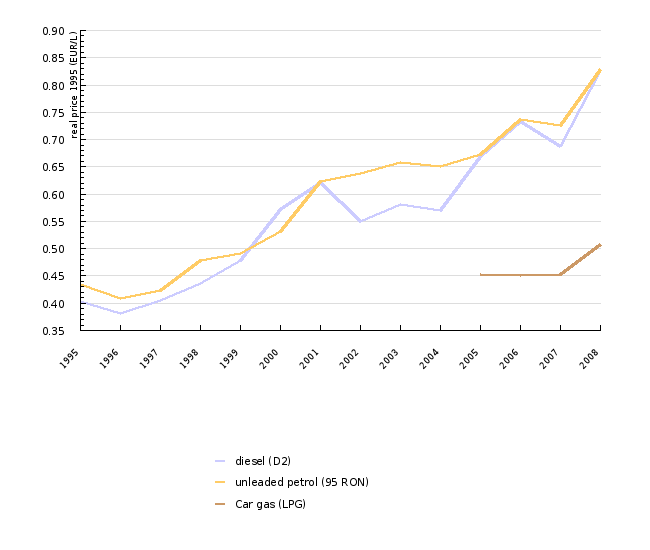
Prices of motor fuels have been increasing. In the period 2000–2008, the real prices of gasoline, diesel and autogas increased. Fiscal policy also contributed a lot to higher prices. Due to lower prices and a smaller impact on the environment, autogas presents one of the most widespread alternatives to classic oil fuels.
Definition
The indicator shows the final prices of fuels in the past, changes in final prices in different periods and comparison of fuel prices in Slovenia with prices in other European countries.
The final price reflects the basic price of fuel, including all taxes and fees. Due to better comparability, prices are conversed into the real prices of 1995, which means that the influence of inflation was removed from these prices.
The indicator considers premium unleaded gasoline (NMB 95), diesel fuel (D2) and autogas. Autogas is liquefied petroleum gas (LPG), a mix of butane and propane, adjusted for use in vehicles. On the market it is usually referred to as LPG (Liquified Petroleum Gas). Prices for liquid fuels are expressed in EUR per litre of fuel (EUR/L).
Charts
Statistical Office of the Republic of Slovenia, 2009.
| 1995 | 1996 | 1997 | 1998 | 1999 | 2000 | 2001 | 2002 | 2003 | 2004 | ||
|---|---|---|---|---|---|---|---|---|---|---|---|
| diesel (D2) | EUR/L (1995) | 0.404 | 0.381 | 0.405 | 0.436 | 0.478 | 0.571 | 0.621 | 0.55 | 0.581 | 0.57 |
| - excluding taxes | EUR/L (1995) | 0.195 | 0.173 | 0.2 | 0.198 | 0.145 | 0.228 | 0.277 | 0.218 | 0.265 | 0.218 |
| - excluding VAT | EUR/L (1995) | 0.195 | 0.173 | 0.215 | 0.211 | 0.182 | 0.48 | 0.522 | 0.458 | 0.484 | 0.475 |
| unleaded petrol (95 RON) | EUR/L (1995) | 0.434 | 0.409 | 0.424 | 0.478 | 0.492 | 0.531 | 0.624 | 0.638 | 0.658 | 0.65 |
| - excluding taxes | EUR/L (1995) | 0.219 | 0.191 | 0.215 | 0.218 | 0.148 | 0.2 | 0.237 | 0.19 | 0.233 | 0.216 |
| - excluding VAT | EUR/L (1995) | 0.219 | 0.191 | 0.227 | 0.229 | 0.179 | 0.446 | 0.524 | 0.531 | 0.548 | 0.542 |
| Car gas (LPG) | EUR/L (1995) | ||||||||||
| 2005 | 2006 | 2007 | 2008 | ||||||||
| diesel (D2) | EUR/L (1995) | 0.669 | 0.734 | 0.688 | 0.826 | ||||||
| - excluding taxes | EUR/L (1995) | 0.278 | 0.369 | 0.324 | 0.452 | ||||||
| - excluding VAT | EUR/L (1995) | 0.557 | 0.612 | 0.573 | 0.688 | ||||||
| unleaded petrol (95 RON) | EUR/L (1995) | 0.672 | 0.737 | 0.725 | 0.829 | ||||||
| - excluding taxes | EUR/L (1995) | 0.227 | 0.326 | 0.295 | 0.41 | ||||||
| - excluding VAT | EUR/L (1995) | 0.56 | 0.614 | 0.604 | 0.691 | ||||||
| Car gas (LPG) | EUR/L (1995) | 0.453 | 0.45 | 0.452 | 0.508 |
Statistical Office of the Republic of Slovenia, 2009, Petrol, 2009, Oil bulletin.
| diesel (D2) | petrol (95 RON) | car gas (LPG) | ||
|---|---|---|---|---|
| 1995-2008 | % | 104.7 | 91.2 | |
| 1995-2000 | % | 41.5 | 22.5 | |
| 2000-2008 | % | 42.2 | 53.4 | |
| 2005-2008 | % | 21.5 | 21.3 | 12 |
| 2007-2008 | % | 18.3 | 12.7 |
Statistical Office of the Republic of Slovenia, 2009, Petrol, 2009.
| diesel (D2) - retail price | diesel (D2) - price before taxes | diesel (D2) - taxes (including VAT) | unleaded petrol (95 RON) - retail price | unleaded petrol (95 RON) - price before taxes | unleaded petrol (95 RON) - taxes (including VAT) | ||
|---|---|---|---|---|---|---|---|
| 1995-2008 | % | 5.7 | 6.7 | 4.6 | 5.1 | 4.9 | 5.3 |
| 1995-2000 | % | 7.6 | 3.6 | 10.8 | 4.5 | -1.5 | 9.4 |
| 2000-2009 | % | 4.5 | 8.7 | 0.9 | 5.5 | 9.2 | 2.8 |
Eurostat, 2009, Oil Bulletin.
| EU-15 | Belgium | Czech Republic | Denmark | Germany | Estonia | Ireland | Greece | Spain | France | ||
|---|---|---|---|---|---|---|---|---|---|---|---|
| retail price - unleaded petrol (95 RON) | EUR/1000 L | 1295.1 | 1414.6 | 1196.2 | 1335.5 | 1349.5 | 1011.6 | 1195 | 1100 | 1098.3 | 1338.4 |
| retail price - diesel (D2) | EUR/1000 L | 1181.3 | 1095.3 | 1212.1 | 1174.4 | 1236.5 | 1111.4 | 1199 | 1116 | 1052.5 | 1187.3 |
| retail price - unleaded petrol (95 RON) | index (EU-15 = 100) | 100 | 109.2 | 92.4 | 103.1 | 104.2 | 78.1 | 92.3 | 84.9 | 84.8 | 103.3 |
| retail price - diesel (D2) | index (EU-15 = 100) | 100 | 92.7 | 102.6 | 99.4 | 104.7 | 94.1 | 101.5 | 94.5 | 89.1 | 100.5 |
| Italy | Cyprus | Latvia | Lithuania | Luxembourg | Hungary | Malta | the Netherlands | Austria | Poland | ||
| retail price - unleaded petrol (95 RON) | EUR/1000 L | 1356 | 1024.3 | 1029.8 | 1019.7 | 1154 | 1145.9 | 1090.2 | 1494 | 1183 | 1182 |
| retail price - diesel (D2) | EUR/1000 L | 1260.5 | 1006.9 | 1039.8 | 1039.3 | 1016 | 1164.7 | 1020.3 | 1173 | 1156 | 1122.1 |
| retail price - unleaded petrol (95 RON) | index (EU-15 = 100) | 104.7 | 79.1 | 79.5 | 78.7 | 89.1 | 88.5 | 84.2 | 115.4 | 91.3 | 91.3 |
| retail price - diesel (D2) | index (EU-15 = 100) | 106.7 | 85.2 | 88 | 88 | 86 | 98.6 | 86.4 | 99.3 | 97.9 | 95 |
| Portugal | Slovenia | Slovakia | Finland | Sweden | United Kingdom | - | EU-15 2007 | Slovenia 2007 | EU-15 2006 | ||
| retail price - unleaded petrol (95 RON) | EUR/1000 L | 1393 | 1059 | 1159.7 | 1354.6 | 1266 | 1394.8 | 1188.8 | 974 | 1198.8 | |
| retail price - diesel (D2) | EUR/1000 L | 1197.3 | 1055 | 1215.9 | 1161.4 | 1234.2 | 1459.9 | 1038.1 | 924 | 1062.5 | |
| retail price - unleaded petrol (95 RON) | index (EU-15 = 100) | 107.6 | 81.8 | 89.5 | 104.6 | 97.8 | 107.7 | 100 | 81.9 | 100 | |
| retail price - diesel (D2) | index (EU-15 = 100) | 101.4 | 89.3 | 102.9 | 98.3 | 104.5 | 123.6 | 100 | 89 | 100 | |
| Slovenia 2006 | EU-15 2005 | Slovenia 2005 | EU-15 2004 | Slovenia 2004 | EU-15 2003 | Slovenia 2003 | EU-15 2002 | Slovenia 2002 | EU-15 2001 | ||
| retail price - unleaded petrol (95 RON) | EUR/1000 L | 949.8 | 1206.3 | 918.6 | 1082.8 | 855.8 | 996 | 798.4 | 998.1 | 791.3 | 974.2 |
| retail price - diesel (D2) | EUR/1000 L | 921.4 | 1065.9 | 924.1 | 959.8 | 837.4 | 787.1 | 705.6 | 783.7 | 694.4 | 792.8 |
| retail price - unleaded petrol (95 RON) | index (EU-15 = 100) | 79.2 | 100 | 76.2 | 100 | 79 | 100 | 80.2 | 100 | 79.3 | 100 |
| retail price - diesel (D2) | index (EU-15 = 100) | 86.7 | 100 | 86.7 | 100 | 87.3 | 100 | 89.6 | 100 | 88.6 | 100 |
| Slovenia 2001 | |||||||||||
| retail price - unleaded petrol (95 RON) | EUR/1000 L | 756 | |||||||||
| retail price - diesel (D2) | EUR/1000 L | 672.7 | |||||||||
| retail price - unleaded petrol (95 RON) | index (EU-15 = 100) | 77.6 | |||||||||
| retail price - diesel (D2) | index (EU-15 = 100) | 84.8 |
Eurostat, 2009, Oil Bulletin.
| EU-15 | Belgium | Cyprus | Czech Republic | Denmark | Spain | France | Hungary | Italy | Lithuania | ||
|---|---|---|---|---|---|---|---|---|---|---|---|
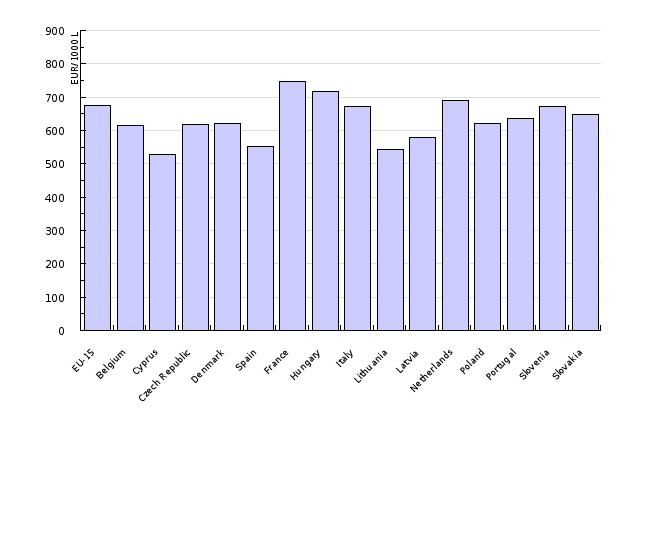
| retail price for LPG | EUR/1000 L | 675 | 615 | 528.6 | 616.9 | 621.8 | 552.1 | 747.2 | 716.5 | 672.3 | 543.4 |
| Latvia | Netherlands | Poland | Portugal | Slovenia | Slovakia | ||||||
| retail price for LPG | EUR/1000 L | 578.5 | 689 | 621.4 | 635 | 672.9 | 646.5 |
Goals
Slovenian energy policy, defined in the Resolution on the National Energy Programme, does not set any specific objectives with regard to energy prices; however, it stipulates mechanisms in the area of the competitiveness of energy supply, the implementation of which will have an effect on higher competitiveness and energy prices.
Comment
The absolute level of prices of motor fuels and their trends of development have a strong influence on the total consumption of fuels and demand for various fuels. The increase of prices of motor fuels should encourage a reduction in the use of such fuels for the final consumers, which would also reduce the impact on the environment. Relative changes of prices of energy products, which are mutual substitutes, influence the change in fuels.
In general, the prices of energy products have realistically increased with regard to 1995. The main reason is high oil prices on international markets.
In Slovenia, oil derivatives are the most expensive energy product, primarily due to a relatively high share of taxes in their final price. Slovenia is also one of the few EU countries which entirely regulates the price of oil derivatives. The state prescribed a methodology for the basic pricing of fuels, while also influencing the final price by the level of excise duty. The basic purpose of the introduction of the regulation of oil derivatives prices was the protection of consumers against oligopolistic pricing by oil dealers and the possibility of implementing protective measures against the influence of global oil prices on inflation in Slovenia.
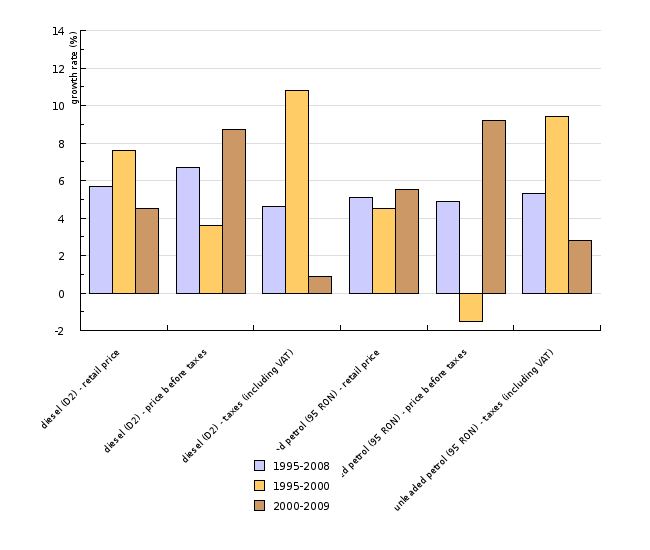
Since 1995, the prices of oil derivatives have realistically increased with an average annual growth level above 4.5 %; however, the main reason for the increase in prices before and after the year 2000 is not the same. In the first period, the growth of prices was primarily a result of the higher taxation of oil derivatives (the introduction of excise duty and VAT), while the main reason for the growth of retail prices of oil derivatives in recent years was primarily the growth of the basic price of fuels due to high oil prices on world markets.
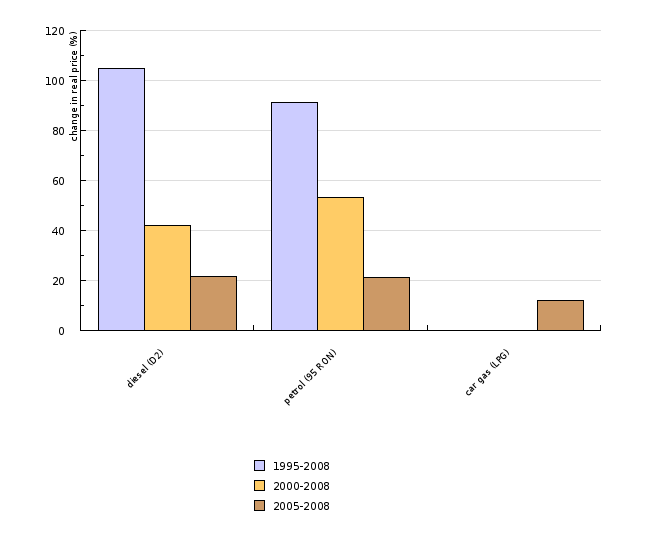
The increasing trends of prices in the period 1995-2000 for gasoline and diesel are quite similar. In 2002, a lower price for diesel fuel can be noticed, which is primarily a result of lower basic prices of diesel fuel and lower excise duties, which does not apply anymore for 2005. The change of real prices for diesel fuel in the period 2005–2008 amounts to 21.5 %, and for gasoline to 21.3 %. The growth dynamics for autogas are significantly smaller than for other motor fuels; a slight increase in the final price was indicated in 2008. The change in real prices in the period 2005–2008 for autogas amounts to 12.0 %, and for the period 2007–2008 to 12.2 %. Due to lower prices and a smaller impact on the environment, autogas presents one of the most widespread alternatives to classic oil fuels.
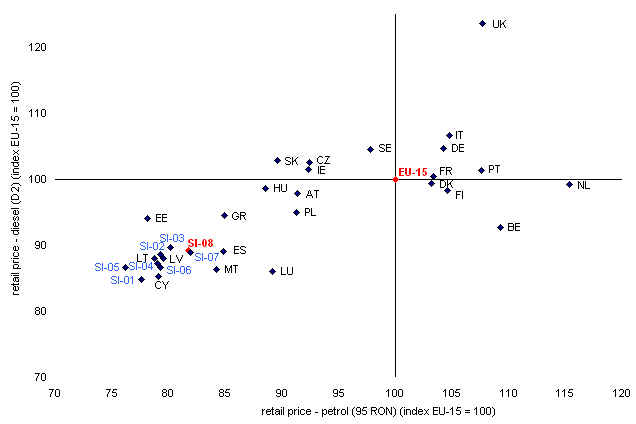
In the area of oil derivatives, the prices of premium unleaded gasoline (NMB 95) and diesel fuel (D2) in 2008 were around 15 % below the average prices of EU-15 countries. Two main reasons are the lower basic price of fuels and largely the fuel taxation level, which remains significantly below the level of the most developed countries.
Slovenian energy policy, defined in the Resolution on the National Energy Programme, does not set any specific objectives with regard to energy prices; however, it stipulates mechanisms in the area of the competitiveness of energy supply, the implementation of which will have an indirect impact on higher competitiveness and energy prices. The opening of markets is significant for the provision of a competitive energy supply, primarily to industrial consumers, for the higher efficiency of operations of energy companies, higher transparency of energy supply and energy markets and better provision of energy services to consumers. Energy policy does not have a direct influence on the basic energy price; the price for the use of networks is also determined by the Energy Agency of the Republic of Slovenia. The only mechanism, by which the state influences the final energy price, is the implementation of fiscal policy, through which it determines the energy taxation level.
Methodology
Data for Slovenia and other countries:
Objectives summarised by: /
Source database or source: The data on energy prices is published by SORS in the web application SI-STAT for all consumer groups. SORS has been collecting data since 1991 for electrical energy, and since 1995 for natural gas. Prices for oil derivatives have been available since 1999, while data on prices before this period is available through oil dealers.
Data administrator: Statistical Office of the Republic of Slovenia (SORS) or Eurostat
Methodology and frequency of data collection for the indicator: Data on energy prices is published twice a year; prices that apply on 1st January are published by SORS in the second week of March, and prices for the 1st July of the current year in the second week of September.
Data processing methodology: Energy prices published by SORS are current prices. Since these are nominal categories, the changes in prices do not reflect the real changes. Real changes in prices are reflected only in real prices, calculated by the deflation of nominal prices with a DBP, which is published for each previous year by SORS. Energy prices, shown in the indicator, are real prices; for the calculation, deflators were used that converted the nominal prices to the level of real prices in 1995. The real prices in 1995 were converted into the Euro currency in 1995 by using the average annual exchange rate of the Bank of Slovenia in 1995. Such conversion enables a better comparability of energy prices in Slovenia with average prices in the EU. Real energy prices were calculated as: PRt = (Pt * (1 / 1995, t)) / dt1995
PR – real prices
P – current prices
D – deflator
dt – exchange rate.
Information concerning data quality:
- Advantages and disadvantages (at data level): the source of the basic data for the entire time series for electrical energy and natural gas is SORS, which enables a quality and more consistent analysis of an individual sector; only the data on fuel prices prior to 1999 had to be obtained from the largest fuel dealer in Slovenia (Petrol)
- Relevance, accuracy, robustness, uncertainty (at data level):
Reliability of the indicator (archive data): The data reflects the prices by individual consumer groups on the first day in January and July. SORS publishes prices that it previously gets from the suppliers of electrical energy and natural gas, and not directly from energy consumers. In industry, the majority of agreements between suppliers and energy consumers is concluded for several years, while usually the prices inside individual consumers of the same consumer group differ; therefore, it is assumed that SORS' prices most likely do not reflect the actual conditions in this area.
Uncertainty of the indicator (scenarios/projections): Projections have not been prepared.
- Overall assessment (1 = no major comments, 3 = data to be considered with reservation):
Relevance: 1
Accuracy: 2
Completeness over time: 1
Completeness over space: 1
Data for other countries
Source database or source: Eurostat, Oil bulletin: under link Time series – History from 2005 onwards
Data administrator: Eurostat, European Communities, contact: tren-oil-bulletin@ec.europa.eu
Date of acquisition for this indicator: 30 November 2009
Methodology and frequency of data collection for the indicator: The database Oil bulletin contains data on prices of motor fuels by individual Member States on a weekly level. The table contains data on fuel prices with and without considered taxes in EU countries. The prices used were in force on 1st January of an individual year for an individual Member State. The methodology of data collection is described here.
Data processing methodology: Prices for individual countries are determined as a weighted average of the prices in Member States.
Geographical coverage:
The EA-15 is composed of countries that used the Euro as their national currency by the end of 2008: Belgium, Germany, Greece, Spain, France, Ireland, Italy, Cyprus, Luxembourg, the Netherlands, Austria, Portugal, Slovenia and Finland.
The EU-15 group is composed of the old EU Member States (Belgium, Denmark, Germany, Greece, Spain, France, Ireland, Italy, Luxembourg, the Netherlands, Austria, Portugal, Finland, Sweden and the United Kingdom). The EU-10 group is composed of the Member States who joined the EU in 2004 (Cyprus, Malta, Estonia, Lithuania, Latvia, Poland, Czech Republic, Slovakia, Slovenia, and Hungary).
The EU-12 includes besides EU-10 also Romania and Bulgaria. The EU-27 includes the EU-15 and EU-12, while the EU-25 includes the EU-15 and EU-10.
Information concerning data quality:
- Advantages and disadvantages(at data level): The source of the basic data for the entire time series for NMB 95 and D2 is Eurostat, which enables a quality and more consistent as well as transparent analysis of an individual sector.
- Relevance, accuracy, robustness, uncertainty (at data level):
Reliability of the indicator (archive data): Comparison of prices and their trends by Member States most likely does not reflect the actual conditions in an area, primarily due to differences in the quality of products, various market practices and differences in the market structure of motor fuels in EU Member States.
Uncertainty of the indicator (scenarios/projections): Projections have not been prepared.
- Overall assessment (1 = no major comments, 3 = data to be considered with reservation):
Relevance: 1
Accuracy: 2
Completeness over time: 1
Completeness over space: 1
Other sources and literature:
- Resolution on the National Energy Programme (ReNEP), OG RS, no. 57/2004).
- Annual energy survey for 2005. 2007. Ljubljana, Jožef Stefan Institute (contracting authority the Ministry of the Economy).


