-
-
-
-
-
-
-
-
Tools and collections
- Environmental atlas
- EIONET in Slovenia
- Environmental indicators
- IED devices
- Endangered species
- IS-waste

-
-
Tools and collections
- Environmental atlas
- EIONET in Slovenia
- Environmental indicators
- IED devices
- Endangered species
- IS-waste

[PR17] Quality of transport fuels

Key message

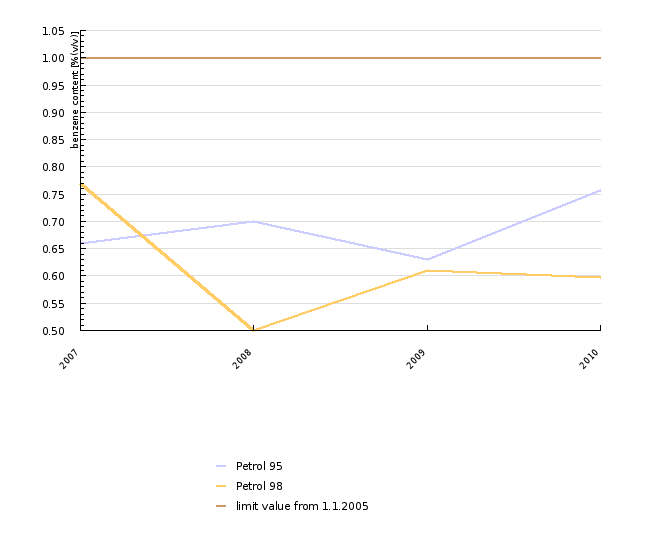
Slovenia is gradually reducing emissions of sulphur dioxide resulting from a tightening of environmental legislation on sulphur emissions from liquid fuels. The maximum permissible limit of sulphur in fuels used in road, air and maritime transport was not exceeded. Lead concentrations have declined considerably with the introduction of unleaded petrol. Benzene measurements are below the prescribed value.
Definition
Charts
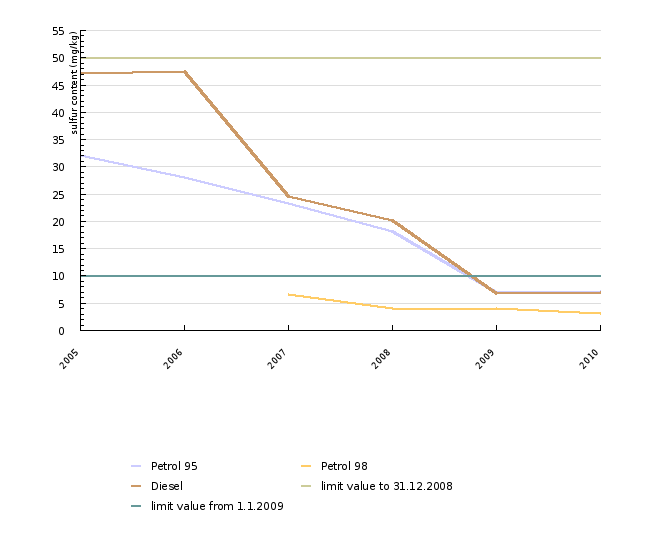
EU Fuel Quality Reporting_Slovenia (2005-2010)
| 2005 | 2006 | 2007 | 2008 | 2009 | 2010 | ||
|---|---|---|---|---|---|---|---|
| Petrol 95 | mg/kg | 32 | 28 | 23.3 | 18.2 | 7 | 7.2 |
| Petrol 98 | mg/kg | 7 | 6.6 | 4.1 | 4 | 3.2 | |
| Diesel | mg/kg | 47.2 | 47.4 | 24.6 | 20.1 | 6.7 | 7 |
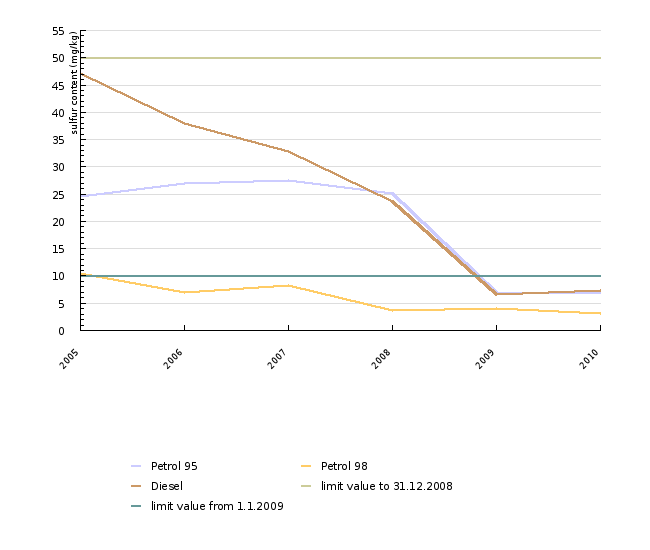
EU Fuel Quality Reporting Slovenia (2005-2010)
| 2005 | 2006 | 2007 | 2008 | 2009 | 2010 | ||
|---|---|---|---|---|---|---|---|
| Petrol 95 | mg/kg | 24.5 | 26.9 | 27.4 | 25.1 | 7 | 7 |
| Petrol 98 | mg/kg | 10.5 | 6.9 | 8.3 | 3.6 | 4 | 3.1 |
| Diesel | mg/kg | 47.2 | 37.9 | 32.9 | 23.7 | 6.6 | 7.3 |
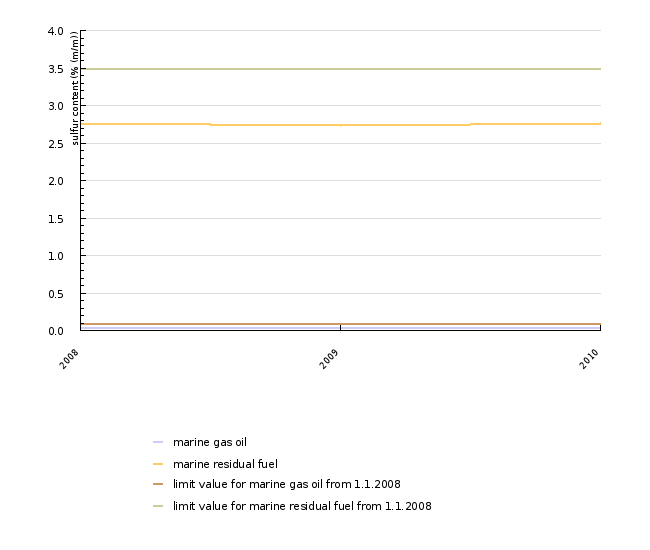
EU Fuel Quality Reporting Slovenia (2008-2010)
| 2008 | 2009 | 2010 | ||
|---|---|---|---|---|
| marine gas oil | % (m/m) | 0.042 | 0.044 | 0.036 |
| marine residual fuel | % (m/m) | 2.76 | 2.74 | 2.76 |
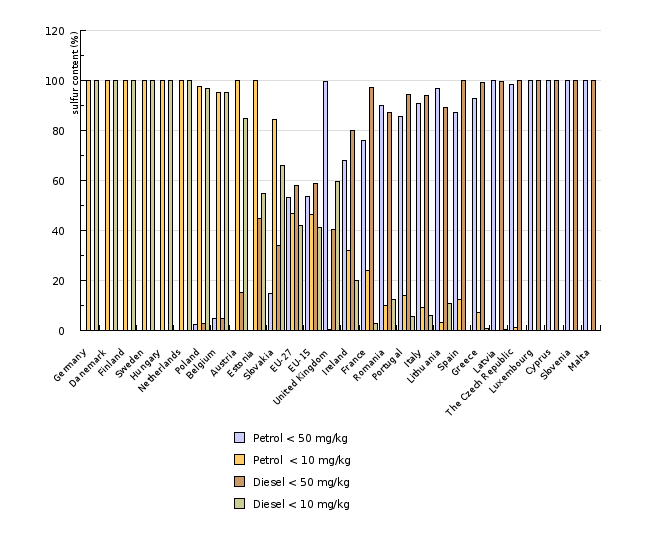
EEA, Use of cleaner and alternative fuels (CSI 037), 2010.
| Germany | Danemark | Finland | Sweden | Hungary | Netherlands | Poland | Belgium | Austria | Estonia | ||
|---|---|---|---|---|---|---|---|---|---|---|---|
| Petrol | % | 0 | 0 | 0 | 0 | 0 | 0 | 2.4 | 5 | 0 | 0 |
| Petrol | % | 100 | 100 | 100 | 100 | 100 | 100 | 97.6 | 95 | 100 | 100 |
| Diesel | % | 0 | 0 | 0 | 0 | 0 | 0 | 3 | 5 | 15.2 | 45 |
| Diesel | % | 100 | 100 | 100 | 100 | 100 | 100 | 97 | 95 | 84.9 | 55 |
| Slovakia | EU-27 | EU-15 | United Kingdom | Ireland | France | Romania | Portugal | Italy | Lithuania | ||
| Petrol | % | 15 | 53.1 | 53.4 | 99.6 | 68 | 76 | 90.1 | 85.8 | 90.7 | 96.9 |
| Petrol | % | 84.5 | 46.9 | 46.6 | 0.4 | 32 | 24 | 9.9 | 14.2 | 9.3 | 3.1 |
| Diesel | % | 33.9 | 57.9 | 58.9 | 40.3 | 79.9 | 97.3 | 87.4 | 94.5 | 94.1 | 89.2 |
| Diesel | % | 66.1 | 42.1 | 41.1 | 59.7 | 20.1 | 2.7 | 12.6 | 5.5 | 5.9 | 10.8 |
| Spain | Greece | Latvia | The Czech Republic | Luxembourg | Cyprus | Slovenia | Malta | ||||
| Petrol | % | 87.4 | 92.8 | 100 | 98.6 | 100 | 100 | 100 | 100 | ||
| Petrol | % | 12.6 | 7.2 | 0 | 1.4 | 0 | 0 | 0 | 0 | ||
| Diesel | % | 100 | 99.1 | 99.6 | 100 | 100 | 100 | 100 | 100 | ||
| Diesel | % | 0 | 0.9 | 0.4 | 0 | 0 | 0 | 0 | 0 |
EU Fuel Quality Reporting Slovenia (2007-2010)
| 2007 | 2008 | 2009 | 2010 | ||
|---|---|---|---|---|---|
| Petrol 95 | % (v/v) | 0.66 | 0.7 | 0.631 | 0.757 |
| Petrol 98 | % (v/v) | 0.77 | 0.5 | 0.61 | 0.597 |
Related indicators
Vesna Polanec, Mirko Bizjak, Slovenian Environment Agency; Aljaž Plevnik, The Urban Planning Institute


