[PR17] Quality of transport fuels

Key message

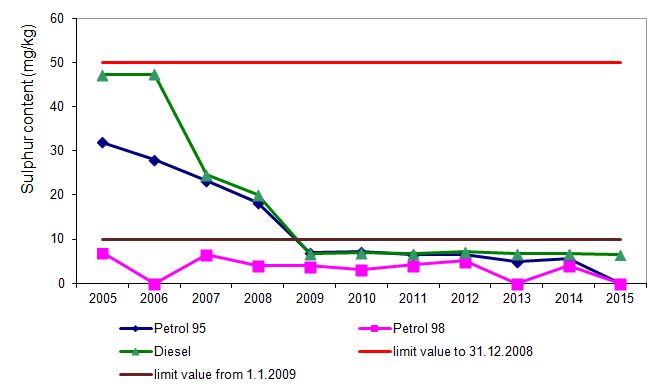
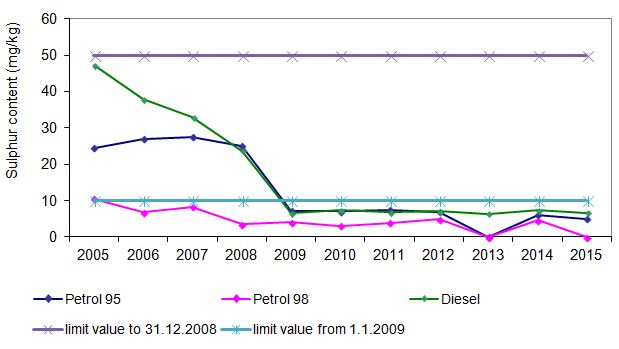
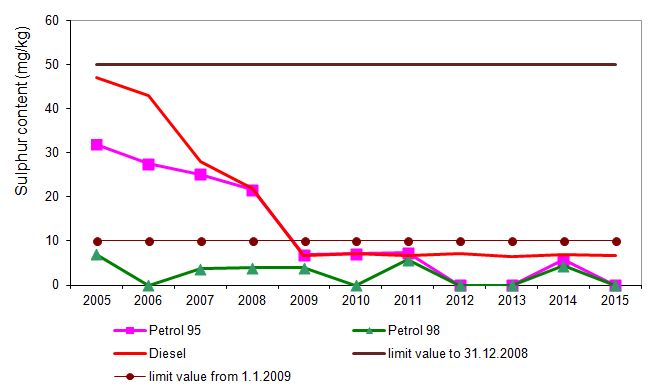
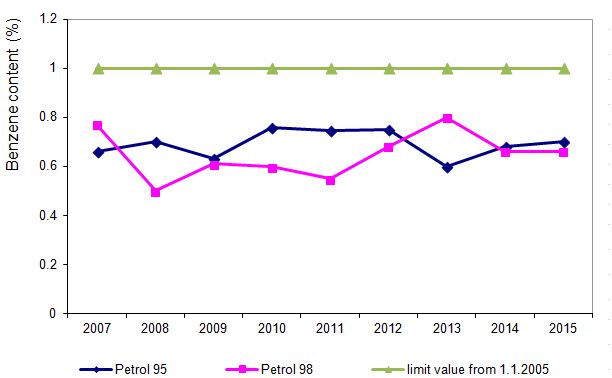
The decrease in SO2 emissions from transport is significantly affected by the tightening of legislation concerning the concentration of sulfur in liquid fuels (10 mg / kg since 2009) for both petrol and diesel. Limited value of concentration of sulfur in fuels used in road transport in 2015 was not exceeded neidher in Sloveia nor in EU-28, the same applies to air and maritime transport. In the last several years the lead in liquid fuels (in road transport) is no longer present, the measurement of benzene are lower than the prescribed value ( 1 % V/V ).
Definition
Charts
EU Fuel Quality Report, Slovenia 2005-2015.
*Note to Figure PR17-1: the concentration of sulfur in the fuel 98 octane are shown only in the table since they can not be properly displayed on the graph due to prescribed format.
| 2005 | 2006 | 2007 | 2008 | 2009 | 2010 | 2011 | 2012 | 2013 | 2014 | ||
|---|---|---|---|---|---|---|---|---|---|---|---|
| Petrol 95 | mg/kg | 32 | 28 | 23.3 | 18.2 | 7 | 7.2 | 6.4 | 6.4 | 4.9 | 5.6 |
| Petrol 98 | mg/kg | 7 | 6.6 | 4.1 | 4 | 3.2 | 4.2 | 5.1 | 4.1 | ||
| Diesel | mg/kg | 47.2 | 47.4 | 24.6 | 20.1 | 6.7 | 7 | 6.7 | 7.1 | 6.7 | 6.8 |
| 2015 | |||||||||||
| Petrol 95 | mg/kg | - | |||||||||
| Petrol 98 | mg/kg | - | |||||||||
| Diesel | mg/kg | 6.6 |
EU Fuel Quality Report, Slovenia, 2005-2015.
*Note to Figure PR17-2: the concentration of sulfur in the fuel 98 octane are shown only in the table since they can not be properly displayed on the graph due to prescribed format.
| 2005 | 2006 | 2007 | 2008 | 2009 | 2010 | 2011 | 2012 | 2013 | 2014 | ||
|---|---|---|---|---|---|---|---|---|---|---|---|
| Petrol 95 | mg/kg | 24.5 | 26.9 | 27.4 | 25.1 | 7.1 | 7 | 7.4 | 6.9 | 6 | |
| Petrol 98 | mg/kg | 10.5 | 6.9 | 8.3 | 3.6 | 4.1 | 3.1 | 3.9 | 4.9 | 4.7 | |
| Diesel | mg/kg | 47.2 | 37.9 | 32.9 | 23.7 | 6.6 | 7.3 | 6.9 | 7 | 6.4 | 7.4 |
| 2015 | |||||||||||
| Petrol 95 | mg/kg | 5 | |||||||||
| Petrol 98 | mg/kg | - | |||||||||
| Diesel | mg/kg | 6.7 |
EU Fuel Quality Reporting Slovenia, 2005-2015.
| 2005 | 2006 | 2007 | 2008 | 2009 | 2010 | 2011 | 2012 | 2013 | 2014 | ||
|---|---|---|---|---|---|---|---|---|---|---|---|
| Petrol 95 | mg/kg | 32 | 27.5 | 25.2 | 21.6 | 7 | 7.2 | 7.3 | 5.8 | ||
| Petrol 98 | mg/kg | 7 | 3.7 | 3.9 | 4 | 5.8 | 4.4 | ||||
| Diesel | mg/kg | 47.2 | 43.1 | 28.1 | 21.9 | 6.7 | 7.2 | 6.7 | 7.1 | 6.5 | 7 |
| 2015 | |||||||||||
| Petrol 95 | mg/kg | - | |||||||||
| Petrol 98 | mg/kg | - | |||||||||
| Diesel | mg/kg | 6.7 |
EU Fuel Quality Report, Slovenia, 2008-2015.
| 2008 | 2009 | 2010 | 2011 | 2012 | 2013 | 2014 | 2015 | ||
|---|---|---|---|---|---|---|---|---|---|
| marine gas oil | % (m/m) | 0 | 0 | 0 | 0.1 | 0 | 0 | 0 | 0 |
| marine residual fuel | % (m/m) | 2.8 | 2.7 | 2.8 | 3.4 | 1.1 | 2.8 | 2.5 | 1.5 |
EU Fuel Quality Monitoring 2002-2013;
* Except for France, which did not submit reports for the period 2003-2005.
* Except for Malta, which had not submitted reports in 2006.
*** Except for Luxembourg, it did not submit reports for the years 2007 and 2008, and in 2009 did not report any data.
| 2002 | 2003 | 2004 | 2005 | 2006 | 2007 | 2008 | 2009 | 2010 | 2011 | ||
|---|---|---|---|---|---|---|---|---|---|---|---|
| Petrol | ppm | 51 | 37 | 38 | 19 | 18 | 18 | 14 | 6 | 6 | 5.8 |
| Diesel | ppm | 169 | 125 | 113 | 25 | 22 | 23 | 18 | 8 | 7.5 | 7.6 |
| 2012 | 2013 | ||||||||||
| Petrol | ppm | 5.7 | 4.8 | ||||||||
| Diesel | ppm | 7.4 | 7.1 |
EU Fuel Quality Report, Slovenia, 2007-2015.
| 2007 | 2008 | 2009 | 2010 | 2011 | 2012 | 2013 | 2014 | 2015 | ||
|---|---|---|---|---|---|---|---|---|---|---|
| Petrol 95 | % (v/v) | 0.7 | 0.7 | 0.6 | 0.8 | 0.7 | 0.8 | 0.6 | 0.7 | 0.7 |
| Petrol 98 | % (v/v) | 0.8 | 0.5 | 0.6 | 0.6 | 0.5 | 0.7 | 0.8 | 0.7 | 0.7 |
| limit value from 1.1.2005 | % (v/v) | 1 | 1 | 1 | 1 | 1 | 1 | 1 | 1 | 1 |
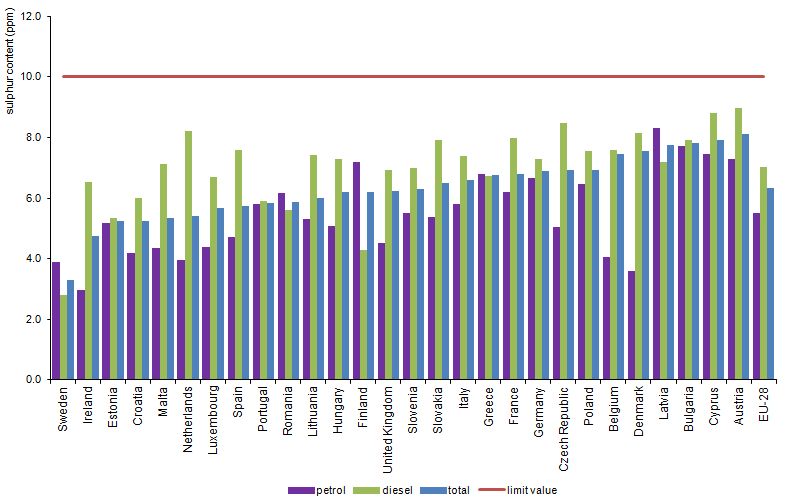
EU Fuel Quality Reporting, 2014
| Sweden | Ireland | Estonia | Croatia | Malta | Netherlands | Luxembourg | Spain | Portugal | Romania | ||
|---|---|---|---|---|---|---|---|---|---|---|---|
| petrol | ppm | 4 | 3 | 5 | 4 | 4 | 4 | 4 | 5 | 6 | 6 |
| diesel | ppm | 3 | 7 | 5 | 6 | 7 | 8 | 7 | 8 | 6 | 6 |
| total | ppm | 3 | 5 | 5 | 5 | 5 | 5 | 6 | 6 | 6 | 6 |
| Lithuania | Hungary | Finland | United Kingdom | Slovenia | Slovakia | Italy | Greece | France | Germany | ||
| petrol | ppm | 5 | 5 | 7 | 5 | 6 | 5 | 6 | 7 | 6 | 7 |
| diesel | ppm | 7 | 7 | 4 | 7 | 7 | 8 | 7 | 7 | 8 | 7 |
| total | ppm | 6 | 6 | 6 | 6 | 6 | 7 | 7 | 7 | 7 | 7 |
| Czech Republic | Poland | Belgium | Denmark | Latvia | Bulgaria | Cyprus | Austria | EU-28 | |||
| petrol | ppm | 5 | 6 | 4 | 4 | 8 | 8 | 7 | 7 | 5 | |
| diesel | ppm | 8 | 8 | 8 | 8 | 7 | 8 | 9 | 9 | 7 | |
| total | ppm | 7 | 7 | 7 | 8 | 8 | 8 | 8 | 8 | 6 |


