[PR01] Passenger transport demand

Key message

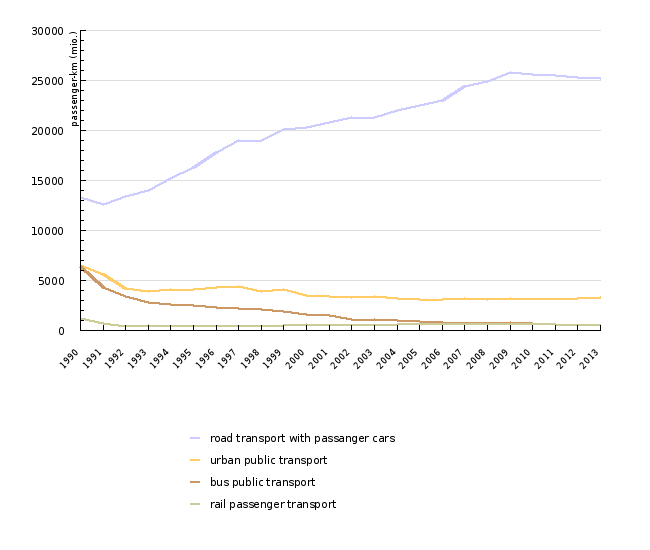
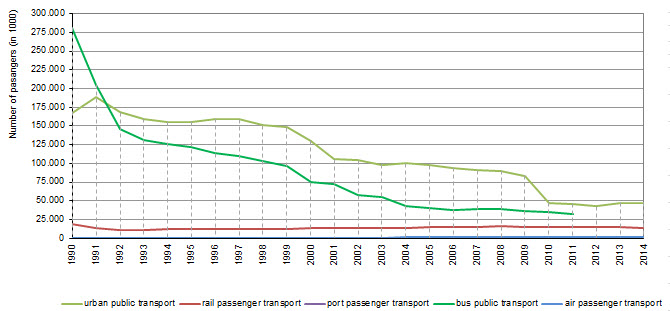
In Slovenia the volume of passenger transport has been increasing for several decades, primarily due to growth of the most unsustainable modes - automobile and air transport after 2002. The growth stopped with the economic recession in 2008, with a slight decrease after 2010. In opposite the scope of public transport modes is being in decline for decades, especially the proportion of bus services. In the last decade the proportion of public transport has stabilized, though on much lower level then it was before 1991 when Slovenia became independent.
Definition
Charts
Statistical Office of the Republic of Slovenia: Statistical Yearbook of the Republic of Slovenia 1992-2013 and SI-STAT Data portal, 2015.
Note: *Data after 2010 are no longer available.
| 1990 | 1991 | 1992 | 1993 | 1994 | 1995 | 1996 | 1997 | 1998 | 1999 | ||
|---|---|---|---|---|---|---|---|---|---|---|---|
| road transport with passanger cars | passenger-km (mio.) | 13320 | 12606 | 13386 | 13979 | 15178 | 16338 | 17794 | 19010 | 18980 | 20074 |
| urban public transport | passenger-km (mio.) | 6508 | 5554 | 4170 | 3894 | 4053 | 4113 | 4301 | 4379 | 3876 | 4138 |
| bus public transport | passenger-km (mio.) | 6444 | 4282 | 3377 | 2751 | 2595 | 2507 | 2348 | 2195 | 2098 | 1940 |
| rail passenger transport | passenger-km (mio.) | 1166 | 656 | 404 | 453 | 475 | 490 | 510 | 511 | 520 | 523 |
| 2000 | 2001 | 2002 | 2003 | 2004 | 2005 | 2006 | 2007 | 2008 | 2009 | ||
| road transport with passanger cars | passenger-km (mio.) | 20325 | 20801 | 21287 | 21331 | 22042 | 22509 | 23018 | 24355 | 24878 | 25775 |
| urban public transport | passenger-km (mio.) | 3502 | 3393 | 3339 | 3446 | 3218 | 3061 | 3062 | 3235 | 3146 | 3196 |
| bus public transport | passenger-km (mio.) | 1581 | 1470 | 1143 | 1065 | 1000 | 862 | 850 | 817 | 815 | 777 |
| rail passenger transport | passenger-km (mio.) | 593 | 594 | 622 | 650 | 648 | 666 | 675 | 690 | 713 | 718 |
| 2010 | 2011 | 2012 | 2013 | ||||||||
| road transport with passanger cars | passenger-km (mio.) | 25636 | 25487 | 25302 | 25168 | ||||||
| urban public transport | passenger-km (mio.) | 3183 | 3244 | 3237 | 3322 | ||||||
| bus public transport | passenger-km (mio.) | 733 | 702 | * | |||||||
| rail passenger transport | passenger-km (mio.) | 680 | 641 | 614 | 636 |
Statistical Office of the Republic of Slovenia: Statistical Yearbook of the Republic of Slovenia 1992-2013 and SI-STAT Data Portal, 2015.
| 1990 | 1991 | 1992 | 1993 | 1994 | 1995 | 1996 | 1997 | 1998 | 1999 | ||
|---|---|---|---|---|---|---|---|---|---|---|---|
| urban public transport | number of passenegers (1000) | 167665 | 188465 | 168542 | 159428 | 155463 | 155425 | 159375 | 158684 | 150988 | 148321 |
| bus public transport | number of passenegers (1000) | 280801 | 205001 | 146107 | 130586 | 125344 | 121573 | 113411 | 109801 | 102561 | 96573 |
| rail passenger transport | number of passenegers (1000) | 19427 | 14264 | 10955 | 11594 | 12113 | 12422 | 12870 | 12743 | 12971 | 12987 |
| air passenger transport | number of passenegers (1000) | 747 | 336 | 274 | 422 | 504 | 649 | 679 | 728 | 807 | 916 |
| port passenger transport | number of passenegers (1000) | 63 | 21 | 14 | 39 | 42 | 40 | 32 | 44 | 41 | 38 |
| urban public transport | index (1990=100) | 100 | 112 | 101 | 95 | 93 | 93 | 95 | 95 | 90 | 88 |
| bus public transport | index (1990=100) | 100 | 73 | 52 | 47 | 45 | 43 | 40 | 39 | 37 | 34 |
| rail passenger transport | index (1990=100) | 100 | 73 | 56 | 60 | 62 | 64 | 66 | 66 | 67 | 67 |
| air passenger transport | index (1990=100) | 100 | 45 | 37 | 56 | 67 | 87 | 91 | 97 | 108 | 123 |
| port passenger transport | index (1990=100) | 100 | 33 | 22 | 62 | 67 | 64 | 51 | 70 | 65 | 60 |
| 2000 | 2001 | 2002 | 2003 | 2004 | 2005 | 2006 | 2007 | 2008 | 2009 | ||
| urban public transport | number of passenegers (1000) | 130031 | 105599 | 103938 | 98373 | 100245 | 97227 | 93953 | 90654 | 90024 | 83500 |
| bus public transport | number of passenegers (1000) | 74560 | 72504 | 57955 | 54538 | 43084 | 39759 | 37964 | 38532 | 38751 | 36720 |
| rail passenger transport | number of passenegers (1000) | 14171 | 13585 | 13593 | 14152 | 13985 | 14917 | 15275 | 15232 | 15753 | 15434 |
| air passenger transport | number of passenegers (1000) | 1012 | 906 | 885 | 948 | 1068 | 1246 | 1358 | 1569 | 1701 | 1462 |
| port passenger transport | number of passenegers (1000) | 38 | 34 | 42 | 47 | 42 | 35 | 30 | 51 | 50 | 78 |
| urban public transport | index (1990=100) | 78 | 63 | 62 | 59 | 60 | 58 | 56 | 54 | 54 | 50 |
| bus public transport | index (1990=100) | 27 | 26 | 21 | 19 | 15 | 14 | 14 | 14 | 14 | 13 |
| rail passenger transport | index (1990=100) | 73 | 70 | 70 | 73 | 72 | 77 | 79 | 78 | 81 | 79 |
| air passenger transport | index (1990=100) | 135 | 121 | 118 | 127 | 143 | 167 | 182 | 210 | 228 | 196 |
| port passenger transport | index (1990=100) | 60 | 54 | 67 | 75 | 67 | 56 | 47 | 82 | 79 | 123 |
| 2010 | 2011 | 2012 | 2013 | 2014 | |||||||
| urban public transport | number of passenegers (1000) | 47211 | 45980 | 42760 | 47751 | 47550 | |||||
| bus public transport | number of passenegers (1000) | 34769 | 32404 | * | |||||||
| rail passenger transport | number of passenegers (1000) | 15294 | 14838 | 14622 | 15563 | 14054 | |||||
| air passenger transport | number of passenegers (1000) | 1425 | 1392 | 1216 | 1348 | 1373 | |||||
| port passenger transport | number of passenegers (1000) | 71 | 133 | 99 | 95 | 87 | |||||
| urban public transport | index (1990=100) | 28 | 27 | 27 | 30 | 30 | |||||
| bus public transport | index (1990=100) | 12 | 12 | ||||||||
| rail passenger transport | index (1990=100) | 79 | 76 | 75 | 80 | 72 | |||||
| air passenger transport | index (1990=100) | 191 | 186 | 162 | 180 | 183 | |||||
| port passenger transport | index (1990=100) | 112 | 211 | 157 | 150 | 138 |
EEA – Passenger transport modal split. European Environmental Agency, 2015
| Hungary | Slovakia | Bulgaria | Czech Republic | Malta | Romania | Belgium | Austria | Estonia | Denmark | ||
|---|---|---|---|---|---|---|---|---|---|---|---|
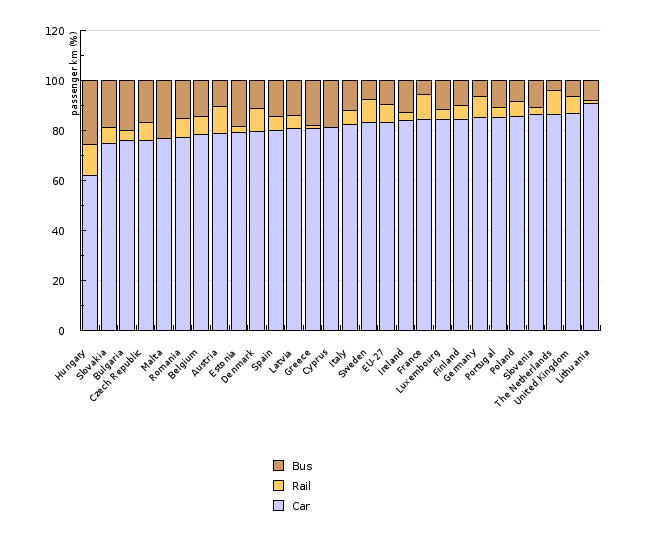
| Car | passenger-km (mio.) | 42 | 26.4 | 43.2 | 72.4 | 1.7 | 70.5 | 110.9 | 73.3 | 10.5 | 52.9 |
| Rail | passenger-km (mio.) | 8.3 | 2.3 | 2.3 | 6.8 | 0 | 7 | 10.1 | 10.4 | 0.3 | 6.3 |
| Bus | passenger-km (mio.) | 17.4 | 6.6 | 11.4 | 16.1 | 0.5 | 13.9 | 20.4 | 9.6 | 2.5 | 7.4 |
| Total | passenger-km (mio.) | 67.7 | 35.3 | 56.9 | 95.2 | 2.2 | 91.3 | 141.4 | 93.2 | 13.2 | 66.5 |
| Car | % | 62.1 | 74.9 | 75.9 | 76 | 76.7 | 77.2 | 78.4 | 78.6 | 79.4 | 79.4 |
| Rail | % | 12.3 | 6.5 | 4.1 | 7.1 | 0 | 7.6 | 7.2 | 11.1 | 2.1 | 9.4 |
| Bus | % | 25.7 | 18.6 | 20 | 16.9 | 23.3 | 15.2 | 14.4 | 10.2 | 18.5 | 11.1 |
| Spain | Latvia | Greece | Cyprus | Italy | Sweden | EU-27 | Ireland | France | Luxembourg | ||
| Car | passenger-km (mio.) | 339.1 | 14.3 | 100 | 5.8 | 719.6 | 98.4 | 1780.8 | 49 | 720.2 | 6.7 |
| Rail | passenger-km (mio.) | 23.5 | 0.9 | 1.7 | 0 | 49.5 | 11 | 140.3 | 2 | 86.5 | 0.3 |
| Bus | passenger-km (mio.) | 60.9 | 2.5 | 22.1 | 1.3 | 103.9 | 8.8 | 305 | 7.5 | 48.6 | 0.9 |
| Total | passenger-km (mio.) | 423.4 | 17.7 | 123.8 | 7.1 | 873 | 118.2 | 2226.1 | 58.5 | 855.2 | 8 |
| Car | % | 80.1 | 80.6 | 80.8 | 81.2 | 82.4 | 83.3 | 83.3 | 83.8 | 84.2 | 84.2 |
| Rail | % | 5.5 | 5.3 | 1.3 | 0 | 5.7 | 9.3 | 7.3 | 3.4 | 10.1 | 4.3 |
| Bus | % | 14.4 | 14.1 | 17.9 | 18.8 | 11.9 | 7.4 | 9.4 | 12.8 | 5.7 | 11.4 |
| Finland | Germany | Portugal | Poland | Slovenia | The Netherlands | United Kingdom | Lithuania | ||||
| Car | passenger-km (mio.) | 63.4 | 852.3 | 87 | 273.5 | 24.9 | 147 | 679 | 38 | ||
| Rail | passenger-km (mio.) | 4.1 | 85.6 | 4.2 | 19.8 | 0.8 | 16.5 | 52.9 | 0.4 | ||
| Bus | passenger-km (mio.) | 7.5 | 63.5 | 10.9 | 26.8 | 3.1 | 6.5 | 50.1 | 3.4 | ||
| Total | passenger-km (mio.) | 75 | 1001.4 | 102.2 | 320.1 | 28.9 | 170 | 782 | 41.8 | ||
| Car | % | 84.5 | 85.1 | 85.2 | 85.5 | 86.2 | 86.5 | 86.8 | 90.9 | ||
| Rail | % | 5.4 | 8.6 | 4.1 | 6.2 | 2.9 | 9.7 | 6.8 | 1 | ||
| Bus | % | 10.1 | 6.3 | 10.7 | 8.4 | 10.9 | 3.8 | 6.4 | 8.2 |
European Commission, Statistical pocketbook 2015, Performance of passenger transport (pkm), 2015; Eurostat, Annual national accounts; SISTAT, Ekonomsko področje, Bruto domači proizvod
| 2003 | 2004 | 2005 | 2006 | 2007 | 2008 | 2009 | 2010 | 2011 | 2012 | ||
|---|---|---|---|---|---|---|---|---|---|---|---|
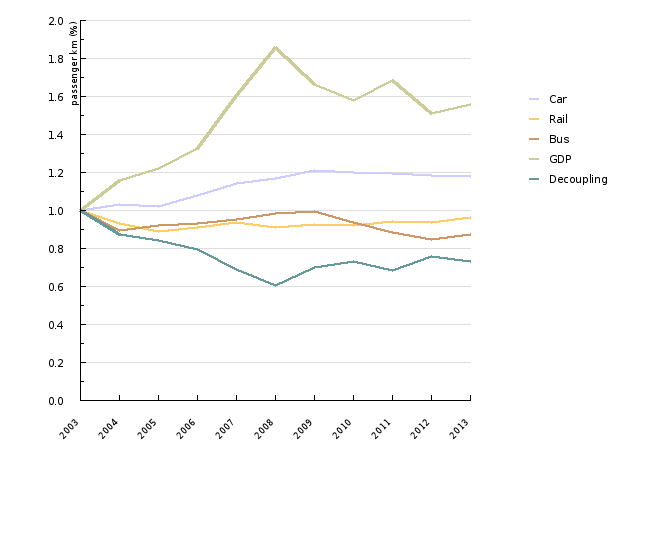
| Car | passenger-km (mio.) | 21.3 | 22 | 22.5 | 23 | 24.4 | 24.9 | 25.8 | 25.6 | 25.5 | 25.3 |
| Rail | passenger-km (mio.) | 0.8 | 0.7 | 0.7 | 0.7 | 0.7 | 0.8 | 0.8 | 0.7 | 0.7 | 0.7 |
| Bus | passenger-km (mio.) | 3.4 | 3.2 | 3.1 | 3.1 | 3.2 | 3.1 | 3.2 | 3.2 | 3.2 | 3.2 |
| Total | passenger-km (mio.) | 25.6 | 26 | 26.3 | 26.9 | 28.3 | 28.8 | 29.7 | 29.5 | 29.4 | 29.2 |
| GDP | euro per capita | 14876.9 | 17258.8 | 18165.1 | 19715.3 | 23863.2 | 27606 | 24707.7 | 23457.3 | 25018.8 | 22480.8 |
| Car | index | 1 | 1 | 1 | 1.1 | 1.1 | 1.2 | 1.2 | 1.2 | 1.2 | 1.2 |
| Rail | index | 1 | 0.9 | 0.9 | 0.9 | 0.9 | 0.9 | 0.9 | 0.9 | 0.9 | 0.9 |
| Bus | index | 1 | 0.9 | 0.9 | 0.9 | 1 | 1 | 1 | 0.9 | 0.9 | 0.8 |
| GDP | index | 1 | 1.2 | 1.2 | 1.3 | 1.6 | 1.9 | 1.7 | 1.6 | 1.7 | 1.5 |
| Decoupling | / | 1 | 0.9 | 0.8 | 0.8 | 0.7 | 0.6 | 0.7 | 0.7 | 0.7 | 0.8 |
| 2013 | |||||||||||
| Car | passenger-km (mio.) | 25.2 | |||||||||
| Rail | passenger-km (mio.) | 0.7 | |||||||||
| Bus | passenger-km (mio.) | 3.3 | |||||||||
| Total | passenger-km (mio.) | 29.2 | |||||||||
| GDP | euro per capita | 23155 | |||||||||
| Car | index | 1.2 | |||||||||
| Rail | index | 1 | |||||||||
| Bus | index | 0.9 | |||||||||
| GDP | index | 1.6 | |||||||||
| Decoupling | / | 0.7 |


