[ZD04] Outbreaks of waterborne diseases (epidemics)

Key message

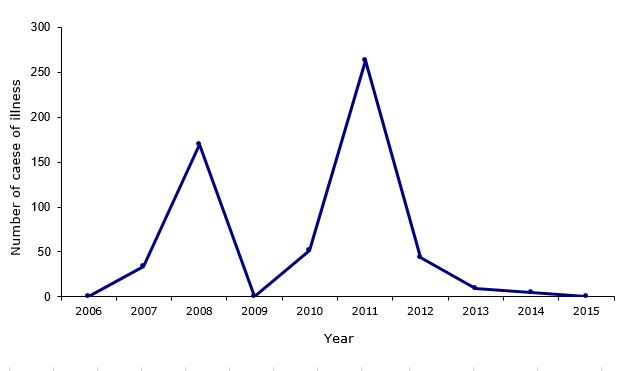
Slovenia reported 1–3 waterborne outbreaks per year in the period 2006–2015. In these outbreaks, associated with drinking water, 5–263 cases were reported. In half of the outbreaks, aetiologies were unidentified, while in the other half, the following causes were identified: Cryptosporidium parvum, Escherichia coli, rotavirus, norovirus, Bacillus cereus, Campylobacter jejuni and Salmonella Typhimurium.
Definition
This indicator shows the number of received reports of infections of the gastrointestinal tract that can be transmitted via drinking water. The source of infection is microbiological (via faeces) contamination of drinking water; consequently, the indicator is a sign of drinking water quality.
An outbreak attributable to water is the occurrence of a contagious disease transmitted via drinking water that is greater than would otherwise be expected at a particular time and place and in the number of affected individuals; as well, at least two people will show similar clinical symptoms and an epidemiological picture shows that water is a probable source of infection. Outbreaks are sudden and affect individuals using drinking water from the same source or area. The disease may affect all age groups. Outbreaks are not season-related, although they may be influenced by meteorological conditions (abundant rain, snow melt) and disruptions in the treatment and distribution of drinking water as well as by management of water protection areas and compliance with protection regimes within such areas.
Charts
National Institute of Public health, 2005-2015
| 2006 | 2007 | 2008 | 2009 | 2010 | 2011 | 2012 | 2013 | 2014 | 2015 | ||
|---|---|---|---|---|---|---|---|---|---|---|---|
| Celje | No. | 0 | 0 | 0 | 0 | 0 | 0 | 0 | 0 | 0 | 0 |
| Koper | No. | 0 | 0 | 1 | 0 | 0 | 0 | 0 | 0 | 0 | 0 |
| Kranj | No. | 0 | 1 | 0 | 0 | 0 | 1 | 0 | 1 | 0 | 0 |
| Ljubljana | No. | 0 | 0 | 0 | 0 | 1 | 1 | 1 | 0 | 1 | 0 |
| Maribor | No. | 0 | 0 | 0 | 0 | 0 | 1 | 0 | 0 | 0 | 0 |
| Murska Sobota | No. | 0 | 0 | 0 | 0 | 0 | 0 | 0 | 0 | 0 | 0 |
| Nova Gorica | No. | 0 | 0 | 0 | 0 | 0 | 0 | 0 | 0 | 0 | 0 |
| Novo mesto | No. | 0 | 0 | 0 | 0 | 0 | 0 | 0 | 0 | 0 | 0 |
| R/K | No. | 0 | 0 | 0 | 0 | 0 | 0 | 0 | 0 | 0 | 0 |
| Total | No. | 0 | 1 | 1 | 0 | 1 | 3 | 1 | 1 | 1 | 0 |
National Institute of Public Health, 2005-2015
| 2006 | 2007 | 2008 | 2009 | 2010 | 2011 | 2012 | 2013 | 2014 | 2015 | ||
|---|---|---|---|---|---|---|---|---|---|---|---|
| Celje | No. | 0 | 0 | 0 | 0 | 0 | 0 | 0 | 0 | 0 | 0 |
| Koper | No. | 0 | 0 | 170 | 0 | 0 | 0 | 0 | 0 | 0 | 0 |
| Kranj | No. | 0 | 34 | 0 | 0 | 0 | 91 | 0 | 9 | 0 | 0 |
| Ljubljana | No. | 0 | 0 | 0 | 0 | 52 | 152 | 44 | 0 | 5 | 0 |
| Maribor | No. | 0 | 0 | 0 | 0 | 0 | 20 | 0 | 0 | 0 | 0 |
| Murska Sobota | No. | 0 | 0 | 0 | 0 | 0 | 0 | 0 | 0 | 0 | 0 |
| Nova Gorica | No. | 0 | 0 | 0 | 0 | 0 | 0 | 0 | 0 | 0 | 0 |
| Novo mesto | No. | 0 | 0 | 0 | 0 | 0 | 0 | 0 | 0 | 0 | 0 |
| Ravne na Kor. | No. | 0 | 0 | 0 | 0 | 0 | 0 | 0 | 0 | 0 | 0 |
| Total | No. | 0 | 34 | 170 | 0 | 52 | 263 | 44 | 9 | 5 | 0 |
National Institute of public Health
* ZD4-3:ICD 10: A09- Other gastroenteritis and colitis of infectious and unspecified origin, A04.9 Bacterial intestinal infection, unspecified, A05.9 Bacterial foodborne intoxication, unspecified, A08.4 Viral intestinal infection, unspecified
| 2007 | 2008 | 2009 | 2010 | 2011 | 2012 | 2013 | 2014 | 2015 | ||
|---|---|---|---|---|---|---|---|---|---|---|
| Percentage of infectious diarrhoea (ICD10: A09, A04.9, A05.9, A08.4) with unconfirmed agent to all reported infectious diarrhoea | % | 67.3 | 70.7 | 71.1 | 69.8 | 69.9 | 72.9 | 70.3 | 70.5 | 66 |
| Percentage of infectious diarrhoea (ICD10: A09, A04.9, A05.9, A08.4) with unconfirmed agent to all reported contagious infectious diarrhoea | % | 21.4 | 23.7 | 19.8 | 22.9 | 21.4 | 20.4 | 19.7 | 21.9 | 25 |
EU summary report on zoonoses, zoonotic agents and food-borne outbreaks 2010-2013; EFSA Journal
| Austria | Belgium | Denmark | Finland | France | Greece | Hungary | Ireland | Poland | Slovenia | ||
|---|---|---|---|---|---|---|---|---|---|---|---|
| 2008 | No. | 3 | 1 | 3 | 1 | ||||||
| 2009 | No. | 1 | 1 | 4 | 1 | 4 | 1 | ||||
| 2010 | No. | 1 | 2 | 1 | 1 | 3 | 1 | ||||
| 2011 | No. | 1 | 6 | 3 | 3 | ||||||
| 2012 | No. | 1 | 2 | 2 | 11 | 1 | |||||
| 2013 | No. | 1 | 2 | 1 | 2 | 1 | |||||
| 2008-2013 | No. | 1 | 2 | 4 | 12 | 8 | 3 | 1 | 24 | 4 | 7 |
| Spain | Sweden | United Kingdom | |||||||||
| 2008 | No. | 2 | 1 | ||||||||
| 2009 | No. | 2 | |||||||||
| 2010 | No. | 5 | 1 | ||||||||
| 2011 | No. | 1 | |||||||||
| 2012 | No. | ||||||||||
| 2013 | No. | 2 | 1 | ||||||||
| 2008-2013 | No. | 4 | 9 | 2 |
EU summary report on zoonoses, zoonotic agents and food-borne outbreaks 2010-2013; EFSA Journal
| Austria | Hunagry | Belgium | United Kingdom | Greece | Denmark | Poland | Spain | Slovenia | France | ||
|---|---|---|---|---|---|---|---|---|---|---|---|
| 2008 | No. | 597 | 10 | 170 | 26 | ||||||
| 2009 | No. | 60 | 500 | 6 | 45 | ||||||
| 2010 | No. | 3000 | 44 | 800 | 67 | 52 | |||||
| 2011 | No. | 64 | 263 | ||||||||
| 2012 | No. | 631 | 183 | 44 | |||||||
| 2013 | No. | 2 | 39 | 18 | 9 | 6 | |||||
| 2008-2013 | No. | 2 | 597 | 3064 | 83 | 691 | 1483 | 73 | 28 | 538 | 77 |
| Sweden | Finland | Ireland | |||||||||
| 2008 | No. | 2000 | 14 | ||||||||
| 2009 | No. | 177 | 191 | 8 | |||||||
| 2010 | No. | 13755 | 17 | 50 | |||||||
| 2011 | No. | 20000 | 78 | 25 | |||||||
| 2012 | No. | 245 | 54 | ||||||||
| 2013 | No. | 214 | 26 | ||||||||
| 2008-2013 | No. | 35932 | 745 | 177 |
Goals
- To provide access to safe drinking water and adequate water treatment to all inhabitants of Slovenia;
- to improve the microbiological quality of drinking water in Slovenia, especially with regard to faecal pollution and particularly in small systems and areas with karst drinking water sources, which are classified as surface drinking water sources from the perspective of public health;
- to ensure, early-as-possible detection, information, management and reduction of the number of cases of outbreaks of waterborne acute gastroenterocolitis of unknown etiology;
- to analyse causes and eliminate mistakes in treatment and management of outbreaks on the basis of experience. In each outbreak, efforts should be made to improve treatment and management methods, which should serve as useful experience in the future.
Comment
Safe drinking water is of essential importance for human health. Drinking water can carry various causative agents of infection: bacteria (Salmonella typhi and other Salmonella types, Campylobacter jejuni, Escherichia coli, Vibrio cholere, Yersinia enterocolitica, Shigella spp., Pseudomonas aeruginosa), viruses (adenovirus types, enterovirus types, hepatitis A and E viruses, norovirus types, rotavirus types) and protozoa (Cryptosporidium parvum, Giardia intestinalis). Contaminated drinking water used for drinking, cooking, food preparation or other household purposes can cause illness.
Over the past 19 years (1997–2015), the number of reported outbreaks of waterborne diseases in Slovenia has ranged between 1 and 3 annually; no outbreaks were reported in 2006, 2009 and 2015. The number of reported cases within each outbreak ranged between 5 and 263, and total 1,809 persons. In about half of outbreaks in the period 2005–2014, causative agents were unknown. In other outbreaks, the following causative agents were isolated from stool samples of patients: Cryptosporidium parvum, Escherichia coli, rotavirus, norovirus, Bacillus cereus, Campylobacter jejuni, Salmonella Typhimurium. The number of reported waterborne outbreaks is underestimated. Some outbreaks go unrecorded, as patients do not seek medical help due to mild symptoms or for other reasons.
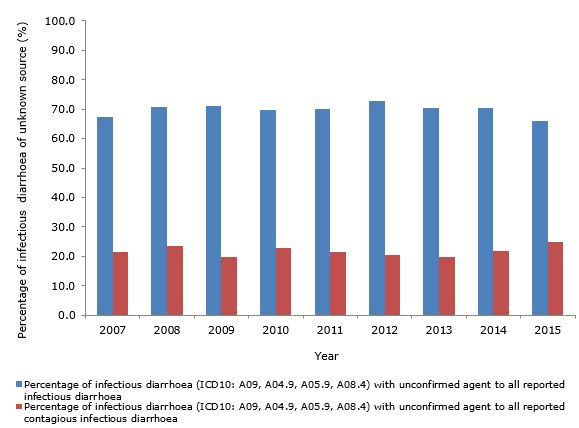
Within regular epidemiologic monitoring of contagious diseases in 2015, no waterborne outbreak was reported. However, 19,261 cases of acute intestinal infections were reported in 2015 (MKB10: A09–diarrhea and gastroenteritis, A04.9-bacterial intestinal infection, unidentified, A05.9-bacterial food intoxication, unidentified, A08.4-viral intestinal infection, unidentified) in which causative agents were unproven, which represents 25% of all reported infectious diseases (a total of 78,373 reported infectious diseases Slovenia in 2015). As regards the number of reported cases of infectious diseases, acute intestinal infections in the period 1997–2005 in which causative agents were unproven were second most common, following chickenpox. In the period 2006–2015, their number increased markedly and alternated between first and second place with chickenpox. In 2015, acute intestinal infections were the most common infection disease. The incidence per 100,000 inhabitants increased constantly in the period 1997–2015, except for minor decreases in 2003, 2005 and 2009; the incidence in the said period more than doubled, from 270.8 in 1997 to 1,413.8 in 2015 (Institute of Public Health [National Institute of Public Health], 1998–2016). In cases of acute intestinal infection where causative agents were unproven, an infection may have been caused by drinking water.
In the period 2007–2015, acute intestinal infectious diseases (MKB10: A09–diarrhea and gastroenteritis, A04.9-bacterial intestinal infection, unidentified, A05.9-bacterial food intoxication, unidentified, A08.4-viral intestinal infection, unidentified) in which causative agents were unproven represented more than two thirds of all reported intestinal infectious diseases or more than 25% of all reported infectious diseases in this period.
A high percentage of the population in Slovenia has no access to safe drinking water. In 2015, 7% of the population was supplied from their own water sources not covered by the drinking water monitoring system. These people are largely unaware of the quality of the water they use for drinking. Moreover, small water supply systems are largely contaminated with faecal microorganisms due to insufficient drinking water treatment and control (Institute of Public Health of the Republic of Slovenia, 2005–2008; Institute of Public Health Maribor, 2009–2013, National Laboratory of Health, Environment and Food, 2014–2016).
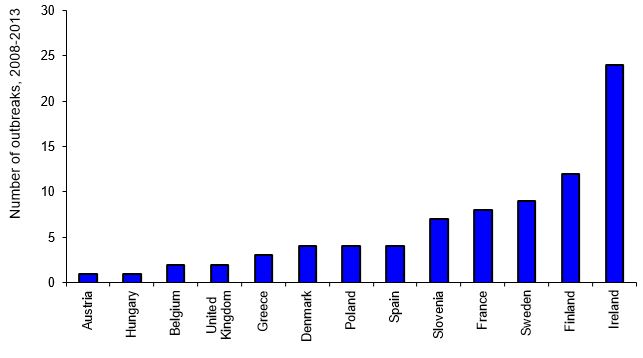
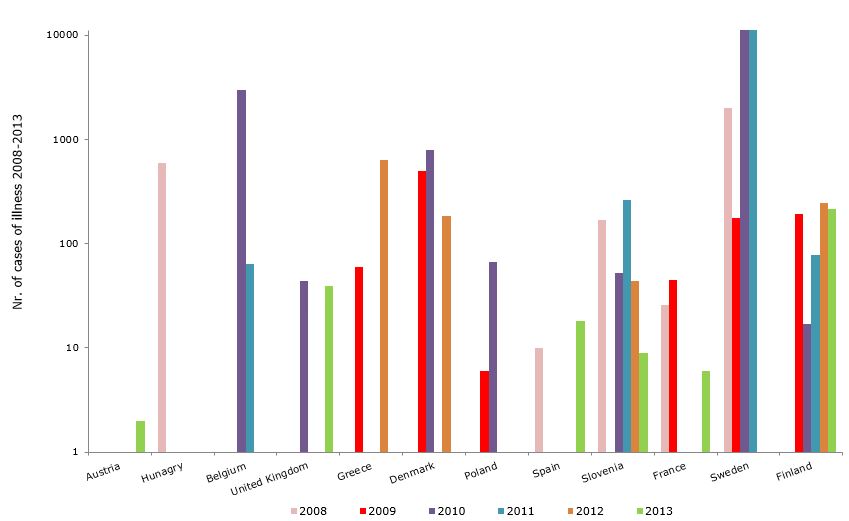
The comparison of 13 European countries, including Slovenia, in the period 2008–2013 showed that the highest number of waterborne outbreaks occurred in Ireland (24), Finland (12) and Sweden (9). The number of infected people was also highest in these countries. The most common causative agents were bacteria (Campylobacter, E. coli and Shigella sonnei), which caused 43 (53.1%) outbreaks and 79.1% of cases of disease in individuals. Viruses were involved in 25 outbreaks (30.9%) and 19.8% of individual cases of disease, while other causative agents were determined in 4 events (5%) and the cause was unknown in 9 events (11.1%). No trends between or within the countries could be discerned from the data (EFSA Journal, 2015).


