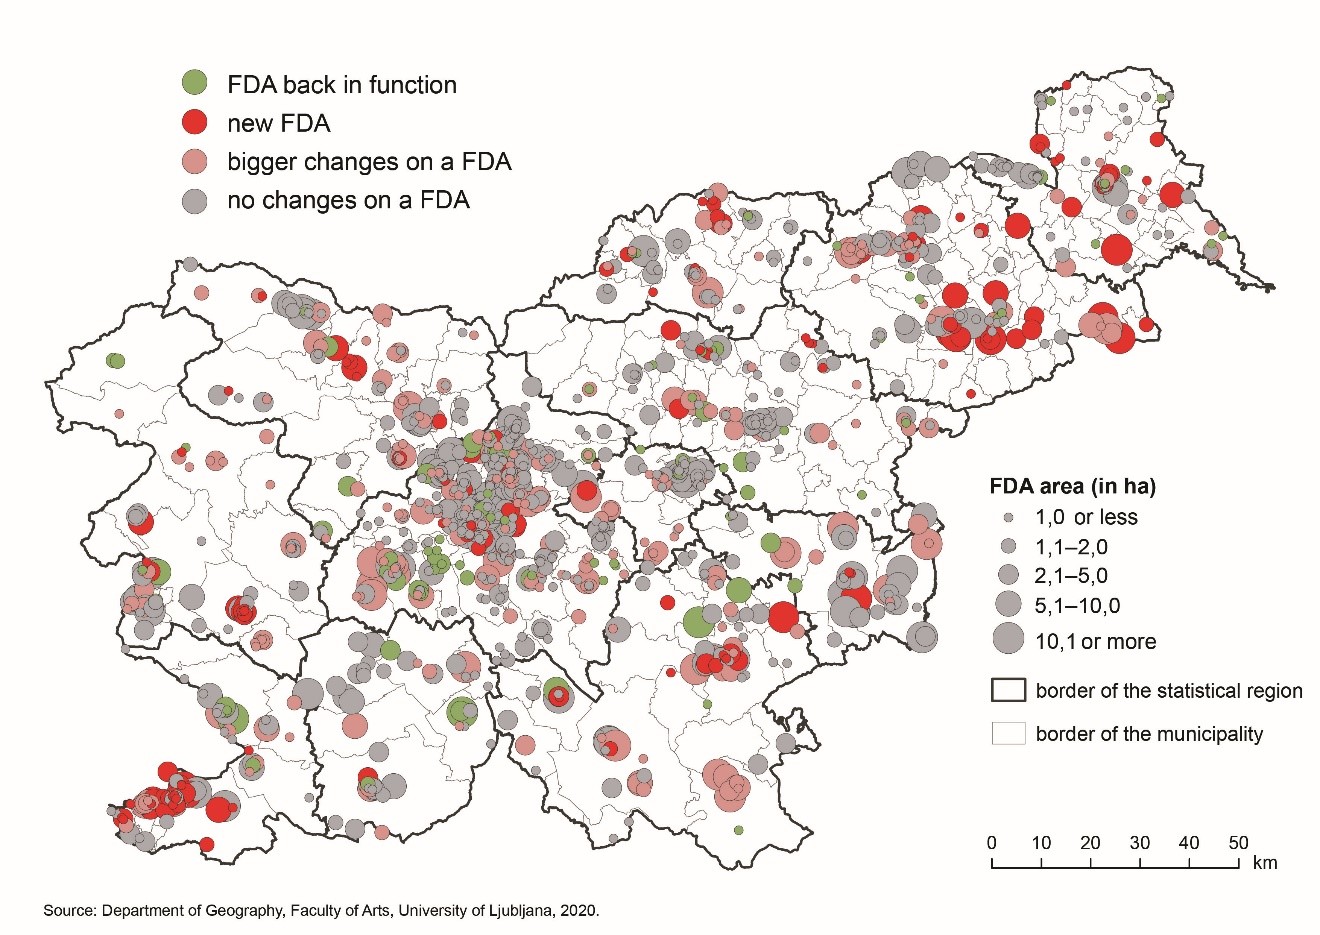
[TP02] Functionally degraded areas

Key message

In 2020, Slovenia recorded a slight increase in the number and total area of functionally depreciated areas (FDAs): 1,132 FDAs were recorded in the total area of 3,695.3 ha. Compared to 2017, their number increased by 51, with a total area of 272.5 ha.
We can notice positive trends towards the revitalization of FDAs, as new activity has taken off on 108 locations, on the 292 FDAs there have been major changes in recent years, where many remediation and renewal processes began, while else ware the physical condition and degradation of the area has deteriorated.
There is a lack of a systematic approach to environmental remediation and renovation, especially of those FDAs where old environmental burdens are present, as well as the establishment of a spatial development system that will tend to “no net land take” of agricultural and forest land.
Charts
| No changes[%] | Bigger changes on a FDA[%] | FDA back in function[%] | New FDA[%] | |
|---|---|---|---|---|
| 2017-2020 | 55 | 23 | 9 | 13 |
| 2020[number] | 2017[number] | |
|---|---|---|
| FDA of industrial and craft activities (IND) | 216 | 237 |
| FDA of infrastructures (INF) | 160 | 133 |
| FDA of agricultural activities (AGR) | 83 | 77 |
| FDA of defence, protection and rescue services (DEF) | 37 | 35 |
| FDA of transitional use (TRANS) | 123 | 112 |
| FDA of mineral extraction (MIN) | 181 | 170 |
| FDA of service activities (SERV) | 179 | 162 |
| FDA of tourist, sports and recreation activities (TOUR) | 64 | 60 |
| FDA for housing (HOU) | 89 | 95 |
| 2020[ha] | 2017[ha] | |
|---|---|---|
| FDA of industrial and craft activities (IND) | 1125.82 | 1196.94 |
| FDA of infrastructures (INF) | 465.44 | 418.39 |
| FDA of agricultural activities (AGR) | 234.39 | 202.33 |
| FDA of defence, protection and rescue services (DEF) | 170.34 | 152.11 |
| FDA of transitional use (TRANS) | 285.07 | 267.76 |
| FDA of mineral extraction (MIN) | 810.76 | 649.90 |
| FDA of service activities (SERV) | 356.35 | 324.34 |
| FDA of tourist, sports and recreation activities (TOUR) | 131.65 | 102.17 |
| FDA for housing (HOU) | 115.45 | 108.79 |
| 2020[ha] | 2017[ha] | |
|---|---|---|
| public | 464.86 | 465.33 |
| mixed ownership | 1737.27 | 988.66 |
| private | 1455.34 | 1641.64 |
| unknown | 37.80 | 327.10 |
| 2020[ha] | 2017[ha] | |
|---|---|---|
| partially abandoned | 1074.71 | 900.39 |
| moderately abandoned | 1492.14 | 1373.76 |
| completely abandoned | 1128.42 | 1148.60 |
| there are no real plans and options for change[number] | we have plans and ideas, the realization has not yet been defined[number] | we already have an area plan in place for an area[number] | |
|---|---|---|---|
| Goriška | 23 | 39 | 7 |
| Jugovzhodna Slovenija | 42 | 24 | 18 |
| Koroška | 22 | 24 | 8 |
| Obalno-kraška | 21 | 35 | 25 |
| Osrednjeslovenska | 193 | 106 | 64 |
| Podravska | 56 | 31 | 14 |
| Pomurska | 47 | 18 | 10 |
| Posavska | 21 | 9 | 11 |
| Primorsko-notranjska | 13 | 14 | 12 |
| Savinjska | 36 | 35 | 20 |
| Zasavska | 28 | 22 | 4 |
| 1.0 or less[number] | 1.1–2.0[number] | 2.1–5.0[number] | 5.1–10.0[number] | 10.1 or more[number] | |
|---|---|---|---|---|---|
| New FDA | 64 | 31 | 40 | 15 | 9 |
| Bigger changes on a FDA | 132 | 67 | 45 | 25 | 23 |
| No changes on a FDA | 326 | 125 | 136 | 54 | 40 |


