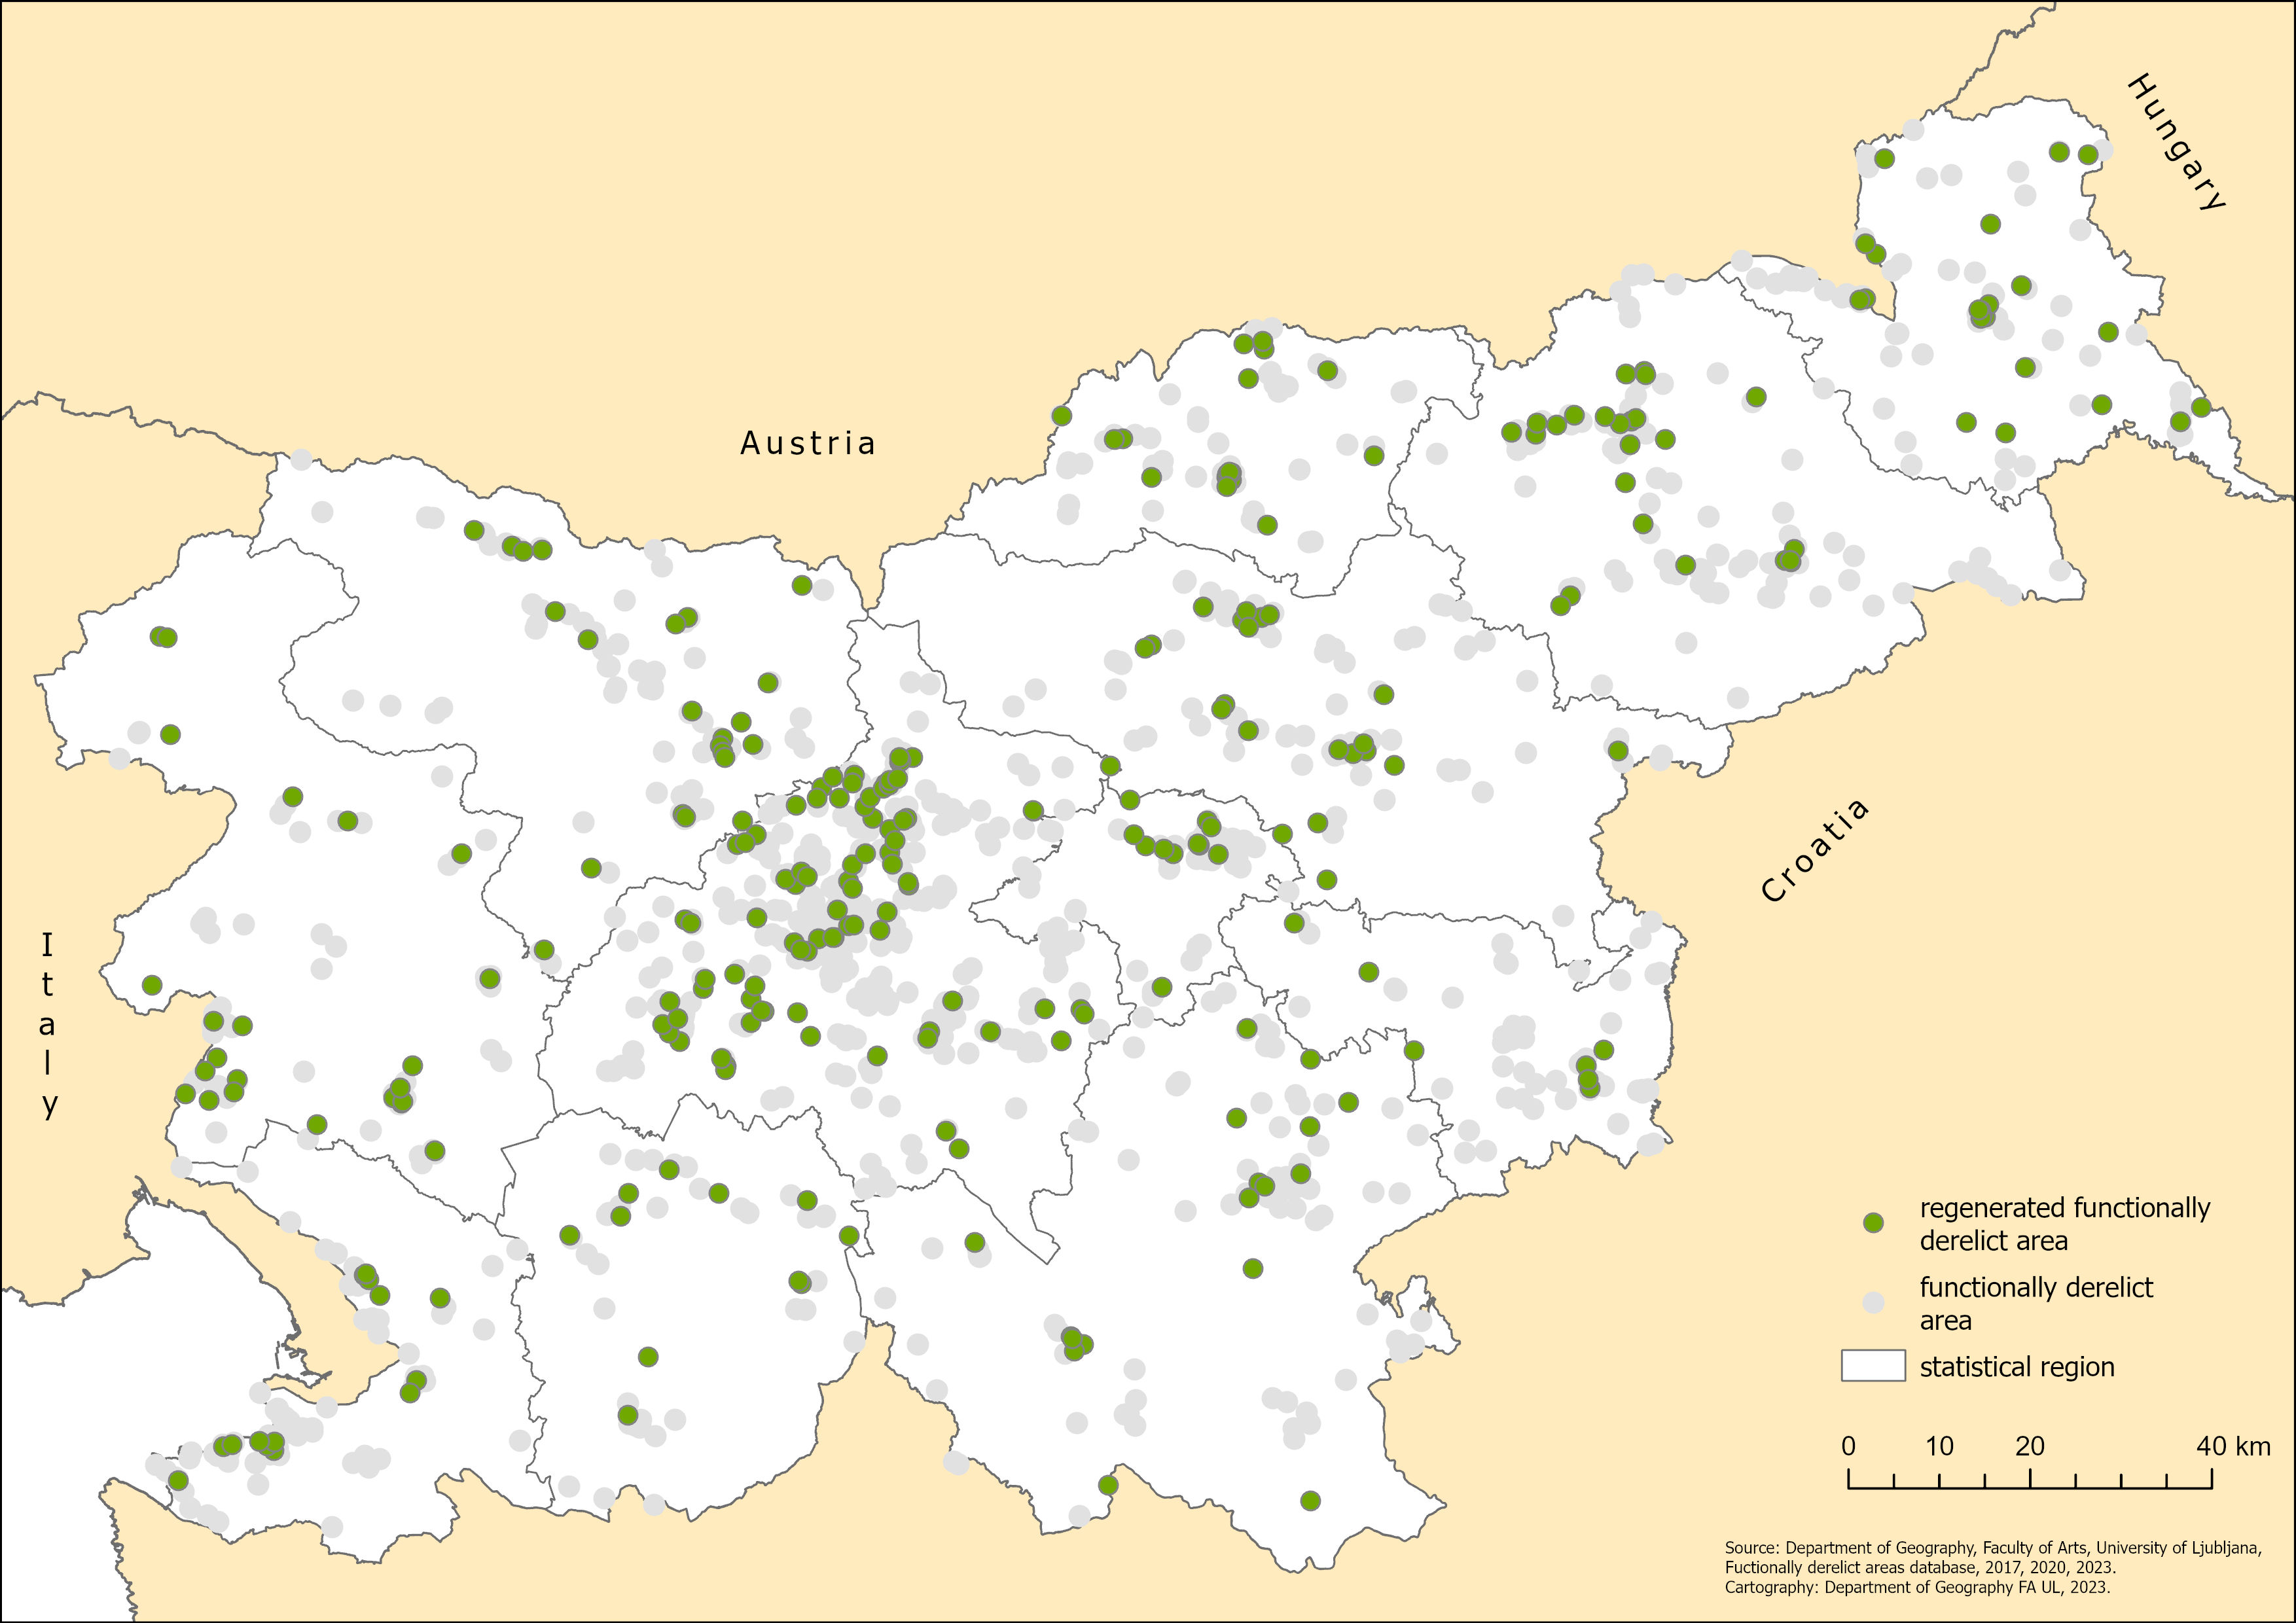
[TP02] Functionally degraded areas

Key message

In 2023, Slovenia recorded a decrease in the number and total area of functionally derelict areas (FDAs): 1070 FDAs were registered with a total area of 3225.44 ha. This brings the situation closer to that of 2017, with a decrease of 62 in the number of FDAs and 469.83 ha in total area, compared to 2020.
A positive trend can be observed in the regeneration of the sites, with 279 FDAs being regenerated between 2017 and 2023. Intensive processes of site regeneration, construction, and restoration are underway at many sites, and new activity is expected to become established within a period of up to 2 years. Despite the positive trends, piecemeal activity can be observed; planned activity is often not aligned with previous activity or is not based on actual needs, so the regeneration does not contribute sufficiently to the protection of agricultural and forest land.
Charts
Department of Geography, Faculty of Arts, University of Ljubljana, Fuctionally derelict areas database (2023)
| No changes[%] | Bigger changes on a FDA[%] | FDA back in function[%] | New FDA[%] | |
|---|---|---|---|---|
| 2020-2023 | 719 | 284 | 149 | 67 |
Oddelek za geografijo, Filozofska fakulteta Univerze Ljubljani, Evidenca funkcionalno razvrednotenih območij, 2023
| 2017[number] | 2020[number] | 2023[number] | |
|---|---|---|---|
| FDA of industry, craft and storage (IND) | 237 | 216 | 181 |
| FDA of infrastructures (INF) | 133 | 160 | 148 |
| FDA of agricultural activities (AGR) | 77 | 83 | 80 |
| FDA of defence, protection and rescue services (DEF) | 35 | 37 | 33 |
| FDA of transitional use (TRANS) | 112 | 123 | 154 |
| FDA of mineral extraction and exploitation (MIN) | 170 | 181 | 182 |
| FDA of trade and services (SERV) | 162 | 179 | 147 |
| FDA of tourism, hospitality, sport and recreation (TOUR) | 60 | 64 | 75 |
| FDA for housing (HOU) | 95 | 89 | 70 |
Department of Geography, Faculty of Arts, University of Ljubljana, Fuctionally derelict areas database ()
| 2017[ha] | 2020[ha] | 2023[ha] | |
|---|---|---|---|
| FDA of industry, craft and storage (IND) | 1196.94 | 1125.82 | 893.02 |
| FDA of infrastructures (INF) | 418.39 | 465.44 | 463.48 |
| FDA of agricultural activities (AGR) | 202.33 | 234.39 | 226.95 |
| FDA of defence, protection and rescue services (DEF) | 152.11 | 170.34 | 154.12 |
| FDA of transitional use (TRANS) | 267.76 | 285.07 | 285.60 |
| FDA of mineral extraction and exploitation (MIN) | 649.90 | 810.76 | 773.32 |
| FDA of trade and services (SERV) | 324.34 | 356.35 | 213.13 |
| FDA of tourism, hospitality, sport and recreation (TOUR) | 102.17 | 131.65 | 130.81 |
| FDA for housing (HOU) | 108.79 | 115.45 | 85.01 |
Department of Geography, Faculty of Arts, University of Ljubljana, Fuctionally derelict areas database ()
| 2017[ha] | 2020[ha] | 2023[ha] | |
|---|---|---|---|
| public | 465.33 | 464.86 | 506.07 |
| mixed ownership | 988.66 | 1737.27 | 1300.77 |
| private | 1641.64 | 1455.34 | 1417.78 |
| unknown | 327.10 | 37.80 | 0.82 |
Department of Geography, Faculty of Arts, University of Ljubljana, Fuctionally derelict areas database ()
| 2017[ha] | 2020[ha] | 2023[ha] | |
|---|---|---|---|
| partially abandoned | 900.39 | 1074.71 | 961 |
| moderately abandoned | 1373.76 | 1492.14 | 1250.24 |
| completely abandoned | 1148.60 | 1128.42 | 1014.20 |
Department of Geography, Faculty of Arts, University of Ljubljana, Fuctionally derelict areas database ()
| we already have an area plan in place for an area[number] | we have plans and ideas, the realization has not yet been defined[number] | there are no real plans and options for change[number] | |
|---|---|---|---|
| Goriška | 10 | 17 | 35 |
| Jugovzhodna Slovenija | 12 | 22 | 48 |
| Koroška | 16 | 6 | 32 |
| Obalno-kraška | 10 | 31 | 41 |
| Osrednjeslovenska | 64 | 75 | 186 |
| Podravska | 5 | 32 | 57 |
| Pomurska | 10 | 22 | 40 |
| Posavska | 6 | 9 | 39 |
| Primorsko-notranjska | 7 | 7 | 25 |
| Savinjska | 12 | 25 | 50 |
| Zasavska | 9 | 7 | 30 |
Department of Geography, Faculty of Arts, University of Ljubljana, Fuctionally derelict areas database, 2023
| FDA is back in function[number] | |
|---|---|
| Goriška | 24 |
| Jugovzhodna Slovenija | 18 |
| Koroška | 20 |
| Obalno-kraška | 14 |
| Osrednjeslovenska | 84 |
| Podravska | 24 |
| Pomurska | 23 |
| Posavska | 6 |
| Primorsko-notranjska | 11 |
| Savinjska | 22 |
| Zasavska | 11 |


