[TP02] Functionally degraded areas

Key message

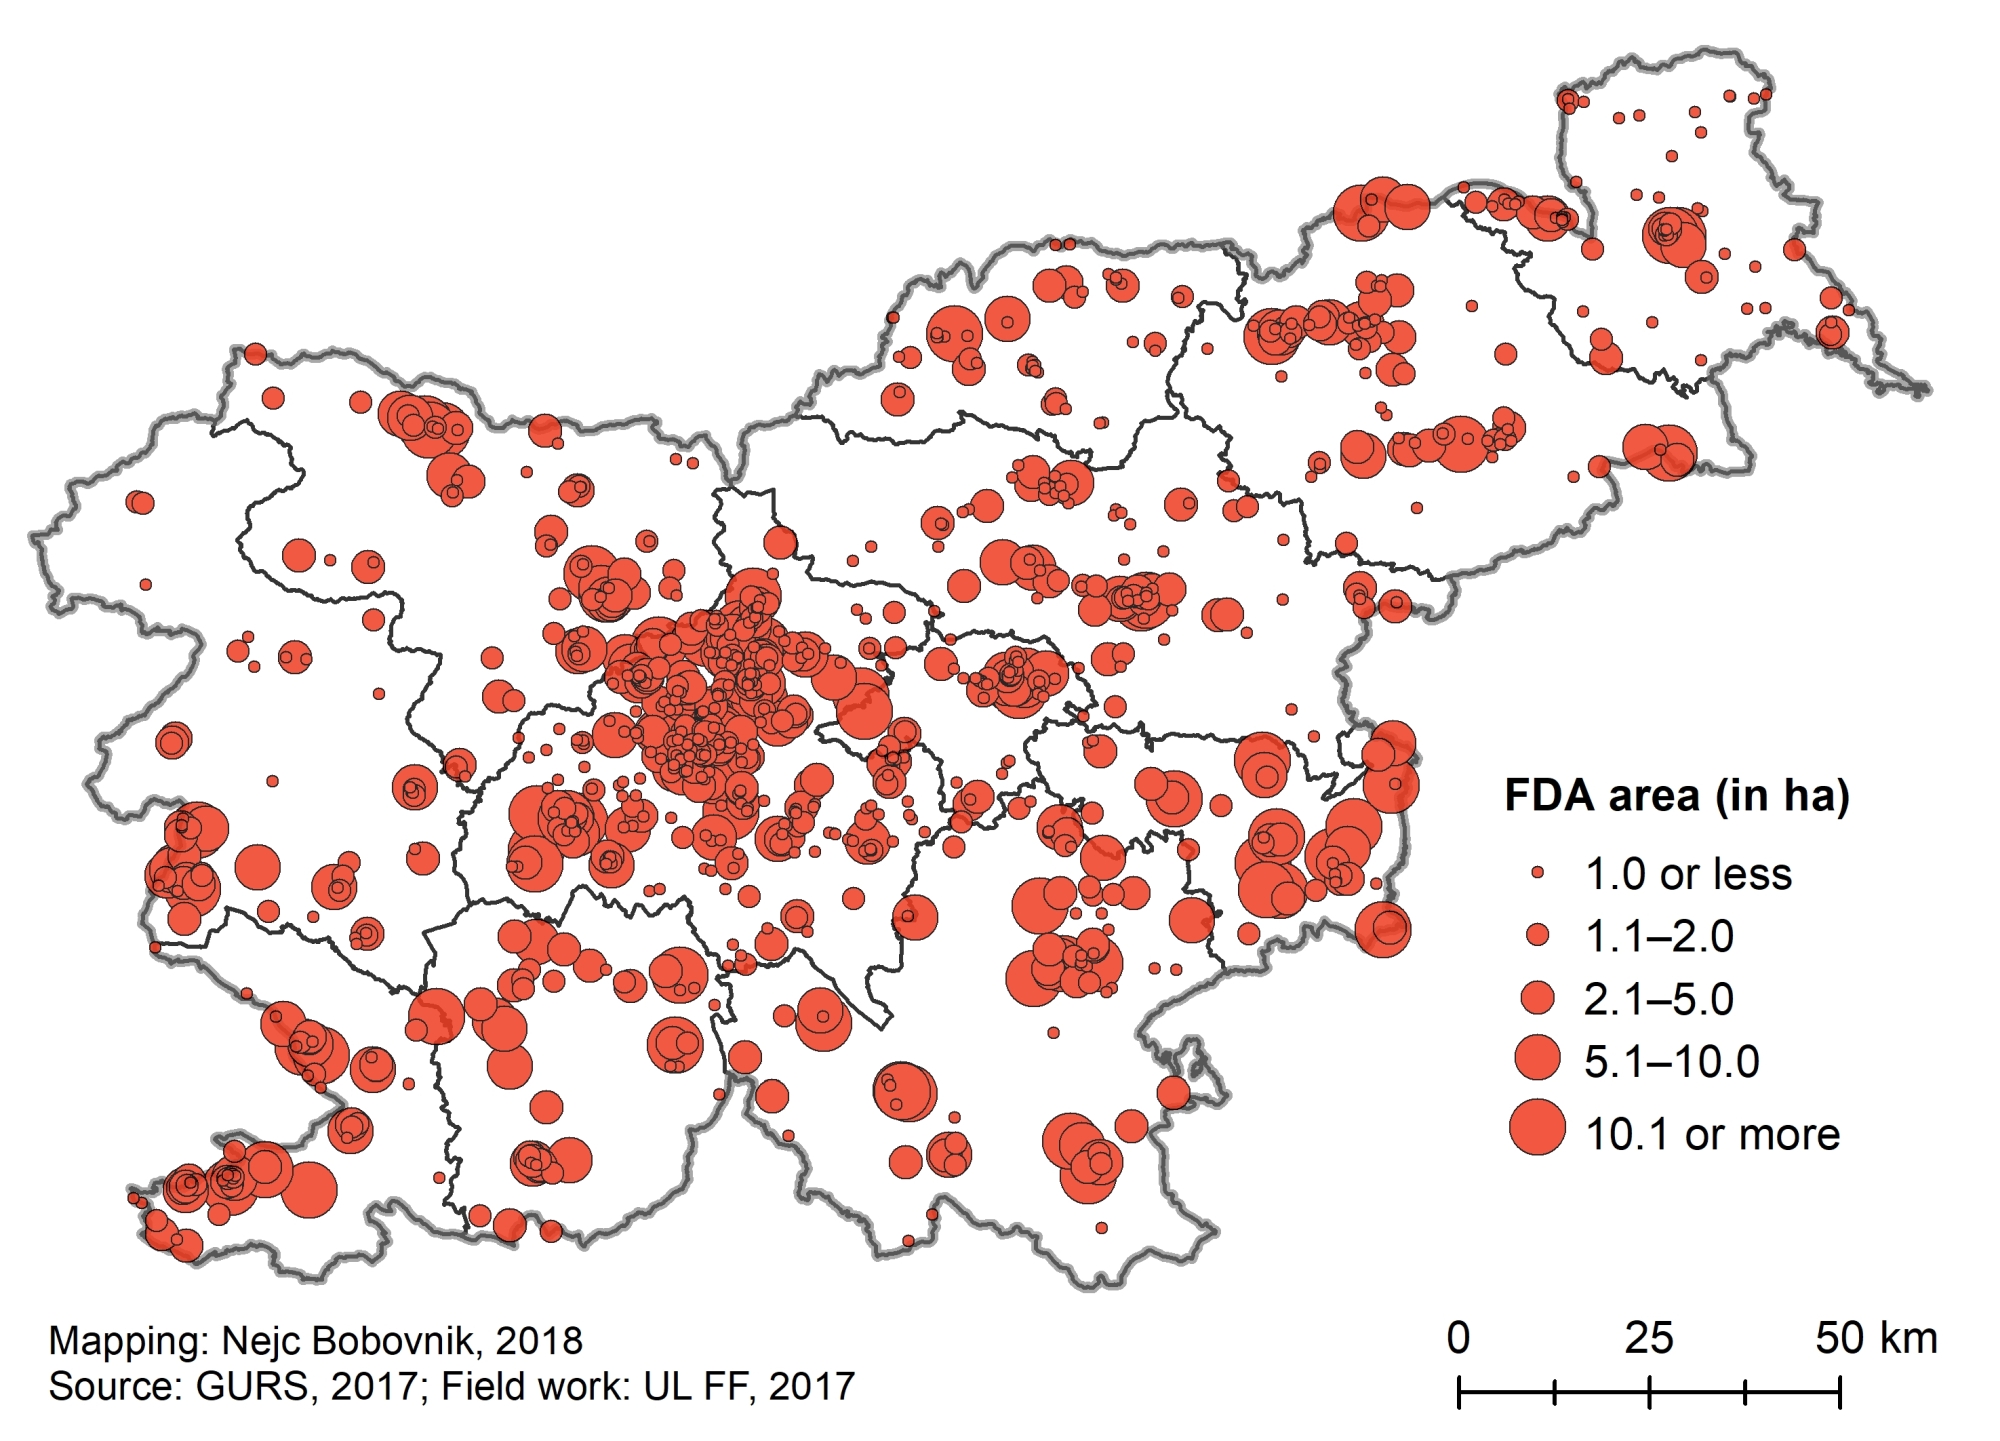
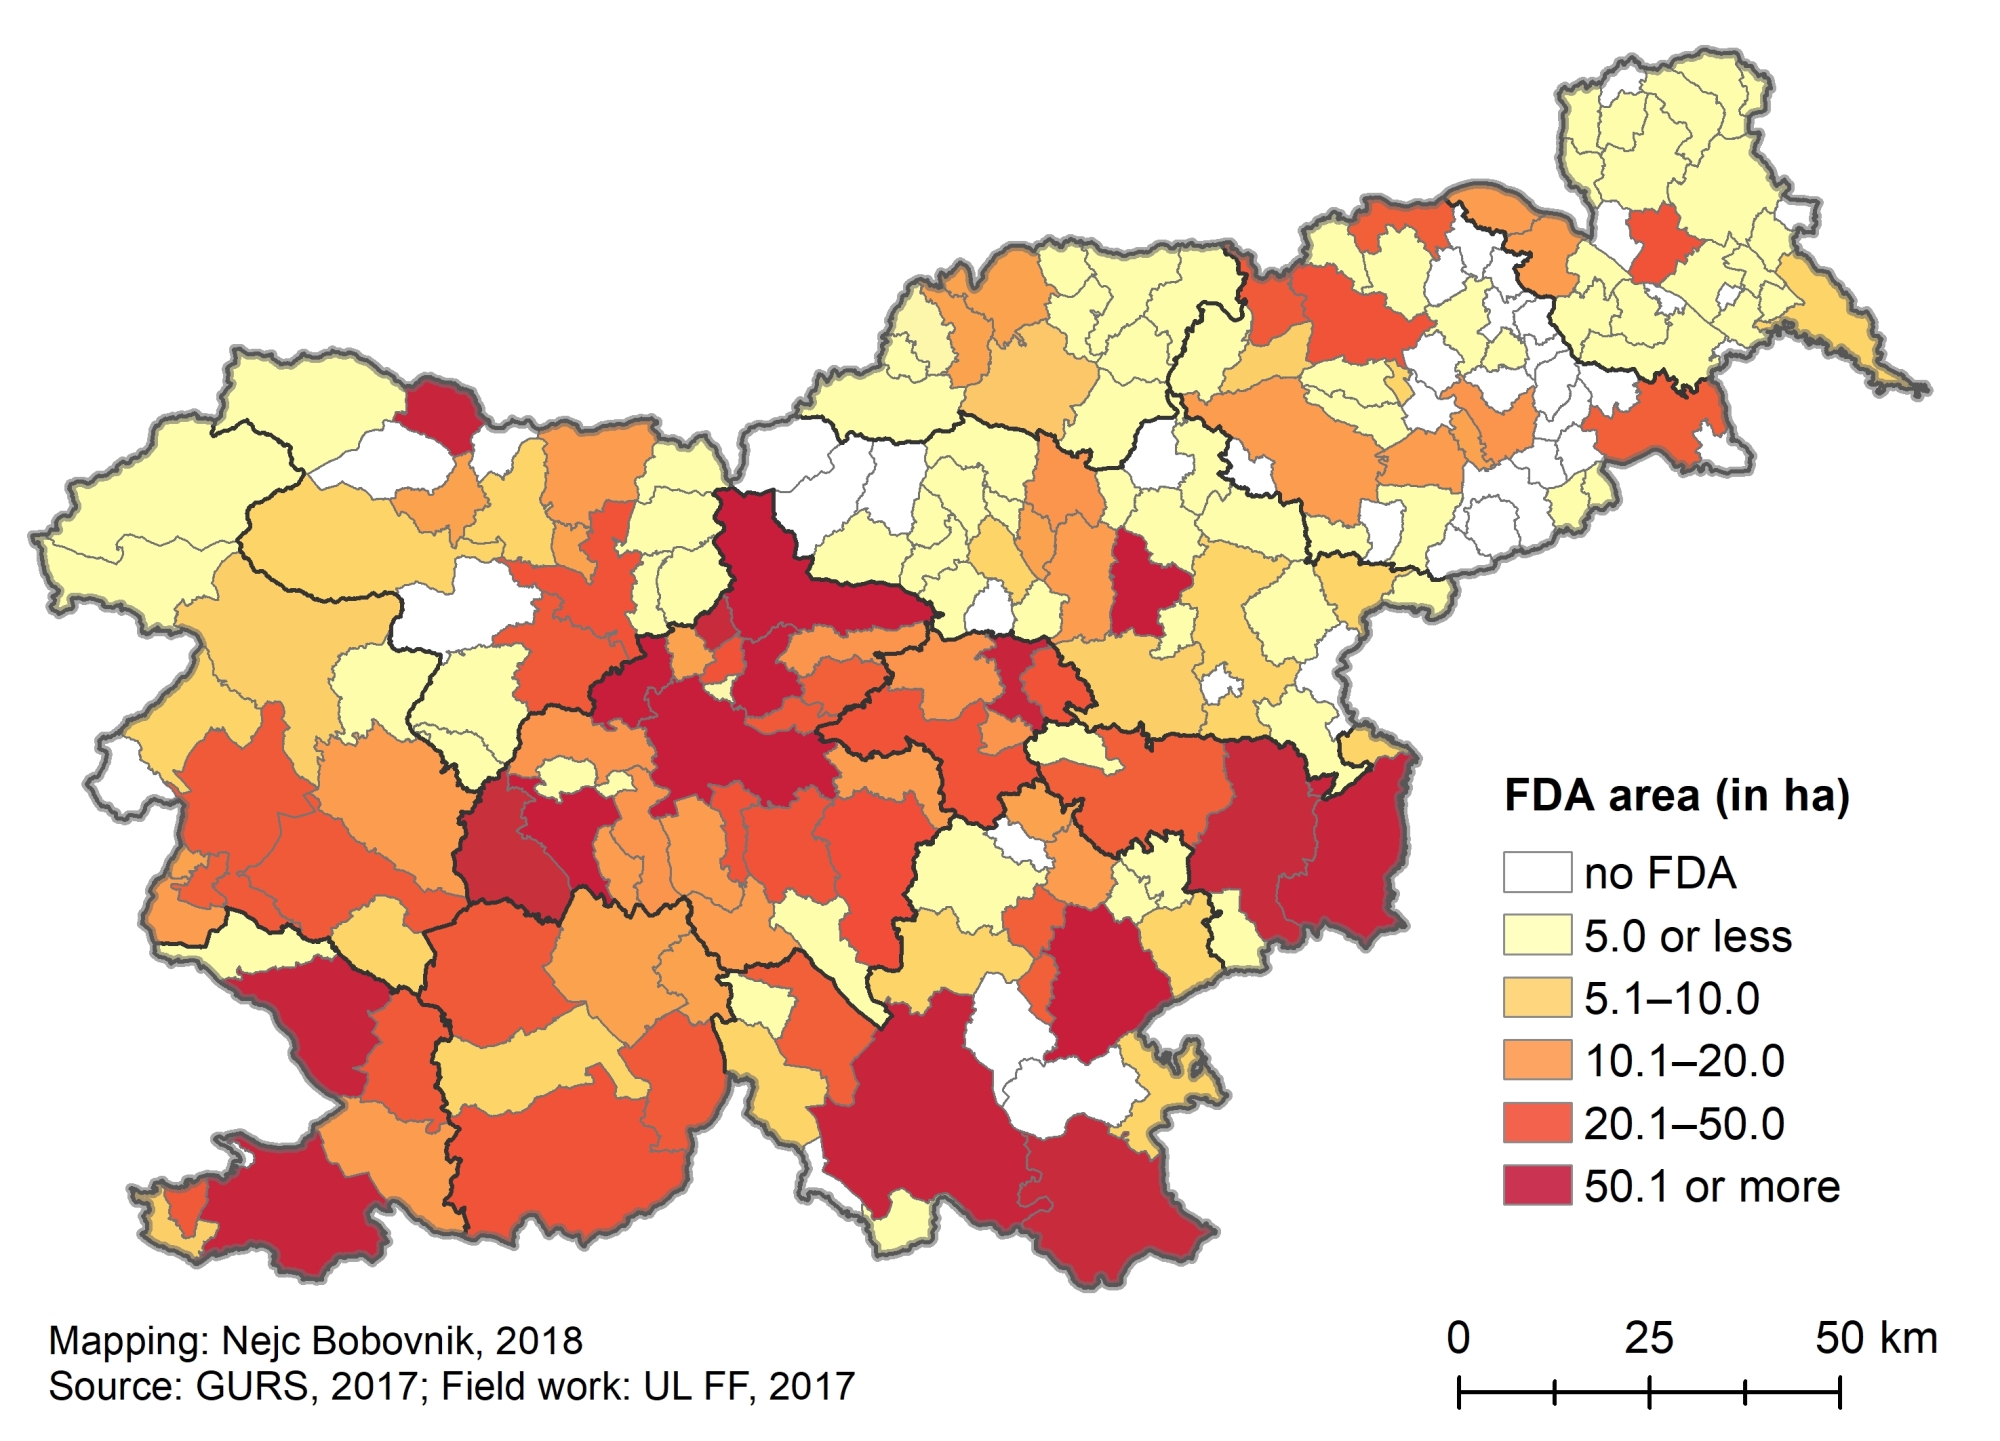
In 2017, we recorded 1,081 functionally degraded areas (FDAs) in Slovenia in a total area of 3422.7ha, with a prevalence of areas of industrial and craft activities. The average size of an individual FDA was 3.2 ha.
In addition to the goal of preventing the emergence of new FDAs and reducing the extent of degraded areas, their environmental remediation and renewal remains the key goal, and in the long-term the establishment of a spatial development system that will aim to “no net land take” (zero-sealing of agricultural and forest land).
Charts
Department of Geography, Faculty of Art, University of Ljubljana, Degraded aread database, 2017
| Number | |
|---|---|
| FDA of industrial and craft activities (IND) | 237 |
| FDA of infrastructures (INF) | 133 |
| FDA of agricultural activities (AGR) | 77 |
| FDA of defence, protection and rescue services (DEF) | 35 |
| FDA of transitional use (TRANS) | 112 |
| FDA of mineral extraction (MIN) | 170 |
| FDA of service activities (SERV) | 162 |
| FDA of tourist, sports and recreation activities (TOUR) | 60 |
| FDA for housing (HOU) | 95 |
Department of Geography, Faculty of Art, University of Ljubljana, Degraded aread database, 2017
| Area (ha) | |
|---|---|
| FDA of industrial and craft activities (IND) | 1196.94 |
| FDA of infrastructures (INF) | 418.39 |
| FDA of agricultural activities (AGR) | 202.33 |
| FDA of defence, protection and rescue services (DEF) | 152.11 |
| FDA of transitional use (TRANS) | 267.76 |
| FDA of mineral extraction (MIN) | 649.90 |
| FDA of service activities (SERV) | 324.34 |
| FDA of tourist, sports and recreation activities (TOUR) | 102.17 |
| FDA for housing (HOU) | 108.79 |
Department of Geography, Faculty of Art, University of Ljubljana, Degraded aread database, 2017
| Area (ha) | Number | |
|---|---|---|
| public | 465.33 | 154 |
| mixed | 988.66 | 232 |
| private | 1641.64 | 572 |
| unknown | 327.10 | 123 |
Department of Geography, Faculty of Art, University of Ljubljana, Degraded aread database, 2017
| Area (ha) | Number | |
|---|---|---|
| non-abandoned | 9.51 | 7 |
| partially abandoned | 890.88 | 192 |
| moderately abandoned | 1373.76 | 347 |
| completely abandoned | 1148.60 | 535 |
Department of Geography, Faculty of Art, University of Ljubljana, Degraded aread database, 2017
| Area of FDA (ha) | 2017 | 2011 |
|---|---|---|
| 1.0 or less | 504 | 29 |
| 1.1-2.0 | 225 | 29 |
| 2.1-5.0 | 203 | 51 |
| 5.1-10.0 | 84 | 39 |
| 10.1 or more | 65 | 46 |
Department of Geography, Faculty of Art, University of Ljubljana, Degraded aread database, 2017
| Total area of FDA by municipalities (ha) | 2017 |
|---|---|
| without | 42 |
| 5,0 or less | 75 |
| 5,1-10,0 | 20 |
| 10,1-20,0 | 31 |
| 20,1-50,0 | 27 |
| 50,1 or more | 17 |


