[GZ01] Forest decline and tree defoliation

Key message

The health condition of forests in Slovenia has been relatively stable in recent years, despite slight negative trends. In 2014, individual areas in Slovenia were affected by severe icing and later by, Bark beetles which is also reflected in the data collected at the national level. Among the most damaged tree species are spruce, oaks, fir, ash and home-grown chestnut. According to recent findings, annual fluctuations in estimates are primarily a combination of the consequences of changing weather conditions between years and other biotic and abiotic stressors.
Charts
Source: Slovenian Forestry Institute, 2017
| coniferous [%] | deciduous [%] | total [%] | |
|---|---|---|---|
| 1991 | 22.14 | 12.95 | 16.56 |
| 1993 | 22.46 | 15.68 | 19.59 |
| 1994 | 18.53 | 16.30 | 18.29 |
| 1995 | 26.86 | 18.07 | 21.42 |
| 1996 | 22.80 | 15.95 | 18.69 |
| 1997 | 24.69 | 20.49 | 22.21 |
| 1998 | 27.37 | 20.49 | 23.49 |
| 1999 | 28.65 | 21.87 | 25.62 |
| 2000 | 24.32 | 18.15 | 20.56 |
| 2001 | 25.90 | 21.46 | 24.62 |
| 2002 | 26.11 | 20.78 | 24.16 |
| 2003 | 25.13 | 20.75 | 23.56 |
| 2004 | 24.98 | 20.93 | 23.27 |
| 2005 | 24.99 | 22.21 | 23.47 |
| 2006 | 24.60 | 22.60 | 23.30 |
| 2007 | 24.56 | 25.87 | 25.37 |
| 2008 | 26.02 | 25.42 | 25.65 |
| 2009 | 26.36 | 25.86 | 26.05 |
| 2010 | 25.13 | 24.48 | 24.71 |
| 2011 | 25.95 | 23.81 | 25.45 |
| 2012 | 25.78 | 23.36 | 24.91 |
| 2013 | 26.14 | 24.46 | 25.87 |
| 2014 | 27.72 | 27.14 | 28.21 |
| 2015 | 29.69 | 26.30 | 28.08 |
| 2016 | 28.52 | 25.71 | 26.70 |
Slovenian Forestry Institute, 2017
| coniferous [%] | deciduous [%] | total [%] | |
|---|---|---|---|
| 1991 | 26.40 | 9.35 | 15.57 |
| 1993 | 25.28 | 12.45 | 18.87 |
| 1994 | 16.35 | 13.00 | 15.69 |
| 1995 | 37.75 | 17.63 | 24.71 |
| 1996 | 27.52 | 12.62 | 18.94 |
| 1997 | 31.06 | 20.34 | 27.03 |
| 1998 | 38.87 | 21.72 | 28.81 |
| 1999 | 41.97 | 22.77 | 30.62 |
| 2000 | 30.32 | 16.86 | 22.28 |
| 2001 | 36.11 | 24.53 | 30.41 |
| 2002 | 41.49 | 24.36 | 30.85 |
| 2003 | 36.73 | 23.76 | 29.27 |
| 2004 | 40.51 | 23.67 | 29.27 |
| 2005 | 35.08 | 28.49 | 30.59 |
| 2006 | 32.20 | 27.80 | 29.40 |
| 2007 | 36.60 | 35.70 | 35.70 |
| 2008 | 40.74 | 34.56 | 36.90 |
| 2009 | 39.07 | 32.78 | 35.42 |
| 2010 | 42.79 | 23.23 | 31.72 |
| 2011 | 37.87 | 27.62 | 31.40 |
| 2012 | 37.03 | 23.01 | 29.04 |
| 2013 | 34.31 | 28.47 | 30.87 |
| 2014 | 39.95 | 34.90 | 38.29 |
| 2015 | 44.33 | 32.75 | 37.81 |
| 2016 | 41.89 | 31.31 | 33.81 |
Slovenian Forestry Institute, 2017
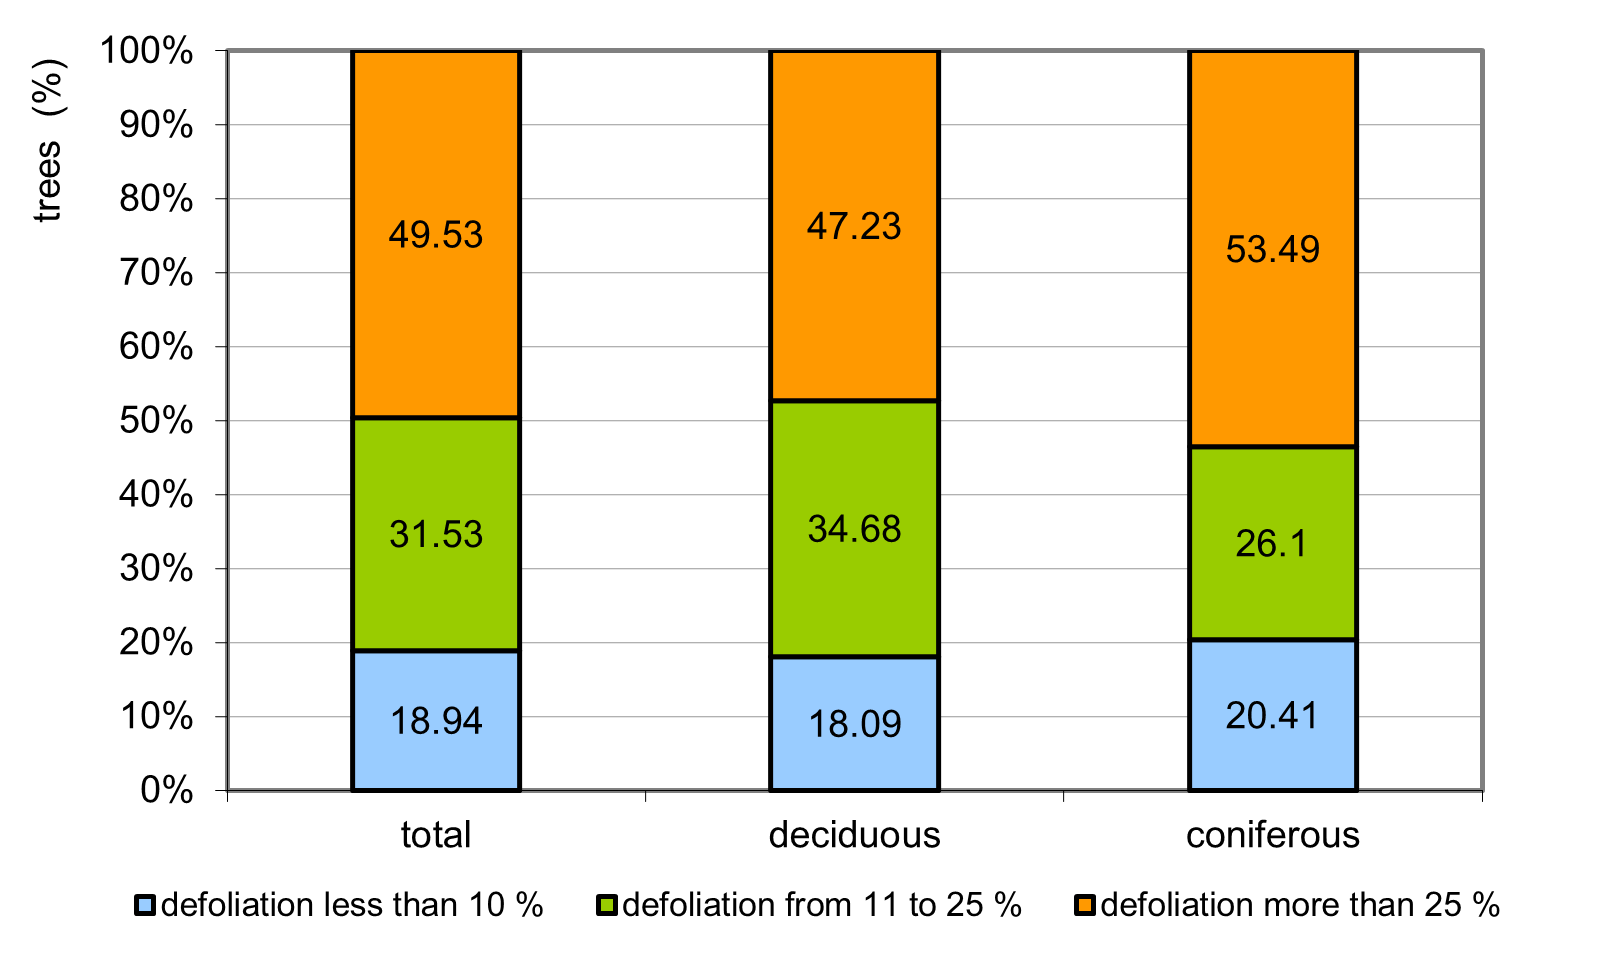
|
|
|
skupaj |
listavci |
iglavci |
|---|---|---|---|---|
|
osutost manj kot 10 % |
% drevja |
18.94 |
18.09 |
20.41 |
|
osutost od 11 do 25 % |
% drevja |
31.53 |
34.68 |
26.10 |
|
osutost več kot 25 % |
% drevja |
49.53 |
47.23 |
53.49 |


