[GZ01] Forest decline and tree defoliation

Key message

The health of forests has been relatively stable in the last years and is comparable to other Central European countries. Based on the new findings, the annual fluctuation of estimates is a consequence of the changing weather conditions between individual years.
Definition
The basic indicator of the health condition of trees, stands and forests is tree defoliation. It is a visually estimated percentage of missing assimilation tree organs in comparison with normal foliage level in a tree belonging to the same species and same social status and growing in the same site. The assessment of the indicator is rounded to the nearest 5%.
A tree is considered as damaged when its defoliation degree exceeds 25%.
The indicator is contained in the material of MCPFE 2003 (Ministerial Conference on the Protection of the Forests in Europe) under Criterion 2 (Maintenance of Forest Ecosystem Health and Vitality). A proposal has also been made to include it among the FAO/TBFRA indicators.
Charts
Slovenian Forestry Institute, 2008
| 1991 | 1993 | 1994 | 1995 | 1996 | 1997 | 1998 | 1999 | 2000 | 2001 | ||
|---|---|---|---|---|---|---|---|---|---|---|---|
| coniferous | % | 26 | 25 | 16 | 38 | 28 | 31 | 39 | 42 | 30 | 36 |
| deciduous | % | 9 | 13 | 13 | 18 | 13 | 20 | 22 | 23 | 17 | 25 |
| total | % | 16 | 19 | 16 | 25 | 19 | 27 | 29 | 31 | 22 | 30 |
| 2002 | 2003 | 2004 | 2005 | 2006 | 2007 | ||||||
| coniferous | % | 41 | 37 | 41 | 35 | 32 | 37 | ||||
| deciduous | % | 24 | 24 | 24 | 28 | 28 | 36 | ||||
| total | % | 31 | 29 | 29 | 31 | 29 | 36 |
Slovenian Forestry Institute, 2008
| total | deciduous | coniferous | ||
|---|---|---|---|---|
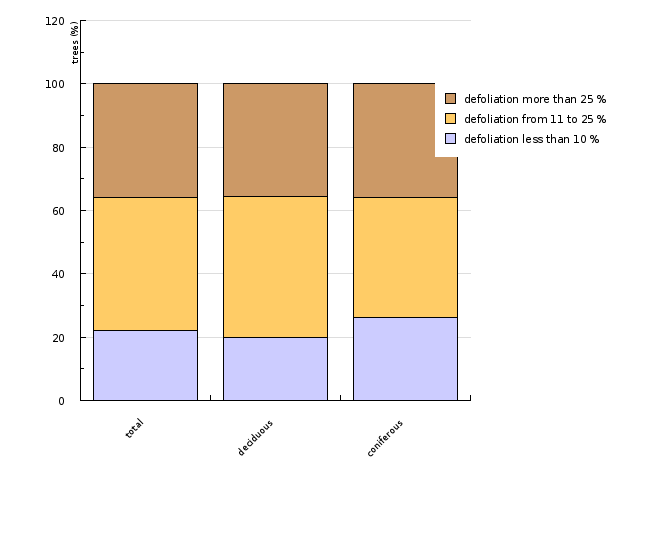
| defoliation less than 10 % | % of trees | 22 | 20 | 26 |
| defoliation from 11 to 25 % | % of trees | 42 | 45 | 38 |
| defoliation more than 25 % | % of trees | 36 | 36 | 36 |
Goals
To preserve healthy forests that can permanently and optimally function as an ecosystem and perform ecological, social and productive functions.
Comment
The Resolution on the National Environment Protection Programme envisages monitoring of the condition and evaluating the decline of forests.
The data presented in the timeline were collected on sample plots arranged in a 16 x 16 km grid (in 1995 and 2000 data were acquired from a 4 x 4 km grid). The timeline of the entire period shows that in the period 1985-2000, the condition of forests was deteriorating, but from 2000 onwards, it has remained relatively stable. Despite the rise of the value of health indicators in 2007, this should not yet be considered a negative trend.
In the last years, the average defoliation of deciduous trees has been deteriorating and the defoliation of coniferous trees has remained stagnant. Greater variation can be seen in the shares of damaged coniferous and deciduous trees, the latter being of greater concern, since the number of damaged deciduous trees has been on the rise in the last years. Among the most damaged tree species are fir and oak. The state of forests in Slovenia is comparable to that reported by nearby Central European countries.
Methodology
How was the indicator measured?
The defoliation assessment process is carried out in two stages. In the first stage, the sample trees are determined based on the statistical selection protocol, and in the second stage, each selected tree is evaluated in terms of defoliation. The indicator is a visually estimated share expressed in the percentage of missing assimilation tree organs (leaves, needles) in comparison with normal foliage level in a tree belonging to the same species and same social status and growing in the same site. The assessment of the indicator is rounded to the nearest 5%.
Data for Slovenia:
• Large-scale inventory of forests and forest ecosystems, Slovenian Forestry Institute.
• Description of the data source:
Methodology: random systematic cluster sampling
Frequency: every year on a 16 x 16 km grid, periodically on a 4 x 4 km grid.
Data manipulation: original data – individual values are calculated to sample units and units of account (=Slovenia)
Quality: subjective, but the only internationally acknowledged and comparable indicator
Reliability: subject to bias because of the constancy of sample plots (avoidance of some plots), but simple. The indicator demands assessment skills that can be acquired annually at calibration courses.
Accuracy: because the indicator is measured based on random sampling, the accuracy may be specified in advance by determining the number of sample units.


