[PR14] Expenditures on personal mobility

Key message

The share of household expenditures on personal mobility has almost not been changing through time and is similar also in different social groups. In comparison with other European countries, a larger share of the household budget in Slovenia is used for transport; in the split of used resources, a larger share is used for the purchase and operation of vehicles, and a smaller share for public transport.
Definition
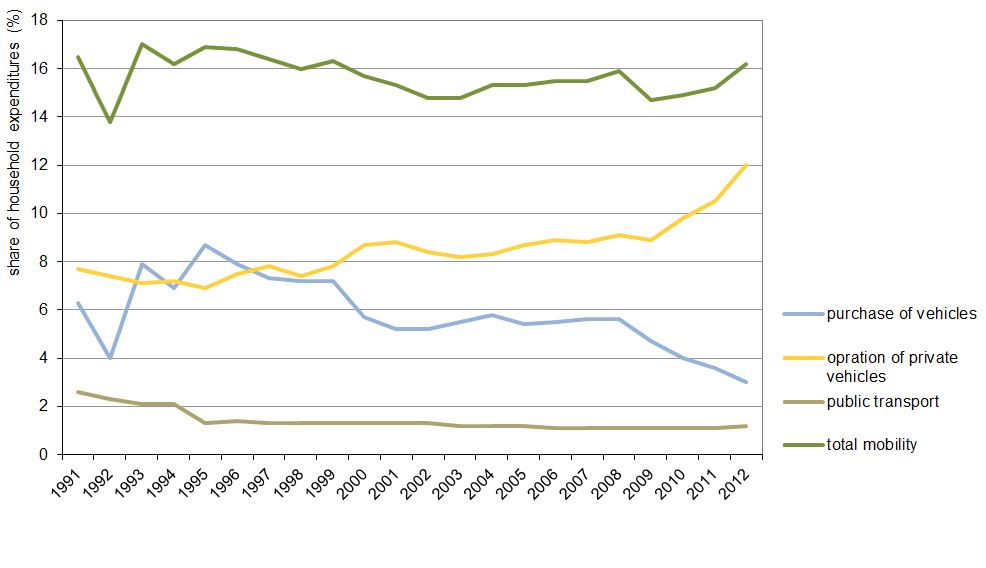
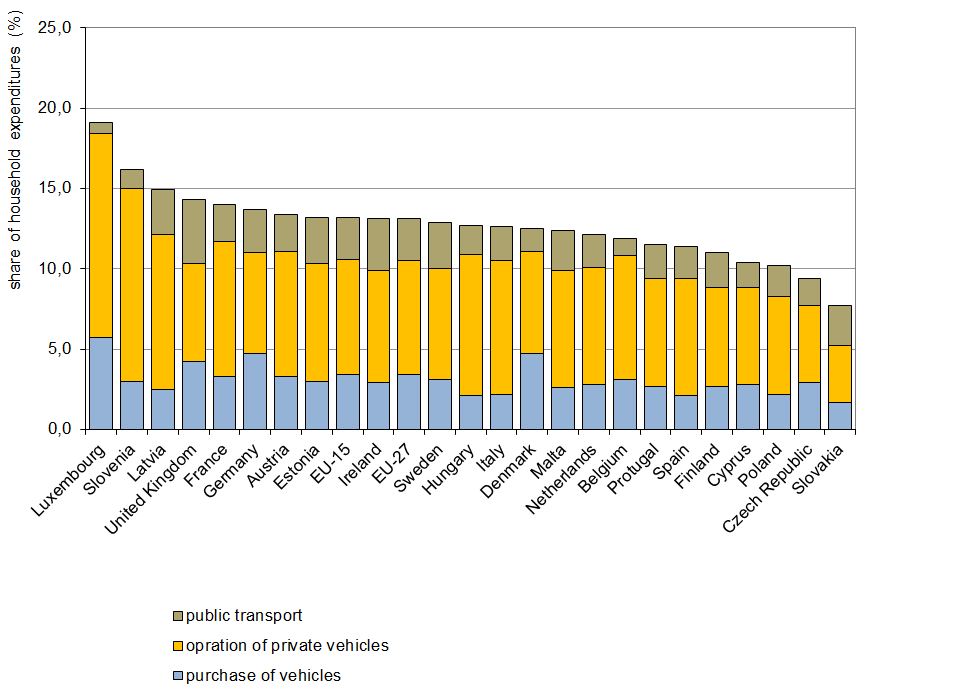
The indicator shows household expenditures on personal mobility, which also includes expenditures for car purchase, the operation of personal vehicles and public transport. The data for Slovenia includes the period 1991–2012, while the data for other European countries show the situation for 2012.
Charts
Eurostat, Final consumption expenditure of households by consumption purpose, 2014
| 1991 | 1992 | 1993 | 1994 | 1995 | 1996 | 1997 | 1998 | 1999 | 2000 | ||
|---|---|---|---|---|---|---|---|---|---|---|---|
| purchase of vehicles | % | 6.3 | 4 | 7.9 | 6.9 | 8.7 | 7.9 | 7.3 | 7.2 | 7.2 | 5.7 |
| opration of private vehicles | % | 7.7 | 7.4 | 7.1 | 7.2 | 6.9 | 7.5 | 7.8 | 7.4 | 7.8 | 8.7 |
| public transport | % | 2.6 | 2.3 | 2.1 | 2.1 | 1.3 | 1.4 | 1.3 | 1.3 | 1.3 | 1.3 |
| total mobility | % | 16.5 | 13.8 | 17 | 16.2 | 16.9 | 16.8 | 16.4 | 16 | 16.3 | 15.7 |
| 2001 | 2002 | 2003 | 2004 | 2005 | 2006 | 2007 | 2008 | 2009 | 2010 | ||
| purchase of vehicles | % | 5.2 | 5.2 | 5.5 | 5.8 | 5.4 | 5.5 | 5.6 | 5.6 | 4.7 | 4 |
| opration of private vehicles | % | 8.8 | 8.4 | 8.2 | 8.3 | 8.7 | 8.9 | 8.8 | 9.1 | 8.9 | 9.8 |
| public transport | % | 1.3 | 1.3 | 1.2 | 1.2 | 1.2 | 1.1 | 1.1 | 1.1 | 1.1 | 1.1 |
| total mobility | % | 15.3 | 14.8 | 14.8 | 15.3 | 15.3 | 15.5 | 15.5 | 15.9 | 14.7 | 14.9 |
| 2011 | 2012 | ||||||||||
| purchase of vehicles | % | 3.6 | 3 | ||||||||
| opration of private vehicles | % | 10.5 | 12 | ||||||||
| public transport | % | 1.1 | 1.2 | ||||||||
| total mobility | % | 15.2 | 16.2 |
Eurostat, Final consumption expenditure of households by consumption purpose, 2014.
Goals
At the EU level, there are no objectives set with regard to expenditures on personal mobility; in Slovenia there are also no set objectives in this area.
Comment
There is a close link between the income of households and individuals and their expenditures for personal mobility. In general people spend a relatively stable share of their income on mobility. Seeing this link, higher transport prices will lead to less transport and consequently reduced pressures on the environment. Conversely, price decreases will lead to an increased demand for transport and environmental pressures. Personal mobility expenditures provide a view of the transport demand, which is one of the most important driving forces in transport. The improved management of transport demand may through prices of transport services also lead to an improvement in the state of the environment.
Transport pricing may thus not only be a tool to reduce the environmental pressure of transport, but also an important tool for transport demand regulation. The internalisation of external costs, a Commission objective from the White Paper (European Commission, 2001), will make people pay for the transport costs generated. Initially, this will increase the costs for the user, as the costs of air pollution, climate change and accidents will have to be paid for. In the longer term, the effect on transport prices will be reduced since pricing policies will reduce the magnitude of external effects (EEA, 2005).
The data on the share of household expenditures on personal mobility shows constant value in the Republic of Slovenia in the last fifteen years. The average share of the budget intended for transport amounts to 16 % in this period. The majority of the budget is intended for the operation of personal vehicles (fuel, spare parts, repair, etc.) and purchase of vehicles; a significantly smaller share is intended for public transport. The share of expenditures on personal mobility is relatively stable also in other EU countries; the differences are not large even between individual countries. With regard to the share of household expenditures on personal mobility, Slovenia belongs to the countries with the highest share of used funds for this account. Only Luxembourg has been ranked ahead of Slovenia in 2012 according to this criterion. In 2012 Slovenian households spent 16,2 % of their budgets for transport; households of other EU-15 and EU-27 countries spent on average 13 % of their budgets for the same purpose. In comparison with other countries, Slovenian households spend, within the context of transport expenditures, more funds for the purchase of vehicles and operation of personal vehicles, and significantly less for the use of public transport. In 2012, Slovenian households spent one third (30 %) of their budgets for the purchase of vehicles and operation of personal vehicles (EU-27 countries 34%); at the same time, Slovenian households spent a significantly smaller share of their budgets (1.2 %) for public transport in comparison with the households in the EU-27 countries (2.6 %). However, the share of expenditures for public transport is in comparison with the expenditures for the purchase of vehicles and operation of personal vehicles in the EU-27 countries as well as in Slovenia at a minimum level.
The share of expenditures on personal mobility appears to increase with income, but the difference is largely due to greater spending on the purchase of vehicles. As wealthier people are more inclined to spend on vehicles as luxuries and status symbols, the greater share of mobility expenditures could therefore be better attributed to these factors. In resources intended for the operation of personal vehicles and public transport, the differences between income groups are significantly smaller. Consequently, the share of expenditures on personal mobility is roughly the same across income groups, although a certain link (especially in terms of higher transport demand, reflected in the larger share of transport work) does exist. For example, expenditures on personal mobility are much lower for households without a car, a situation more common in the lower income groups (EEA, 2011).
If the share of income allocated to personal mobility is constant for the different groups in society, increasing the transport prices (internalisation) becomes a useful tool for governments to influence transport volumes. However, it is also believed that people not only spend a roughly stable share of their budget on transport, but also a stable share of their time. As a consequence, travel speed also becomes an important determinant of transport demand, along with costs (EEA, 2011).
Another important consequence is that transport policy instruments that reduce the negative environmental impact of motor vehicles (for example, the introduction of more efficient fuels) while simultaneously reducing the transport users' costs will sooner or later create a rebound effect. With reduced expenditures on personal mobility, users will still use the shame share of their income and simply drive more. There is a possibility that the volume of transport and environmental pressures will not reduce (EEA, 2011).
Methodology
Data for Slovenia and other countries:
Objectives summarised by: /
Source database or source: Eurostat > Database by themes > Economy and finance > National accounts (including GDP) > Annual national accounts (nama) > National Accounts detailed breakdowns (by industry, by product, by consumption purpose) > Final consumption expenditure of households by consumption purpose (COICOP)
Data administrator: Eurostat.
Date of acquisition for this indicator: 19 November 2014
Methodology and frequency of data collection for the indicator: The data on household expenditures on personal mobility for Slovenia and other European countries is collected and published under the title national accounts (NR) on the web pages of Eurostat. The obtainment of this data is very complex, since Eurostat considers data of numerous databases for its final calculation, such as data on first registration, import and export, data of energy statistics for fuels, statistical data for prices, transport statistics data, data of the value-added tax, data of insurance companies, etc.
In Slovenia, the data on household expenditures on personal mobility is collected through a household budget survey (APG) by the SORS (Statistical Office of the Republic of Slovenia). The NR and APG data are very similar; however, the data does not coincide completely. According to the SORS explanations, the data of both sources cannot coincide, since APG is only one of the sources for the assessment of the final consumption of households. Besides APG data, NR also use other indicated sources. Furthermore, APG covers only the population residing in individual households, while NR also include expenditures of collective households (prisons, monasteries, etc). The data differs also due to conceptual differences between both sources (different consideration of insurance premiums, inclusion or non-inclusion of imputed rent). In accordance with the ESR95 (European system of accounts 95), NR also add their own production to the consumption of households (in some publications this is also included in the APG), wages in kind and illegal economy. One of the main differences between the APG and NR data is the difference in the domestic and national concept. APG implements the national concept – the expenditures of residents at home and abroad. On the other hand, NR prepare the assessments following the domestic concept – expenditures of residents and non-residents in the territory of the Republic of Slovenia. Therefore, the NR are for this consumer's group a less useful source than the APG.
Data processing methodology: The data on expenditures on personal mobility is indicated in the indicator in the form of a percentage of total consumption by households.
Geographical coverage: The EU-27 includes the EU Member States: Austria, Belgium, Bulgaria, the Czech Republic, Cyprus, Denmark, Estonia, Finland, France, Germany, Greece, Hungary, Ireland, Italy, Latvia, Lithuania, Luxembourg, Malta, the Netherlands, Poland, Portugal, Romania, Slovenia, Slovakia, Spain, Sweden and the United Kingdom. The EU-15 is composed of the older EU Member States: Austria, Belgium, Denmark, Finland, France, Germany, Greece, Ireland, Italy, Luxembourg, the Netherlands, Portugal, Spain, Sweden and the United Kingdom.
Information concerning data quality:
- Advantages and disadvantages (at data level): The strength of the indicator is the consideration of various and numerous databases for the final consumption expenditures of households for personal mobility.The weakness: of the indicator is that data for some coutries have not yet been published during the preparation of the indicator. Therefore individual countries are not shown in the picture PR14-2 but only in the context of data on the average for EU-27 or EU-15.
- Relevance, accuracy, robustness, uncertainty:
Reliability of the indicator (archive data): The data for Slovenia refers to a longer time series. Although the data for other countries is indicated only for 2012, the source database refers to a longer time series as well.
Uncertainty of the indicator (scenarios/projections): Projections have not been prepared.
- Overall assessment (1 = no major comments, 3 = data to be considered with reservation): 1
Relevance: 1
Accuracy: 1
Completeness over time: 2 (The methodology of the obtainment of data has changed periodically.)
Completeness over space: 2 (2012 data are not available for all countries)
Other sources and literature:
- EEA, 2005. TERM 2005 24 – Expenditures on personal mobility. Indicator fact sheet. European Environment Agency.
- EEA, 2011. TERM 24 – Expenditures on personal mobility. Indicator fact sheet. European Environment Agency.


