[ZR10] Emissions of ozone precursors

Key message

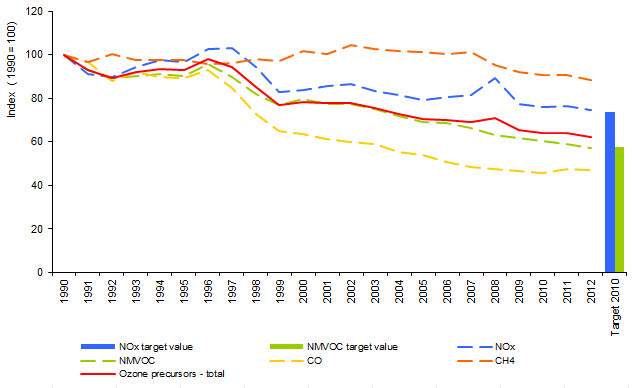
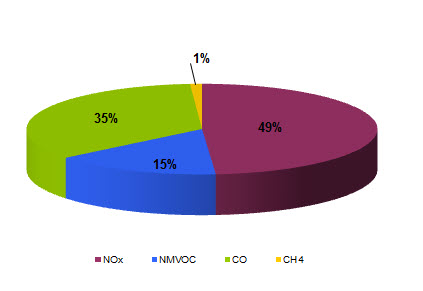
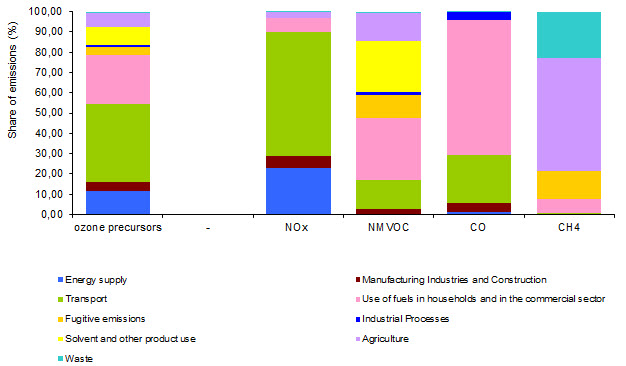
Emissions of ozone precursors decreased by 38% in period 1990 to 2012. Emissions of nitrogen oxides decreased by 26%, carbon monoxide by 53%, non-methane volatile organic compounds by 43% and methane by 12%. The reason is mainly the introduction of more stringent emission standards for motor vehicles. This measure contributed to a significant reduction in emissions of nitrogen oxides and carbon dioxide from road transport which is the main source of ozone precursors. Emissions of non-methane volatile organic compounds decreased in 2012 under the prescribed target value, which must not be exceeded from 2010 onwards while emissions of nitrogen oxides in 2012 exceeded the specified target value.
Definition
Charts
National database on air emissions, Slovenian Environment Agency, 2014
| 1990 | 1991 | 1992 | 1993 | 1994 | 1995 | 1996 | 1997 | 1998 | 1999 | ||
|---|---|---|---|---|---|---|---|---|---|---|---|
| NOx | kt NMVOC equivalents | 74.44 | 67.93 | 66.64 | 70.14 | 72.64 | 72 | 76.18 | 76.7 | 70.09 | 61.76 |
| CO | kt NMVOC equivalents | 36.99 | 35.75 | 32.44 | 33.96 | 33.21 | 33.09 | 34.43 | 31.24 | 26.89 | 24.02 |
| NMVOC | kt NMVOC equivalents | 69.28 | 64.22 | 61.85 | 62.34 | 63.19 | 62.61 | 66.13 | 62.16 | 56.63 | 53.19 |
| CH4 | kt NMVOC equivalents | 1.41 | 1.36 | 1.42 | 1.38 | 1.38 | 1.37 | 1.35 | 1.36 | 1.38 | 1.37 |
| Ozone precursors - total | kt NMVOC equivalents | 182.13 | 169.26 | 162.34 | 167.82 | 170.41 | 169.08 | 178.09 | 171.45 | 154.99 | 140.34 |
| NOx | index (1990 = 100) | 100 | 91.26 | 89.52 | 94.23 | 97.58 | 96.73 | 102.34 | 103.04 | 94.15 | 82.97 |
| CO | index (1990 = 100) | 100 | 96.63 | 87.69 | 91.79 | 89.77 | 89.46 | 93.06 | 84.45 | 72.7 | 64.94 |
| NMVOC | index (1990 = 100) | 100 | 92.69 | 89.27 | 89.98 | 91.21 | 90.37 | 95.45 | 89.72 | 81.74 | 76.77 |
| CH4 | index (1990 = 100) | 100 | 96.43 | 100.25 | 97.59 | 97.42 | 97.28 | 95.59 | 96.01 | 97.81 | 96.82 |
| Ozone precursors - total | index (1990 = 100) | 100 | 92.93 | 89.14 | 92.14 | 93.57 | 92.84 | 97.78 | 94.14 | 85.1 | 77.06 |
| NOx target value | index (1990 = 100) | ||||||||||
| NMVOC target value | index (1990 = 100) | ||||||||||
| 2000 | 2001 | 2002 | 2003 | 2004 | 2005 | 2006 | 2007 | 2008 | 2009 | ||
| NOx | kt NMVOC equivalents | 62.49 | 63.6 | 64.3 | 62.04 | 60.68 | 58.97 | 60.02 | 60.71 | 66.55 | 57.62 |
| CO | kt NMVOC equivalents | 23.44 | 22.73 | 22.07 | 21.78 | 20.37 | 19.93 | 18.78 | 17.92 | 17.53 | 17.16 |
| NMVOC | kt NMVOC equivalents | 55.3 | 53.6 | 53.44 | 51.9 | 49.73 | 47.87 | 47.48 | 45.81 | 43.72 | 42.83 |
| CH4 | kt NMVOC equivalents | 1.43 | 1.42 | 1.48 | 1.45 | 1.44 | 1.43 | 1.42 | 1.43 | 1.34 | 1.3 |
| Ozone precursors - total | kt NMVOC equivalents | 142.66 | 141.34 | 141.29 | 137.17 | 132.22 | 128.2 | 127.71 | 125.87 | 129.14 | 118.92 |
| NOx | index (1990 = 100) | 83.94 | 85.43 | 86.37 | 83.35 | 81.51 | 79.22 | 80.63 | 81.56 | 89.41 | 77.41 |
| CO | index (1990 = 100) | 63.38 | 61.45 | 59.67 | 58.89 | 55.07 | 53.88 | 50.77 | 48.44 | 47.38 | 46.39 |
| NMVOC | index (1990 = 100) | 79.81 | 77.36 | 77.13 | 74.91 | 71.78 | 69.1 | 68.54 | 66.12 | 63.1 | 61.83 |
| CH4 | index (1990 = 100) | 101.52 | 100.22 | 104.6 | 102.45 | 101.62 | 101.17 | 100.31 | 101.06 | 95.15 | 92.18 |
| Ozone precursors - total | index (1990 = 100) | 78.33 | 77.61 | 77.58 | 75.32 | 72.6 | 70.39 | 70.12 | 69.11 | 70.91 | 65.29 |
| NOx target value | index (1990 = 100) | ||||||||||
| NMVOC target value | index (1990 = 100) | ||||||||||
| 2010 | 2011 | 2012 | Target 2010 | ||||||||
| NOx | kt NMVOC equivalents | 56.62 | 56.79 | 55.36 | 54.9 | ||||||
| CO | kt NMVOC equivalents | 16.81 | 17.58 | 17.45 | |||||||
| NMVOC | kt NMVOC equivalents | 41.77 | 40.96 | 39.51 | 40 | ||||||
| CH4 | kt NMVOC equivalents | 1.28 | 1.28 | 1.25 | |||||||
| Ozone precursors - total | kt NMVOC equivalents | 116.49 | 116.6 | 113.57 | |||||||
| NOx | index (1990 = 100) | 76.06 | 76.28 | 74.37 | |||||||
| CO | index (1990 = 100) | 45.44 | 47.52 | 47.17 | |||||||
| NMVOC | index (1990 = 100) | 60.3 | 59.12 | 57.04 | |||||||
| CH4 | index (1990 = 100) | 90.63 | 90.39 | 88.15 | |||||||
| Ozone precursors - total | index (1990 = 100) | 63.96 | 64.02 | 62.36 | |||||||
| NOx target value | index (1990 = 100) | 73.75 | |||||||||
| NMVOC target value | index (1990 = 100) | 57.74 |
National database on air emissions, Slovenian Environment Agency, 2014
| 2012 | ||
|---|---|---|
| NOx | kt NMVOC equivalents | 55 |
| NMVOC | kt NMVOC equivalents | 17 |
| CO | kt NMVOC equivalents | 40 |
| CH4 | kt NMVOC equivalents | 1 |
| ozone precursors - total | kt NMVOC equivalents | 114 |
| NOx | % | 49 |
| NMVOC | % | 15 |
| CO | % | 35 |
| CH4 | % | 1 |
National database on air emissions, Slovenian Environment Agency, 2014
| ozone precursors | - | NOx | NMVOC | CO | CH4 | ||
|---|---|---|---|---|---|---|---|
| Energy supply | kt NMVOC equivalents | 13.02 | 12.63 | 0.17 | 0.21 | 0 | |
| Manufacturing Industries and Construction | kt NMVOC equivalents | 4.95 | 3.29 | 0.86 | 0.8 | 0 | |
| Transport | kt NMVOC equivalents | 43.73 | 33.96 | 5.67 | 4.1 | 0 | |
| Other | kt NMVOC equivalents | 27.43 | 3.64 | 12.1 | 11.6 | 0.09 | |
| Fugitive emissions | kt NMVOC equivalents | 4.67 | 0 | 4.49 | 0 | 0.17 | |
| Industrial Processes | kt NMVOC equivalents | 1.37 | 0.02 | 0.62 | 0.74 | 0 | |
| Solvent and other product use | kt NMVOC equivalents | 9.94 | 0 | 9.94 | 0 | 0 | |
| Agriculture | kt NMVOC equivalents | 7.89 | 1.82 | 5.38 | 0 | 0.69 | |
| Waste | kt NMVOC equivalents | 0.58 | 0.01 | 0.29 | 0 | 0.28 | |
| Total | kt NMVOC equivalents | 113.57 | 55.36 | 39.51 | 17.45 | 1.25 | |
| Energy supply | % | 11.46 | 22.81 | 0.44 | 1.23 | 0.13 | |
| Manufacturing Industries and Construction | % | 4.35 | 5.94 | 2.17 | 4.59 | 0.25 | |
| Transport | % | 38.5 | 61.34 | 14.35 | 23.47 | 0.4 | |
| Use of fuels in households and in the commercial sector | % | 24.15 | 6.57 | 30.62 | 66.49 | 6.87 | |
| Fugitive emissions | % | 4.11 | 0 | 11.37 | 0 | 14.05 | |
| Industrial Processes | % | 1.21 | 0.03 | 1.57 | 4.22 | 0 | |
| Solvent and other product use | % | 8.75 | 0 | 25.15 | 0 | 0 | |
| Agriculture | % | 6.95 | 3.29 | 13.6 | 0 | 55.7 | |
| Waste | % | 0.51 | 0.02 | 0.74 | 0 | 22.61 |
Air pollutant emissions data viewer (LRTAP Convention), European Environment Agency, 2014, EEA Greenhouse gas data viewer, European Environment Agency, 2014, Eurostat, 2014
| Luxembourg | Estonia | Latvia | Finland | Slovenia | Poland | Greece | Lithuania | Denmark | Austria | ||
|---|---|---|---|---|---|---|---|---|---|---|---|
| NOx | kt NMVOC equivalents | 58.39 | 43.5 | 39.06 | 187.12 | 56.79 | 1037.91 | 360.49 | 61.65 | 153.15 | 222.91 |
| NMVOC | kt NMVOC equivalents | 9.12 | 33.08 | 69.95 | 107.18 | 40.96 | 651.95 | 158.41 | 69.03 | 81.43 | 128.17 |
| CO | kt NMVOC equivalents | 4.27 | 16.26 | 24.83 | 50.01 | 17.58 | 320.74 | 54.05 | 21.36 | 42.11 | 66.96 |
| CH4 | kt NMVOC equivalents | 0.29 | 0.64 | 1.05 | 2.8 | 1.28 | 23.69 | 6.42 | 2.03 | 3.66 | 3.57 |
| emissions of ozone precursors | kt NMVOC equivalents | 72.07 | 93.48 | 134.9 | 347.11 | 116.6 | 2034.29 | 579.36 | 154.08 | 280.35 | 421.62 |
| population by countries | number | 537039 | 1320174 | 2023825 | 5426674 | 2058821 | 38533299 | 11062508 | 2971905 | 5602628 | 8451860 |
| emissions per capita | kg/capita | 134.2 | 70.81 | 66.66 | 63.96 | 56.63 | 52.79 | 52.37 | 51.84 | 50.04 | 49.88 |
| Spain | Czech Republic | Croatia | Sweden | Cyprus | Portugal | EU-28 | Italy | Bulgaria | Romania | ||
| NOx | kt NMVOC equivalents | 1236.35 | 275.66 | 80.94 | 177.51 | 25.41 | 214.17 | 10792.93 | 1134.42 | 165.51 | 270.36 |
| NMVOC | kt NMVOC equivalents | 615.3 | 139.82 | 73.07 | 177.18 | 9.62 | 175.68 | 6921.35 | 989.17 | 91.41 | 355.87 |
| CO | kt NMVOC equivalents | 197.62 | 42 | 31.78 | 62.74 | 1.97 | 40.93 | 2587.27 | 271.08 | 31.34 | 111.57 |
| CH4 | kt NMVOC equivalents | 22.1 | 6.82 | 2.34 | 3.32 | 0.6 | 8.3 | 258.4 | 24.38 | 5.12 | 14.84 |
| emissions of ozone precursors | kt NMVOC equivalents | 2071.37 | 464.3 | 188.14 | 420.75 | 37.59 | 439.07 | 20559.94 | 2419.05 | 293.38 | 752.64 |
| population by countries | number | 46727890 | 10516125 | 4262140 | 9555893 | 865878 | 10487289 | 505665739 | 59685227 | 7284552 | 20020074 |
| emissions per capita | kg/capita | 44.33 | 44.15 | 44.14 | 44.03 | 43.41 | 41.87 | 40.66 | 40.53 | 40.27 | 37.59 |
| Germany | Slovakia | France | Belgium | United Kingdom | Malta | Ireland | Netherlands | Hungary | |||
| NOx | kt NMVOC equivalents | 1577.34 | 103.71 | 1226.7 | 256.3 | 1260.36 | 9.58 | 86.07 | 316.48 | 157.57 | |
| NMVOC | kt NMVOC equivalents | 1008.06 | 68.29 | 733.95 | 100.56 | 752.08 | 3.03 | 43.63 | 144.37 | 100.11 | |
| CO | kt NMVOC equivalents | 364.53 | 24.99 | 394.23 | 42.62 | 235.94 | 1.28 | 13.97 | 58.22 | 43.57 | |
| CH4 | kt NMVOC equivalents | 32.56 | 2.76 | 34.06 | 4.23 | 27.81 | 0.11 | 7.75 | 10.17 | 5.64 | |
| emissions of ozone precursors | kt NMVOC equivalents | 2982.49 | 199.75 | 2388.94 | 403.7 | 2276.19 | 14.01 | 151.41 | 529.25 | 306.88 | |
| population by countries | number | 80523746 | 5410836 | 65578819 | 11161642 | 63896071 | 421367 | 4591087 | 16779575 | 9908798 | |
| emissions per capita | kg/capita | 37.04 | 36.92 | 36.43 | 36.17 | 35.62 | 33.24 | 32.98 | 31.54 | 30.97 |


![Figure ZR10-4: Emissions of ozone-precursors per capita, EU-27 [kg / capita], 2011](/sites/default/files/charts/migrated_charts/graph_14470_en.jpg)