[SE08] Ecological footprint
[SE08] Ecological footprint

Key message

Charts
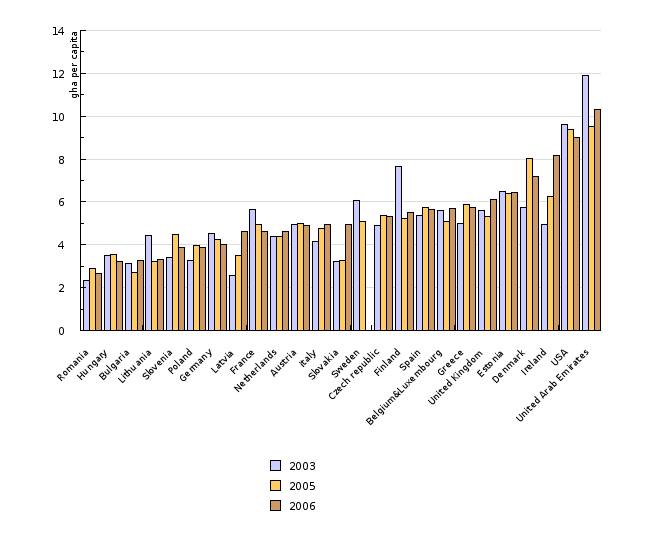
Figure SE08-1: Missing title
Sources:
GFN, Footprint for Nations, 2010
| Romania | Hungary | Bulgaria | Lithuania | Slovenia | Poland | Germany | Latvia | France | Netherlands | ||
|---|---|---|---|---|---|---|---|---|---|---|---|
| 2003 | gha per capita | 2.4 | 3.5 | 3.1 | 4.4 | 3.4 | 3.3 | 4.5 | 2.6 | 5.6 | 4.4 |
| 2005 | gha per capita | 2.9 | 3.5 | 2.7 | 3.2 | 4.5 | 4 | 4.2 | 3.5 | 4.9 | 4.4 |
| 2006 | gha per capita | 2.7 | 3.2 | 3.3 | 3.3 | 3.9 | 3.9 | 4 | 4.6 | 4.6 | 4.6 |
| Austria | italy | Slovakia | Sweden | Czech republic | Finland | Spain | Belgium&Luxembourg | Greece | United Kingdom | ||
| 2003 | gha per capita | 4.9 | 4.2 | 3.2 | 6.1 | 4.9 | 7.6 | 5.4 | 5.6 | 5 | 5.6 |
| 2005 | gha per capita | 5 | 4.8 | 3.3 | 5.1 | 5.4 | 5.2 | 5.7 | 5.1 | 5.9 | 5.3 |
| 2006 | gha per capita | 4.9 | 4.9 | 4.9 | 5.3 | 5.5 | 5.6 | 5.7 | 5.8 | 6.1 | |
| Estonia | Denmark | Ireland | USA | United Arab Emirates | |||||||
| 2003 | gha per capita | 6.5 | 5.8 | 5 | 9.6 | 11.9 | |||||
| 2005 | gha per capita | 6.4 | 8 | 6.3 | 9.4 | 9.5 | |||||
| 2006 | gha per capita | 6.4 | 7.2 | 8.2 | 9 | 10.3 |
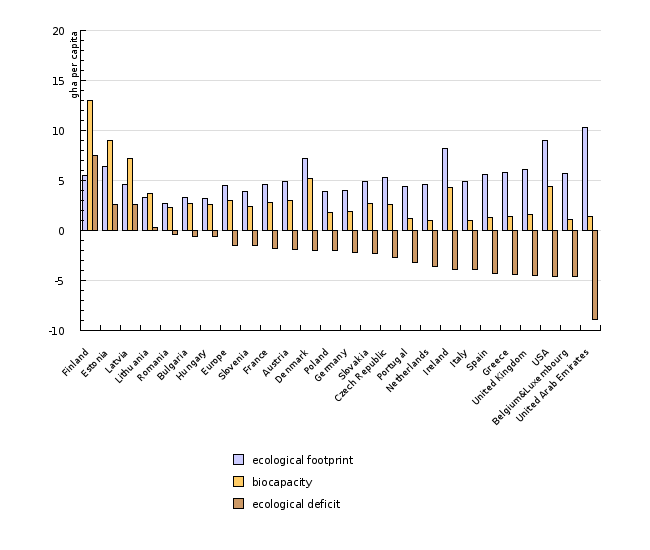
Figure SE08-2: Missing title
Sources:
GFN, Footprint for Nations, 2010
| Finland | Estonia | Latvia | Lithuania | Romania | Bulgaria | Hungary | Europe | Slovenia | France | ||
|---|---|---|---|---|---|---|---|---|---|---|---|
| ecological footprint | gha per capita | 5.5 | 6.4 | 4.6 | 3.3 | 2.7 | 3.3 | 3.2 | 4.5 | 3.9 | 4.6 |
| biocapacity | gha per capita | 13 | 9 | 7.2 | 3.7 | 2.3 | 2.7 | 2.6 | 3 | 2.4 | 2.8 |
| ecological deficit | gha per capita | 7.5 | 2.6 | 2.6 | 0.3 | -0.4 | -0.6 | -0.6 | -1.5 | -1.5 | -1.8 |
| Austria | Denmark | Poland | Germany | Slovakia | Czech Republic | Portugal | Netherlands | Ireland | Italy | ||
| ecological footprint | gha per capita | 4.9 | 7.2 | 3.9 | 4 | 4.9 | 5.3 | 4.4 | 4.6 | 8.2 | 4.9 |
| biocapacity | gha per capita | 3 | 5.2 | 1.8 | 1.9 | 2.7 | 2.6 | 1.2 | 1 | 4.3 | 1 |
| ecological deficit | gha per capita | -1.9 | -2 | -2 | -2.2 | -2.3 | -2.7 | -3.2 | -3.6 | -3.9 | -3.9 |
| Spain | Greece | United Kingdom | USA | Belgium&Luxembourg | United Arab Emirates | ||||||
| ecological footprint | gha per capita | 5.6 | 5.8 | 6.1 | 9 | 5.7 | 10.3 | ||||
| biocapacity | gha per capita | 1.3 | 1.4 | 1.6 | 4.4 | 1.1 | 1.4 | ||||
| ecological deficit | gha per capita | -4.3 | -4.4 | -4.5 | -4.6 | -4.6 | -8.9 |
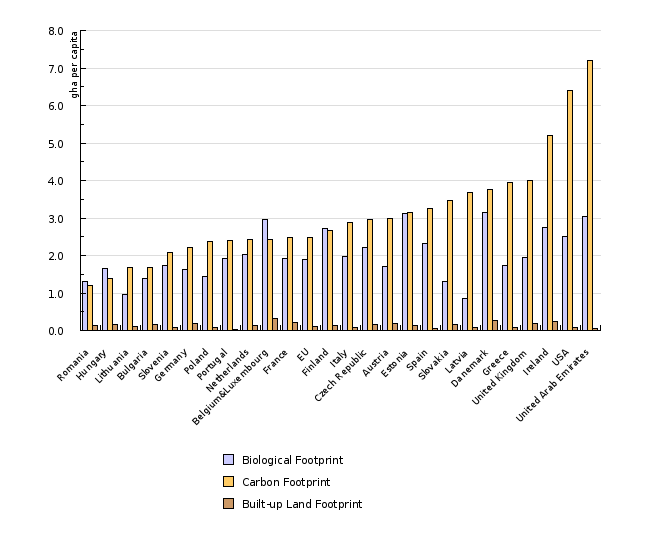
Figure SE08-3: Missing title
Sources:
GFN, Footprint for Nations, 2010
| Romania | Hungary | Lithuania | Bulgaria | Slovenia | Germany | Poland | Portugal | Netherlands | Belgium&Luxembourg | ||
|---|---|---|---|---|---|---|---|---|---|---|---|
| Biological Footprint | gha per capita | 1.31 | 1.66 | 0.95 | 1.39 | 1.73 | 1.64 | 1.44 | 1.92 | 2.02 | 2.95 |
| Carbon Footprint | gha per capita | 1.21 | 1.39 | 1.69 | 1.69 | 2.07 | 2.21 | 2.38 | 2.41 | 2.44 | 2.44 |
| Built-up Land Footprint | gha per capita | 0.14 | 0.17 | 0.1 | 0.17 | 0.09 | 0.18 | 0.07 | 0.04 | 0.14 | 0.31 |
| France | EU | Finland | Italy | Czech Republic | Austria | Estonia | Spain | Slovakia | Latvia | ||
| Biological Footprint | gha per capita | 1.91 | 1.9 | 2.71 | 1.97 | 2.21 | 1.72 | 3.13 | 2.33 | 1.32 | 0.86 |
| Carbon Footprint | gha per capita | 2.49 | 2.49 | 2.67 | 2.88 | 2.95 | 2.98 | 3.15 | 3.25 | 3.48 | 3.67 |
| Built-up Land Footprint | gha per capita | 0.21 | 0.12 | 0.14 | 0.08 | 0.16 | 0.19 | 0.13 | 0.05 | 0.15 | 0.07 |
| Danemark | Greece | United Kingdom | Ireland | USA | United Arab Emirates | ||||||
| Biological Footprint | gha per capita | 3.15 | 1.73 | 1.94 | 2.75 | 2.52 | 3.04 | ||||
| Carbon Footprint | gha per capita | 3.77 | 3.94 | 4 | 5.19 | 6.41 | 7.19 | ||||
| Built-up Land Footprint | gha per capita | 0.28 | 0.08 | 0.18 | 0.25 | 0.09 | 0.06 |
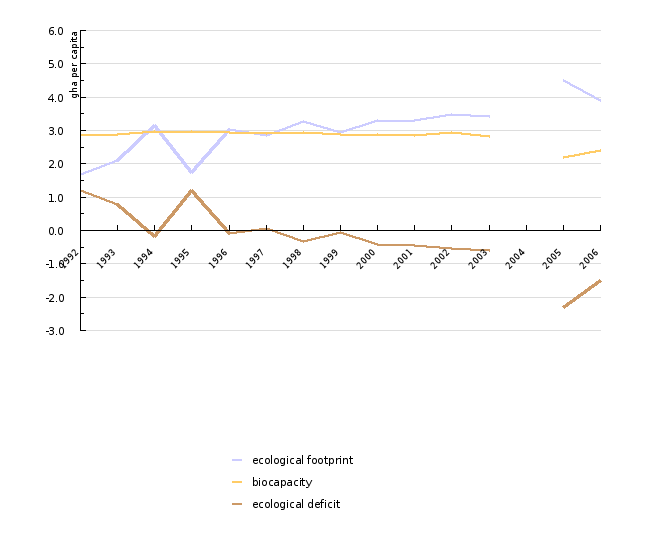
Figure SE08-4: Missing title
Sources:
GFN, Footprint for Nations, 2010
| 1992 | 1993 | 1994 | 1995 | 1996 | 1997 | 1998 | 1999 | 2000 | 2001 | ||
|---|---|---|---|---|---|---|---|---|---|---|---|
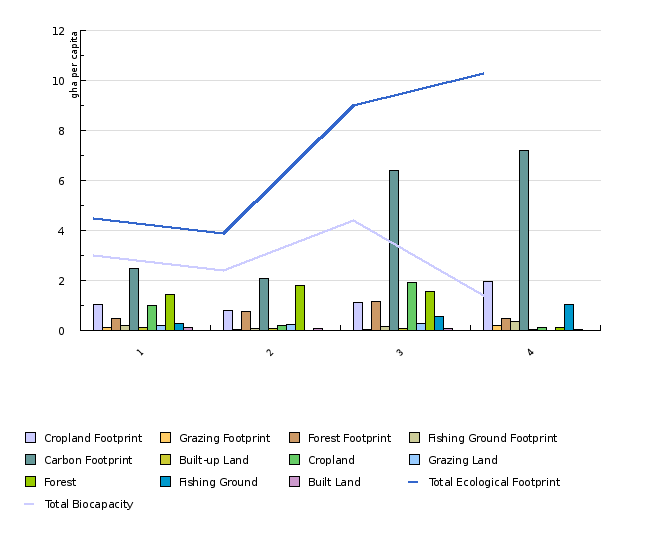
| ecological footprint | gha per capita | 1.7 | 2.1 | 3.2 | 1.7 | 3 | 2.8 | 3.3 | 3 | 3.3 | 3.3 |
| biocapacity | gha per capita | 2.9 | 2.9 | 3 | 3 | 2.9 | 2.9 | 2.9 | 2.9 | 2.9 | 2.9 |
| ecological deficit | gha per capita | 1.2 | 0.8 | -0.2 | 1.2 | -0.1 | 0.1 | -0.3 | -0.1 | -0.4 | -0.4 |
| 2002 | 2003 | 2004 | 2005 | 2006 | |||||||
| ecological footprint | gha per capita | 3.5 | 3.4 | np | 4.5 | 3.9 | |||||
| biocapacity | gha per capita | 2.9 | 2.8 | np | 2.2 | 2.4 | |||||
| ecological deficit | gha per capita | -0.5 | -0.6 | np | -2.3 | -1.5 |
Figure SE08-5: Missing title
Sources:
GFN, Footprint for Nations, 2010
| 1992 | 1993 | 1994 | 1995 | 1996 | 1997 | 1998 | 1999 | 2000 | 2001 | ||
|---|---|---|---|---|---|---|---|---|---|---|---|
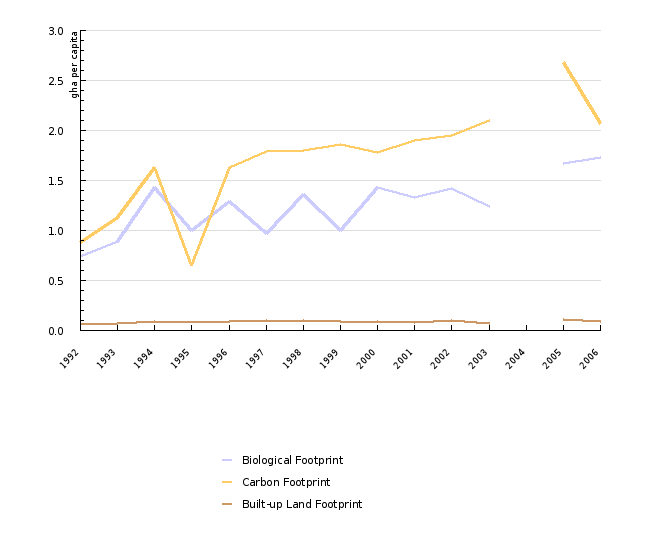
| Biological Footprint | gha per capita | 0.74 | 0.89 | 1.43 | 1 | 1.29 | 0.97 | 1.36 | 1 | 1.43 | 1.33 |
| Carbon Footprint | gha per capita | 0.88 | 1.13 | 1.63 | 0.65 | 1.63 | 1.79 | 1.8 | 1.86 | 1.78 | 1.9 |
| Built-up Land Footprint | gha per capita | 0.07 | 0.07 | 0.09 | 0.09 | 0.09 | 0.1 | 0.1 | 0.09 | 0.09 | 0.08 |
| Total Ecological Footprint | gha per capita | 1.69 | 2.09 | 3.15 | 1.74 | 3.01 | 2.86 | 3.26 | 2.95 | 3.3 | 3.31 |
| 2002 | 2003 | 2004 | 2005 | 2006 | |||||||
| Biological Footprint | gha per capita | 1.42 | 1.24 | np | 1.67 | 1.73 | |||||
| Carbon Footprint | gha per capita | 1.95 | 2.1 | np | 2.68 | 2.07 | |||||
| Built-up Land Footprint | gha per capita | 0.1 | 0.07 | np | 0.11 | 0.09 | |||||
| Total Ecological Footprint | gha per capita | 3.47 | 3.42 | 4.46 | 3.89 |
Figure SE08-6: Missing title
Sources:
GFN, Footprint for Nations, 2010
Methodology
Date of data source summarization


