[SE08] Ecological footprint
[SE08] Ecological footprint

Key message

Charts
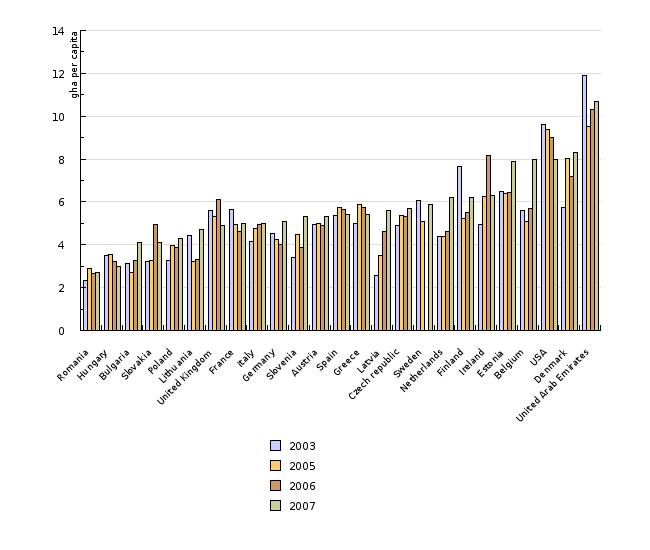
Figure SE08-1: Missing title
Sources:
GFN, Footprint for Nations, 2010
| Romania | Hungary | Bulgaria | Slovakia | Poland | Lithuania | United Kingdom | France | italy | Germany | ||
|---|---|---|---|---|---|---|---|---|---|---|---|
| 2003 | gha per capita | 2.4 | 3.5 | 3.1 | 3.2 | 3.3 | 4.4 | 5.6 | 5.6 | 4.2 | 4.5 |
| 2005 | gha per capita | 2.9 | 3.5 | 2.7 | 3.3 | 4 | 3.2 | 5.3 | 4.9 | 4.8 | 4.2 |
| 2006 | gha per capita | 2.7 | 3.2 | 3.3 | 4.9 | 3.9 | 3.3 | 6.1 | 4.6 | 4.9 | 4 |
| 2007 | gha per capita | 2.7 | 3 | 4.1 | 4.1 | 4.3 | 4.7 | 4.9 | 5 | 5 | 5.1 |
| Slovenia | Austria | Spain | Greece | Latvia | Czech republic | Sweden | Netherlands | Finland | Ireland | ||
| 2003 | gha per capita | 3.4 | 4.9 | 5.4 | 5 | 2.6 | 4.9 | 6.1 | 4.4 | 7.6 | 5 |
| 2005 | gha per capita | 4.5 | 5 | 5.7 | 5.9 | 3.5 | 5.4 | 5.1 | 4.4 | 5.2 | 6.3 |
| 2006 | gha per capita | 3.9 | 4.9 | 5.6 | 5.8 | 4.6 | 5.3 | np | 4.6 | 5.5 | 8.2 |
| 2007 | gha per capita | 5.3 | 5.3 | 5.4 | 5.4 | 5.6 | 5.7 | 5.9 | 6.2 | 6.2 | 6.3 |
| Estonia | Belgium | USA | Denmark | United Arab Emirates | |||||||
| 2003 | gha per capita | 6.5 | 5.6 | 9.6 | 5.8 | 11.9 | |||||
| 2005 | gha per capita | 6.4 | 5.1 | 9.4 | 8 | 9.5 | |||||
| 2006 | gha per capita | 6.4 | 5.7 | 9 | 7.2 | 10.3 | |||||
| 2007 | gha per capita | 7.9 | 8 | 8 | 8.3 | 10.7 |
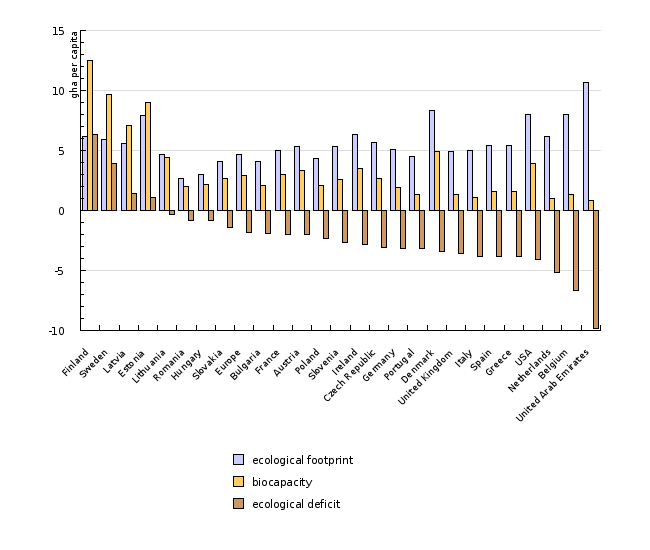
Figure SE08-2: Missing title
Sources:
GFN, Footprint for Nations, 2010
| Finland | Sweden | Latvia | Estonia | Lithuania | Romania | Hungary | Slovakia | Europe | Bulgaria | ||
|---|---|---|---|---|---|---|---|---|---|---|---|
| ecological footprint | gha per capita | 6.2 | 5.9 | 5.6 | 7.9 | 4.7 | 2.7 | 3 | 4.1 | 4.7 | 4.1 |
| biocapacity | gha per capita | 12.5 | 9.7 | 7.1 | 9 | 4.4 | 2 | 2.2 | 2.7 | 2.9 | 2.1 |
| ecological deficit | gha per capita | 6.3 | 3.9 | 1.4 | 1.1 | -0.3 | -0.8 | -0.8 | -1.4 | -1.8 | -1.9 |
| France | Austria | Poland | Slovenia | Ireland | Czech Republic | Germany | Portugal | Denmark | United Kingdom | ||
| ecological footprint | gha per capita | 5 | 5.3 | 4.3 | 5.3 | 6.3 | 5.7 | 5.1 | 4.5 | 8.3 | 4.9 |
| biocapacity | gha per capita | 3 | 3.3 | 2.1 | 2.6 | 3.5 | 2.7 | 1.9 | 1.3 | 4.9 | 1.3 |
| ecological deficit | gha per capita | -2 | -2 | -2.3 | -2.7 | -2.8 | -3.1 | -3.2 | -3.2 | -3.4 | -3.6 |
| Italy | Spain | Greece | USA | Netherlands | Belgium | United Arab Emirates | |||||
| ecological footprint | gha per capita | 5 | 5.4 | 5.4 | 8 | 6.2 | 8 | 10.7 | |||
| biocapacity | gha per capita | 1.1 | 1.6 | 1.6 | 3.9 | 1 | 1.3 | 0.8 | |||
| ecological deficit | gha per capita | -3.8 | -3.8 | -3.8 | -4.1 | -5.2 | -6.7 | -9.8 |
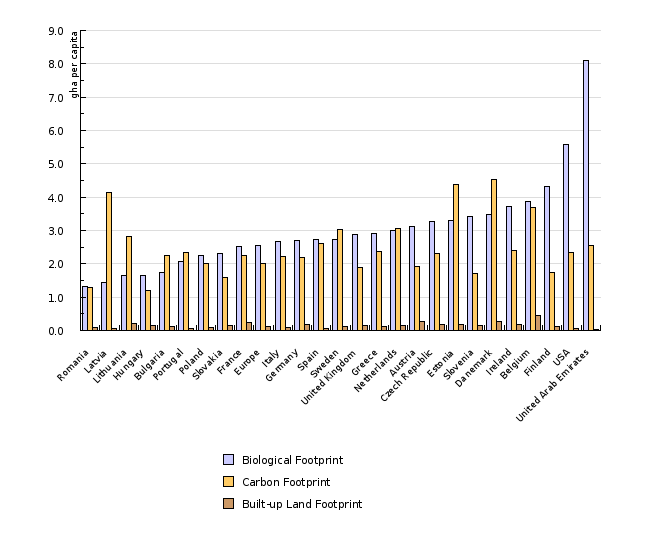
Figure SE08-3: Missing title
Sources:
GFN, Footprint for Nations, 2010
| Romania | Latvia | Lithuania | Hungary | Bulgaria | Portugal | Poland | Slovakia | France | Europe | ||
|---|---|---|---|---|---|---|---|---|---|---|---|
| Biological Footprint | gha per capita | 1.32 | 1.43 | 1.65 | 1.66 | 1.73 | 2.07 | 2.26 | 2.3 | 2.51 | 2.54 |
| Carbon Footprint | gha per capita | 1.29 | 4.14 | 2.81 | 1.19 | 2.24 | 2.34 | 2.01 | 1.6 | 2.26 | 2.02 |
| Built-up Land Footprint | gha per capita | 0.1 | 0.07 | 0.2 | 0.14 | 0.11 | 0.06 | 0.09 | 0.15 | 0.24 | 0.12 |
| Italy | Germany | Spain | Sweden | United Kingdom | Greece | Netherlands | Austria | Czech Republic | Estonia | ||
| Biological Footprint | gha per capita | 2.66 | 2.7 | 2.73 | 2.73 | 2.87 | 2.92 | 2.99 | 3.13 | 3.27 | 3.3 |
| Carbon Footprint | gha per capita | 2.23 | 2.19 | 2.62 | 3.04 | 1.88 | 2.37 | 3.05 | 1.91 | 2.3 | 4.39 |
| Built-up Land Footprint | gha per capita | 0.1 | 0.19 | 0.07 | 0.11 | 0.15 | 0.11 | 0.15 | 0.26 | 0.17 | 0.19 |
| Slovenia | Danemark | Ireland | Belgium | Finland | USA | United Arab Emirates | |||||
| Biological Footprint | gha per capita | 3.42 | 3.47 | 3.72 | 3.87 | 4.31 | 5.57 | 8.1 | |||
| Carbon Footprint | gha per capita | 1.72 | 4.52 | 2.4 | 3.68 | 1.74 | 2.35 | 2.54 | |||
| Built-up Land Footprint | gha per capita | 0.16 | 0.27 | 0.17 | 0.45 | 0.11 | 0.07 | 0.04 |
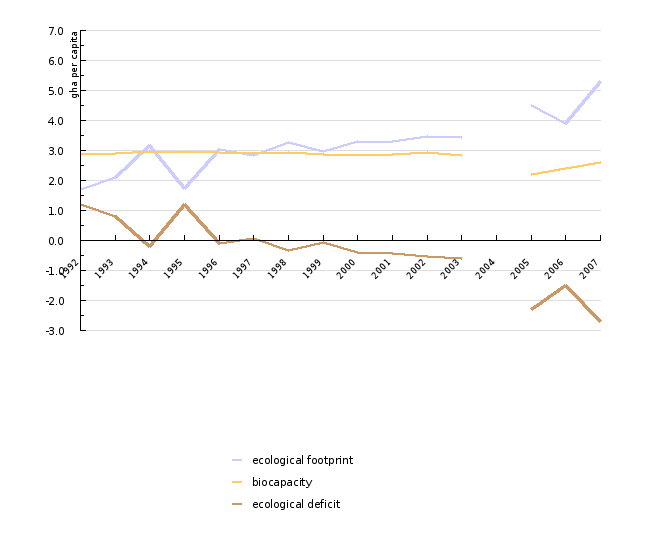
Figure SE08-4: Missing title
Sources:
GFN, Footprint for Nations, 2010
| 1992 | 1993 | 1994 | 1995 | 1996 | 1997 | 1998 | 1999 | 2000 | 2001 | ||
|---|---|---|---|---|---|---|---|---|---|---|---|
| ecological footprint | gha per capita | 1.7 | 2.1 | 3.2 | 1.7 | 3 | 2.8 | 3.3 | 3 | 3.3 | 3.3 |
| biocapacity | gha per capita | 2.9 | 2.9 | 3 | 3 | 2.9 | 2.9 | 2.9 | 2.9 | 2.9 | 2.9 |
| ecological deficit | gha per capita | 1.2 | 0.8 | -0.2 | 1.2 | -0.1 | 0.1 | -0.3 | -0.1 | -0.4 | -0.4 |
| 2002 | 2003 | 2004 | 2005 | 2006 | 2007 | ||||||
| ecological footprint | gha per capita | 3.5 | 3.4 | 4.5 | 3.9 | 5.3 | |||||
| biocapacity | gha per capita | 2.9 | 2.8 | 2.2 | 2.4 | 2.6 | |||||
| ecological deficit | gha per capita | -0.5 | -0.6 | -2.3 | -1.5 | -2.7 |
Figure SE08-5: Missing title
Sources:
GFN, Footprint for Nations, 2010
| 1992 | 1993 | 1994 | 1995 | 1996 | 1997 | 1998 | 1999 | 2000 | 2001 | ||
|---|---|---|---|---|---|---|---|---|---|---|---|
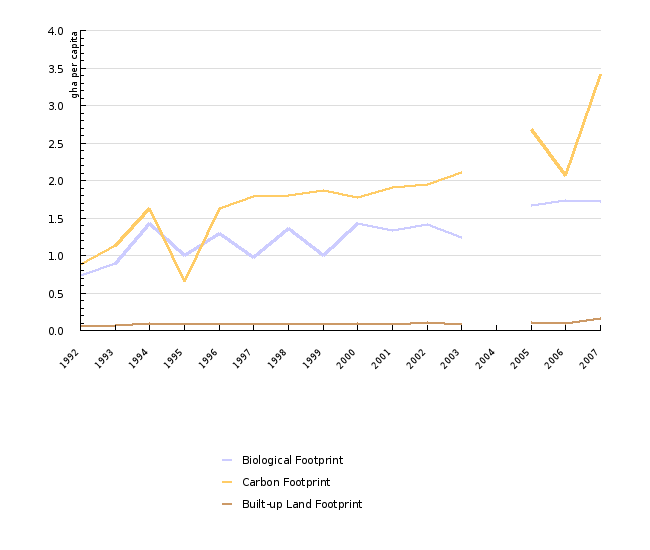
| Biological Footprint | gha per capita | 0.74 | 0.89 | 1.43 | 1 | 1.29 | 0.97 | 1.36 | 1 | 1.43 | 1.33 |
| Carbon Footprint | gha per capita | 0.88 | 1.13 | 1.63 | 0.65 | 1.63 | 1.79 | 1.8 | 1.86 | 1.78 | 1.9 |
| Built-up Land Footprint | gha per capita | 0.07 | 0.07 | 0.09 | 0.09 | 0.09 | 0.1 | 0.1 | 0.09 | 0.09 | 0.08 |
| Total Ecological Footprint | gha per capita | 1.69 | 2.09 | 3.15 | 1.74 | 3.01 | 2.86 | 3.26 | 2.95 | 3.3 | 3.31 |
| 2002 | 2003 | 2004 | 2005 | 2006 | 2007 | ||||||
| Biological Footprint | gha per capita | 1.42 | 1.24 | 1.67 | 1.73 | 1.72 | |||||
| Carbon Footprint | gha per capita | 1.95 | 2.1 | 2.68 | 2.07 | 3.42 | |||||
| Built-up Land Footprint | gha per capita | 0.1 | 0.07 | 0.11 | 0.09 | 0.16 | |||||
| Total Ecological Footprint | gha per capita | 3.47 | 3.42 | 4.46 | 3.89 | 5.3 |
Figure SE08-6: Missing title
Sources:
GFN, Footprint for Nations, 2010
| Europe | Slovenia | USA | United Arab Emirates | ||
|---|---|---|---|---|---|
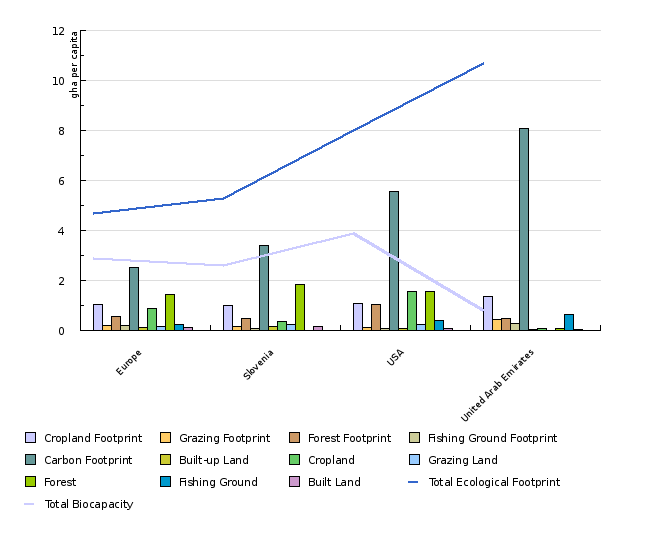
| Cropland Footprint | gha per capita | 1.06 | 1 | 1.08 | 1.35 |
| Grazing Footprint | gha per capita | 0.19 | 0.15 | 0.14 | 0.43 |
| Forest Footprint | gha per capita | 0.55 | 0.5 | 1.03 | 0.47 |
| Fishing Ground Footprint | gha per capita | 0.22 | 0.07 | 0.1 | 0.29 |
| Carbon Footprint | gha per capita | 2.54 | 3.42 | 5.57 | 8.1 |
| Built-up Land | gha per capita | 0.12 | 0.16 | 0.07 | 0.04 |
| Total Ecological Footprint | gha per capita | 4.7 | 5.3 | 8 | 10.7 |
| Cropland | gha per capita | 0.89 | 0.38 | 1.58 | 0.09 |
| Grazing Land | gha per capita | 0.18 | 0.24 | 0.26 | 0 |
| Forest | gha per capita | 1.46 | 1.83 | 1.55 | 0.09 |
| Fishing Ground | gha per capita | 0.25 | 0 | 0.41 | 0.63 |
| Built Land | gha per capita | 0.12 | 0.16 | 0.07 | 0.04 |
| Total Biocapacity | gha per capita | 2.9 | 2.6 | 3.9 | 0.8 |
Methodology
Date of data source summarization


