[KM02] Consumption of Mineral Fertilizers 

Key message

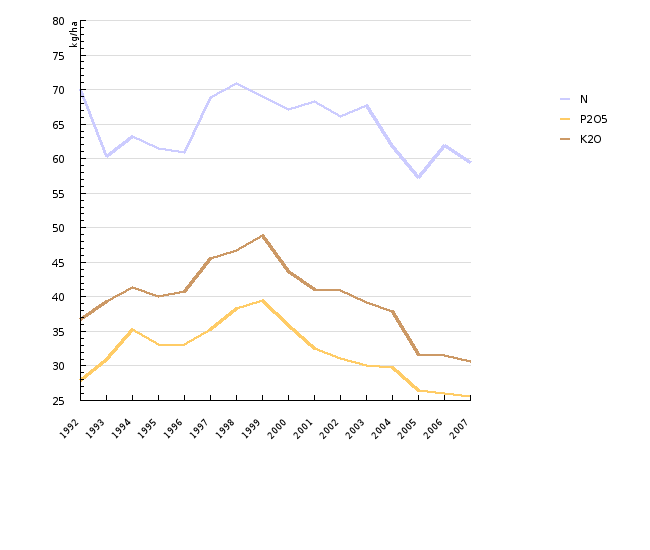
In the 1992-2005 period, the total amount of consumed mineral fertilizers in Slovenia decreased by 21.3 %. The consumption of nitrogen decreased the most (25.1 %), followed by phosphorus (21.3 %) and potassium (13.3 %). The consumption of mineral fertilizers per hectare of utilised agricultural area decreased by 14.0 %.
Definition
Mineral fertilizers are substances in any physical state which contain plant nutrients and are added to the soil or plants to improve the growth, increase the yield, improve the quality of the crops or fertility of the soil, and are acquired in an industrial procedure (Mineral Fertilizers Act, Official Gazette RS, No. 29/2006).
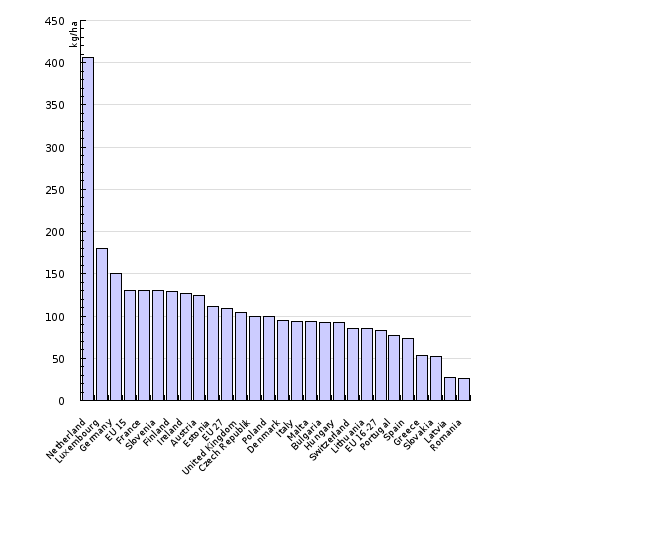
The indicator shows the consumption of mineral fertilizers in Slovenia in the 1992–2005 period. Presented are their total consumption and the consumption of the main plant nutrients (nitrogen, phosphorus, potassium). We calculated the consumption of mineral fertilizers per hectare of utilised agricultural area and made a comparison with the EU countries.
Charts
Statistical Office of the Republic of Slovenia, 2008
| 1992 | 1993 | 1994 | 1995 | 1996 | 1997 | 1998 | 1999 | 2000 | 2001 | ||
|---|---|---|---|---|---|---|---|---|---|---|---|
| mineral fertilisers | t | 189922 | 174055 | 182191 | 168780 | 168029 | 180599 | 184729 | 186370 | 174180 | 178166 |
| 2002 | 2003 | 2004 | 2005 | 2006 | 2007 | ||||||
| mineral fertilisers | t | 175724 | 177589 | 162680 | 149504 | 146593 | 149587 |
Statistical Office of the Republic of Slovenia, 2008.
| 1992 | 1993 | 1994 | 1995 | 1996 | 1997 | 1998 | 1999 | 2000 | 2001 | ||
|---|---|---|---|---|---|---|---|---|---|---|---|
| N | t | 38938 | 33376 | 33944 | 32235 | 31296 | 33999 | 34801 | 34380 | 34159 | 34765 |
| P2O5 | t | 15486 | 17137 | 18950 | 17391 | 16972 | 17431 | 18826 | 19717 | 18250 | 16607 |
| K2O | t | 20426 | 21735 | 22256 | 21018 | 20903 | 22489 | 22945 | 24402 | 22227 | 20911 |
| N | % | 52 | 46.2 | 45.2 | 45.6 | 45.2 | 46 | 45.4 | 43.8 | 45.8 | 48.1 |
| P2O5 | % | 20.7 | 23.7 | 25.2 | 24.6 | 24.5 | 23.6 | 24.6 | 25.1 | 24.5 | 23 |
| K2O | % | 27.3 | 30.1 | 29.6 | 29.8 | 30.2 | 30.4 | 30 | 31.1 | 29.8 | 28.9 |
| N | kg/ha | 70 | 60.4 | 63.1 | 61.4 | 60.9 | 68.8 | 70.9 | 69 | 67.1 | 68.2 |
| P2O5 | kg/ha | 27.9 | 31 | 35.3 | 33.1 | 33.1 | 35.3 | 38.3 | 39.5 | 35.9 | 32.6 |
| K2O | kg/ha | 36.7 | 39.3 | 41.4 | 40 | 40.7 | 45.5 | 46.7 | 48.9 | 43.7 | 41 |
| 2002 | 2003 | 2004 | 2005 | 2006 | 2007 | ||||||
| N | t | 33412 | 34501 | 30264 | 29169 | 30383 | 29613 | ||||
| P2O5 | t | 15698 | 15311 | 14640 | 13431 | 12787 | 12745 | ||||
| K2O | t | 20655 | 20007 | 18573 | 16081 | 15458 | 15264 | ||||
| N | % | 47.9 | 49.4 | 47.7 | 49.7 | 51.8 | 51.4 | ||||
| P2O5 | % | 22.5 | 21.9 | 23.1 | 22.9 | 21.8 | 22.1 | ||||
| K2O | % | 29.6 | 28.7 | 29.3 | 27.4 | 26.4 | 26.5 | ||||
| N | kg/ha | 66.1 | 67.7 | 61.7 | 57.3 | 62 | 59.4 | ||||
| P2O5 | kg/ha | 31.1 | 30 | 29.8 | 26.4 | 26.1 | 25.6 | ||||
| K2O | kg/ha | 40.9 | 39.3 | 37.9 | 31.6 | 31.5 | 30.6 |
Statistical Office of the Republic of Slovenia, 2008; Food and Agriculture Organization, 2008.
| Netherland | Luxembourg | Germany | EU 15 | France | Slovenia | Finland | Ireland | Austria | Estonia | ||
|---|---|---|---|---|---|---|---|---|---|---|---|
| 2002 | kg/ha | 333.2 | 281.5 | 152.9 | 130.7 | 131.3 | 138 | 134.3 | 125.7 | 96.1 | 298.4 |
| 2003 | kg/ha | 303.3 | 129.6 | 152.8 | 121.2 | 138.1 | 137 | 116.7 | 122.6 | 121.5 | 47.1 |
| 2004 | kg/ha | 663.2 | 161.6 | 150.4 | 152 | 131.6 | 129.4 | 130.8 | 124.2 | 122 | 56.9 |
| 2005 | kg/ha | 326 | 145.7 | 145.9 | 118.5 | 119.6 | 115.3 | 132.5 | 132.8 | 159.3 | 43.3 |
| 2002-2005 | kg/ha | 406.4 | 179.6 | 150.5 | 130.6 | 130.1 | 129.9 | 128.6 | 126.3 | 124.7 | 111.4 |
| EU 27 | United Kingdom | Czech Republik | Poland | Denmark | Italy | Malta | Bulgaria | Hungary | Switzerland | ||
| 2002 | kg/ha | 115.4 | 108.7 | 97 | 97.7 | 83.2 | 101.7 | 92.9 | 71.7 | 96.2 | 78.7 |
| 2003 | kg/ha | 99.7 | 102.9 | 91 | 86.1 | 116.3 | 91.9 | 79.6 | 91.9 | 81.8 | 99.4 |
| 2004 | kg/ha | 123 | 105 | 101.6 | 116.1 | 130 | 94.6 | 117 | 97.6 | 96.5 | 90.5 |
| 2005 | kg/ha | 99.8 | 97.9 | 109.1 | 97.8 | 51.7 | 88.4 | 86.5 | 107.4 | 92.9 | 74.6 |
| 2002-2005 | kg/ha | 109.5 | 103.7 | 99.7 | 99.4 | 95.3 | 94.1 | 94 | 92.1 | 91.8 | 85.8 |
| Lithuania | EU 16-27 | Portugal | Spain | Greece | Slovakia | Latvia | Romania | ||||
| 2002 | kg/ha | 62.6 | 95.9 | 84.1 | 68.4 | 50.3 | 47.5 | 30.9 | 22 | ||
| 2003 | kg/ha | 88.5 | 72.4 | 71.1 | 78.8 | 52.1 | 39.2 | 29.9 | 24.5 | ||
| 2004 | kg/ha | 107.4 | 86 | 83.9 | 83.8 | 57 | 61 | 36.9 | 25.8 | ||
| 2005 | kg/ha | 80.5 | 76.1 | 69.3 | 63.2 | 51.9 | 59.6 | 13.2 | 31.8 | ||
| 2002-2005 | kg/ha | 84.7 | 82.6 | 77.1 | 73.6 | 52.8 | 51.8 | 27.7 | 26 |
Goals
The Resolution on National Environmental Action Plan 2005–2012 anticipates a balanced consumption of mineral fertilizers, a gradual increase in the extent of organic production and prevention of soil-burdening from point and non-point sources. The Rules Concerning Good Agricultural Practice in Fertilization define that fertilization should be carried out in a manner which enables the plants to use the nutrients to the full extent and prevents loss to the groundwater and the atmosphere. In accordance with the Nitrates Directive, the goal of the Action programme for protection of waters against nitrate pollution from agricultural sources for the period 2004–2008 is to reduce and prevent further pollution of waters with nitrates from agricultural production. The goals regarding the consumption of mineral fertilizers are of a descriptive nature, while quantitative goals are not determined.
Comment
In the 1992–2005 period, the consumption of mineral fertilizers in Slovenia decreased by 21.3 %, and a constant decrease has been observed since 1999. The main reason for the decrease in the consumption is mostly due to the decrease in 2004 and 2005, when the consumption of mineral fertilizers decreased by 15.8 %, while in the 1992-2003 period it had decreased by 6.5 %.
The same period also saw a decrease in the consumption of mineral fertilizers per hectare of agricultural land from 342 kg/ha to 294 kg/ha, or by 14.0 %. Furthermore, the consumption of plant nutrients decreased from 135 kg/ha to 115 kg/ha, or by 14.3 %. Among plant nutrients in the structure of mineral fertilizers, nitrogen prevails with 47 %, followed by potassium (29 %) and phosphorus (24 %). These facts confirm that in Slovenia, mineral fertilizers are used mostly for sidedressing with nitrogen (consumption of KAN and urea nitrogen fertilizers), while fertilization with phosphorus and potassium is combined with the use of livestock manure in the pre-sowing treatment of the soil. In the 1992-2005 period, the consumption of nitrogen decreased the most (25,1 %), followed by phosphorus (21.3 %) and potassium (13.3 %).
A decrease in the consumption of mineral fertilizers per hectare of utilised agricultural area is attributed to the requirements of the Nitrates Directive and the principles of good farming practice in fertilization, to which all agricultural holdings have been committed in the last few years, and even more so since 2004, when Slovenia entered the EU. Both documents focus more on the use of livestock manure and take plant nutrients into consideration when planning fertilization with mineral fertilizers. Agricultural holdings need to have elaborate fertilization plans which also assess the used plant nutrients from livestock manure, thus the consumption of mineral fertilizers has been decreasing accordingly.
In the 1992-2005 period, the consumption of plant nutrients (N, P2O5, K2O) per hectare of utilised agricultural area in Slovenia was larger than in the EU member countries. In the 1992-1999 period, the consumption increased from 135 kg/ha to 157 kg/ha, then started to decrease and dropped to 115 kg/ha in 2005. Similar trends can also be observed in the EU countries (EU-25 and EU 15), where the consumption of plant nutrients per unit of utilised agricultural area started to decrease after 1996.
Methodology
Data for Slovenia
Data on the quantity of consumed mineral fertilizers are collected by the Statistical Office of the Republic of Slovenia and published regularly on an annual basis in the Statistical Yearbook of the Republic of Slovenia. They are acquired on the basis of annual reports by companies, societies and cooperatives on the consumed mineral fertilizers and stock, on the basis of annual reports by importers on the import and purchase of mineral fertilizers, and on the basis of data on the domestic production and export. The indicator includes the consumption of mineral fertilizers in market production and production for own needs.
Data for other countries
Data for the consumption of mineral fertilizers in the EU member countries are accessible from the FAO (Food and Agriculture Organization) databases.


