[ZD05] Access to safe drinking water

Key message

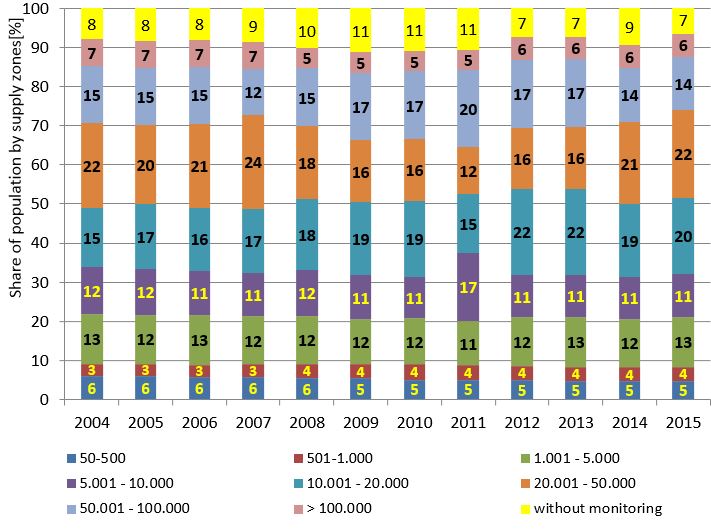
In Slovenia in 2015, 93% of the population was supplied with drinking water from water supply systems that had undergone water quality monitoring in situ, at users’ taps. Drinking water monitoring excluded 7% of the Slovenian population. Generally, all residents of Slovenian cities are supplied with drinking water subjected to regular monitoring. Accessibility of drinking water did not improve significantly in the period 2004–2015.
Definition
This indicator shows the number and percentage of inhabitants of the Republic of Slovenia who are supplied with drinking water from drinking water supply systems that were included in drinking water monitoring in the period 2004-2015 and the number and percentage of the population not included in drinking water monitoring in 2015 (by statistical region).
A drinking water supply system is a supply area that may be divided into supply sub-areas (zones). A supply area is a geographically defined area supplied with drinking water from one or more water sources. Within a supply area, values of drinking water parameters are roughly uniform. The Rules on drinking water (2004) classifies supply areas into categories by size with regard to the number of inhabitants living in a supply area; in this indicator, they are partially clustered into small, mid-size and large supply areas, supplying 50–1000, 1001–10,000 and over 10,000 inhabitants, respectively.
Charts
Insitute of Public health, 2005-2008; The Health Insurance Institute Maribor, 2009-2014 ; National Laboratory of Health, Environment and Food, 2014-2016
| 2004 | 2005 | 2006 | 2007 | 2008 | 2009 | 2010 | 2011 | 2012 | 2013 | ||
|---|---|---|---|---|---|---|---|---|---|---|---|
| 50-500 | No. | 119622 | 120712 | 115467 | 115692 | 111761 | 110155 | 104785 | 103307 | 100230 | 99464 |
| 501-1.000 | No. | 60545 | 63495 | 63881 | 65618 | 73197 | 74009 | 79237 | 75845 | 78483 | 74297 |
| 1.001 - 5.000 | No. | 257466 | 249602 | 252175 | 249523 | 248623 | 236644 | 241403 | 231986 | 253814 | 258608 |
| 5.001 - 10.000 | No. | 237706 | 233540 | 229876 | 220533 | 236392 | 227033 | 218627 | 358774 | 220651 | 223251 |
| 10.001 - 20.000 | No. | 304223 | 334488 | 323988 | 334102 | 369044 | 381635 | 396784 | 306982 | 454777 | 454777 |
| 20.001 - 50.000 | No. | 431573 | 403647 | 431688 | 481406 | 373443 | 324145 | 324145 | 246601 | 321241 | 323921 |
| 50.001 - 100.000 | No. | 292000 | 292000 | 292000 | 241000 | 300494 | 353743 | 353774 | 406507 | 357657 | 357657 |
| > 100.000 | No. | 137000 | 137000 | 137000 | 137000 | 104600 | 104600 | 104600 | 104600 | 118700 | 118700 |
| TOTAL | No. | 1840135 | 1834484 | 1846075 | 1844874 | 1817554 | 1811964 | 1823355 | 1834602 | 1905553 | 1910675 |
| without monitoring | No. | 156869 | 166630 | 162441 | 174532 | 205075 | 230371 | 225906 | 217894 | 150709 | 148145 |
| 50-500 | % | 6 | 6 | 6 | 6 | 6 | 5 | 5 | 5 | 5 | 5 |
| 501-1.000 | % | 3 | 3 | 3 | 3 | 4 | 4 | 4 | 4 | 4 | 4 |
| 1.001 - 5.000 | % | 13 | 12 | 13 | 12 | 12 | 12 | 12 | 11 | 12 | 13 |
| 5.001 - 10.000 | % | 12 | 12 | 11 | 11 | 12 | 11 | 11 | 17 | 11 | 11 |
| 10.001 - 20.000 | % | 15 | 17 | 16 | 17 | 18 | 19 | 19 | 15 | 22 | 22 |
| 20.001 - 50.000 | % | 22 | 20 | 21 | 24 | 18 | 16 | 16 | 12 | 16 | 16 |
| 50.001 - 100.000 | % | 15 | 15 | 15 | 12 | 15 | 17 | 17 | 20 | 17 | 17 |
| > 100.000 | % | 7 | 7 | 7 | 7 | 5 | 5 | 5 | 5 | 6 | 6 |
| without monitoring | % | 8 | 8 | 8 | 9 | 10 | 11 | 11 | 11 | 7 | 7 |
| Inhabitants of Slovenia | no. | 1997004 | 2001114 | 2008516 | 2019406 | 2022629 | 2042335 | 2049261 | 2052496 | 2056262 | 2058820 |
| 2014 | 2015 | ||||||||||
| 50-500 | No. | 97238 | 99491 | ||||||||
| 501-1.000 | No. | 72324 | 74321 | ||||||||
| 1.001 - 5.000 | No. | 257099 | 259383 | ||||||||
| 5.001 - 10.000 | No. | 218651 | 226858 | ||||||||
| 10.001 - 20.000 | No. | 382712 | 404710 | ||||||||
| 20.001 - 50.000 | No. | 434922 | 460308 | ||||||||
| 50.001 - 100.000 | No. | 283775 | 283775 | ||||||||
| > 100.000 | No. | 123124 | 120561 | ||||||||
| TOTAL | No. | 1869845 | 1929407 | ||||||||
| without monitoring | No. | 191778 | 133670 | ||||||||
| 50-500 | % | 5 | 5 | ||||||||
| 501-1.000 | % | 4 | 4 | ||||||||
| 1.001 - 5.000 | % | 12 | 13 | ||||||||
| 5.001 - 10.000 | % | 11 | 11 | ||||||||
| 10.001 - 20.000 | % | 19 | 20 | ||||||||
| 20.001 - 50.000 | % | 21 | 22 | ||||||||
| 50.001 - 100.000 | % | 14 | 14 | ||||||||
| > 100.000 | % | 6 | 6 | ||||||||
| without monitoring | % | 9 | 7 | ||||||||
| Inhabitants of Slovenia | no. | 2061623 | 2063077 |
Insitute of Public health, 2005-2008; The Health Insurance Institute Maribor, 2009-2014 ; National Laboratory of Health, Environment and Food, 2014-2016
| 2004 | 2005 | 2006 | 2007 | 2008 | 2009 | 2010 | 2011 | 2012 | 2013 | ||
|---|---|---|---|---|---|---|---|---|---|---|---|
| 50-500 | No. | 706 | 721 | 692 | 697 | 695 | 688 | 669 | 634 | 597 | 583 |
| 501-1.000 | No. | 85 | 90 | 90 | 91 | 102 | 102 | 113 | 108 | 111 | 105 |
| 1.001 - 5.000 | No. | 112 | 109 | 111 | 111 | 110 | 105 | 108 | 111 | 115 | 118 |
| 5.001 - 10.000 | No. | 32 | 32 | 32 | 31 | 33 | 33 | 32 | 33 | 32 | 32 |
| 10.001 - 20.000 | No. | 22 | 24 | 23 | 24 | 26 | 27 | 28 | 28 | 31 | 31 |
| 20.001 - 50.000 | No. | 15 | 14 | 15 | 16 | 13 | 12 | 12 | 11 | 11 | 11 |
| 50.001 - 100.000 | No. | 4 | 4 | 4 | 3 | 4 | 5 | 5 | 5 | 5 | 5 |
| > 100.000 | No. | 1 | 1 | 1 | 1 | 1 | 1 | 1 | 1 | 1 | 1 |
| No. | 977 | 995 | 968 | 974 | 984 | 973 | 968 | 931 | 903 | 886 | |
| 2014 | 2015 | ||||||||||
| 50-500 | No. | 544 | 569 | ||||||||
| 501-1.000 | No. | 102 | 105 | ||||||||
| 1.001 - 5.000 | No. | 119 | 120 | ||||||||
| 5.001 - 10.000 | No. | 31 | 32 | ||||||||
| 10.001 - 20.000 | No. | 27 | 29 | ||||||||
| 20.001 - 50.000 | No. | 16 | 17 | ||||||||
| 50.001 - 100.000 | No. | 4 | 4 | ||||||||
| > 100.000 | No. | 1 | 1 | ||||||||
| No. | 844 | 877 |
National Laboratory of Health, Environment and Food, 2016
| Gorenjska | Goriška | SE Slovenia | Koroška | Obalno-kraška | Osrednjeslovenska | Podravska | Pomurska | Posavska | Primorsko-Notranjska | ||
|---|---|---|---|---|---|---|---|---|---|---|---|
| small s.a.(50-1000) | % | 9 | 18 | 8 | 16 | 2 | 5 | 3 | 14 | 24 | 9 |
| medium s.a.(1001-10.000) | % | 26 | 28 | 31 | 59 | 0 | 13 | 26 | 30 | 28 | 35 |
| big s.a. (>10.000) | % | 58 | 47 | 56 | 0 | 92 | 81 | 69 | 49 | 41 | 57 |
| without supervision | % | 7 | 7 | 4 | 26 | 6 | 0 | 3 | 6 | 8 | -0 |
| Savinjska | Zasavska | Slovenia | |||||||||
| small s.a.(50-1000) | % | 9 | 15 | 8 | |||||||
| medium s.a.(1001-10.000) | % | 25 | 36 | 24 | |||||||
| big s.a. (>10.000) | % | 50 | 20 | 62 | |||||||
| without supervision | % | 15 | 29 | 7 |
National Laboratory of Health, Environment and Food, 2016
| SUPPLY ZONES | POPULATION | ||
|---|---|---|---|
| mixed | No. | 25 | 63566 |
| undefined | No. | 14 | 2405 |
| underground | No. | 467 | 1272294 |
| surface | No. | 371 | 591142 |
| total | No. | 877 | 1929407 |
| mixed | % | 3 | 3 |
| undefined | % | 2 | 0 |
| underground | % | 53 | 66 |
| surface | % | 42 | 31 |
| Total | % | 100 | 100 |
Goals
- To provide access to safe drinking water in sufficient quantities to all inhabitants of Slovenia;
- to connect inhabitants, particularly those supplied by small and poorly managed systems, to large, professionally managed and controlled water supply systems or to improve the management and technical compliance of small systems according to equal principles to ensure safe drinking water for everyone;
- to carry out monitoring of all systems within the parameters of regular and periodical testing of samples;
- to inform inhabitants connected to small systems supplying fewer than 50 people that the Rules on drinking water are not implemented in these systems (there is no monitoring and control), inform them of possible measures to protect health from harmful factors and to forward them recommendations for acting in the event of reasonable suspicion that drinking water represents a potential hazard to human health.
Comment
Untreated drinking water can be classified as surface or subterranean water. Surface water includes inland waters (e.g. rivers and lakes) and sea. Due to their exposure to pollution, the quality of surface waters is questionable. In hygiene, surface waters also include waters where micro- or macroorganisms are present and waters with changed properties that are closely related to the characteristics of atmosphere, land and surface waters. In Slovenia, such waters are karst waters with a limited self-purification capacity. Other waters are grouped under the term subterranean waters, i.e. groundwater (Pitna voda [Drinking water], National Institute of Public Health).
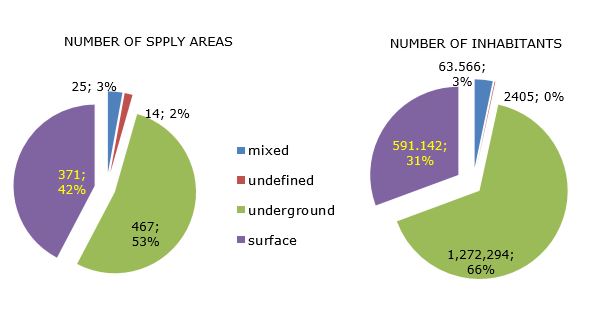
In 2015, 66% (1,272,294) of inhabitants of Slovenia were supplied from groundwater sources in 53% (467) of supply areas, while 31% (591,142) were supplied from surface water sources or water sources under the influence of the surface. 3% (63,566) of inhabitants were supplied from mixed sources (surface as well as subterranean) in 3% (25) of supply areas. Unknown types of untreated water or drinking water sources supplied 2,405 (0.1%) inhabitants in 14 (2%) supply areas (National laboratory of health, environment and food, 2016).
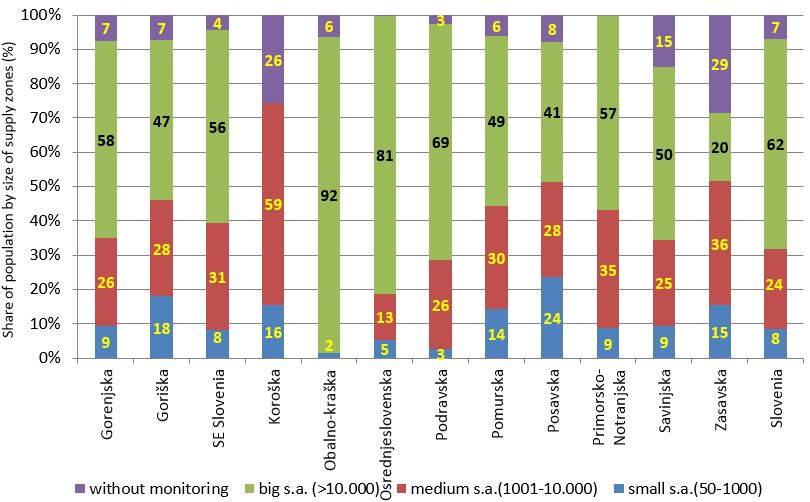
Approximately 93% (or 1,929,407) of the population of the Republic of Slovenia was supplied with drinking water in supply areas that were included in drinking water monitoring in 2015. Of these 93%, two thirds (66% or 1,269,354) were supplied in large supply areas with a supply capacity of more than 10,000 people, while 78% (1,496,212) were supplied in supply areas with a capacity of more than 5,000 people (10% or 83 supply areas). In total, 85% of the population was supplied in supply areas with a capacity of more than 1,000 people, which includes large and mid-sized supply areas (23% or 203 supply areas), while a further 9% were supplied in supply areas with a capacity of 50–1,000 people (77% or 674 supply areas). The remaining 7% of the population was not included in monitoring (no water quality control). In the period 2004–2015, 7–11% of the population supplied from systems with a capacity of fewer than 50 people was not included in monitoring (the lowest number [133,670] in 2015 and the highest [230,371] in 2009). (no water quality control, own drinking water supply) (National laboratory of health, environment and food, 2016).
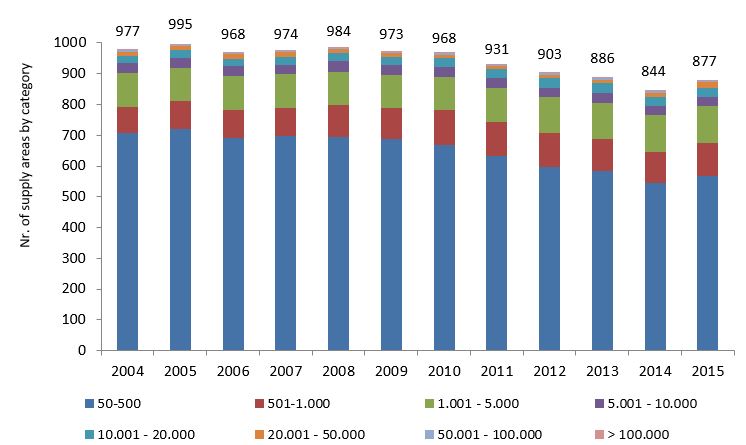
It is evident from the databases on drinking water supply systems and on the compliance of drinking water that the number of supply areas that supplied 50 or more inhabitants was between 844 in 2014 and 995 in 2005. Differences also exist in the number of supply areas with regard to supply capacity, which is a consequence of improving records and the abandonment of small supply areas and connecting of people to larger ones (Institute of Public Health of the Republic of Slovenia, 2005–2008; Institute of Public Health Maribor, 2009–2013; National Laboratory of Health, Environment and Food, 2014–2016).
As regards statistical regions in 2015, the highest percentage of the population living in large supply areas (above-average) was recorded in the Coastal-Kras region (92%), the Central Slovenia region (81%) and the Podravje region (69%). The highest percentages of the population not included in monitoring of drinking water quality lived in the Zasavje region (29%), the Koroška region (26%) and the Savinjska region (15%) (National Laboratory of Health, Environment and Food, 2014–2016).
Drinking water quality was largely adequate in large supply areas, in which about 20% of the population is supplied with drinking water that requires no treatment; these are supply areas with groundwater sources with no treatment, supplying more than 5000 people each (14 supply areas, 410,000 people in total). From the perspective of public health, the smallest supply areas (supplying 50–500 people each) are problematic. In total, 5% of the population is supplied with drinking water in such supply areas. These supply areas are largely microbiologically (faecal contamination in particular) polluted, while the data on their chemical pollution is insufficient – it was only available for 5–10% of supply areas by health region in the period 2006–2010, (other areas each year), and for 10% in 2014 and 2015. Most systems (570 or 65% in 2015) that supply 50–500 people each were included in monitoring due to the requirements of the Rules on drinking water (2004) and the EU Drinking Water Directive (1998). Mostly, these systems do not meet the drinking water requirements and do not provide safe drinking water pursuant to regulations (lack of professional management, poorly managed water protection areas, etc.). They need to be refitted and properly equipped or abandoned and the inhabitants need to be connected to larger, properly managed supply areas (Institute of Public Health of the Republic of Slovenia, 2005–2008; Institute of Public Health Maribor, 2009–2013; National Laboratory of Health, Environment and Food, 2014–2016).
As in previous years, there were two cities in Slovenia in 2015 with more than 100,000 inhabitants each – Ljubljana and Maribor. The populations of both cities live in supply areas that are included in drinking water monitoring. According to the Statistical Office of the Republic of Slovenia (data from 1 July 2015), the populations of Ljubljana and Maribor (399,082 combined) represent 19% of the total Slovenian population. When the urban environment is considered to include cities with a population greater than 100,000 (Ljubljana: 287,347, Maribor: 111,735) and the rural environment is considered to include all other settlements, we can conclude that in Slovenia, all people living in urban environments are supplied with drinking water that is subject to regular monitoring, while the remaining 81% (1,663,995) of the population, which lives in rural areas, is supplied with drinking water that is either monitored/controlled (approx. 92% or 1,530,325 people) or without any quality control (approx. 8% or 133,670 people) (Statistical Office of the Republic of Slovenia, 2015).


