[ZD30] Exposure to ultra-fine particles (nanoparticles) in ambient air 
[ZD30] Exposure to ultra-fine particles (nanoparticles) in ambient air

Key message

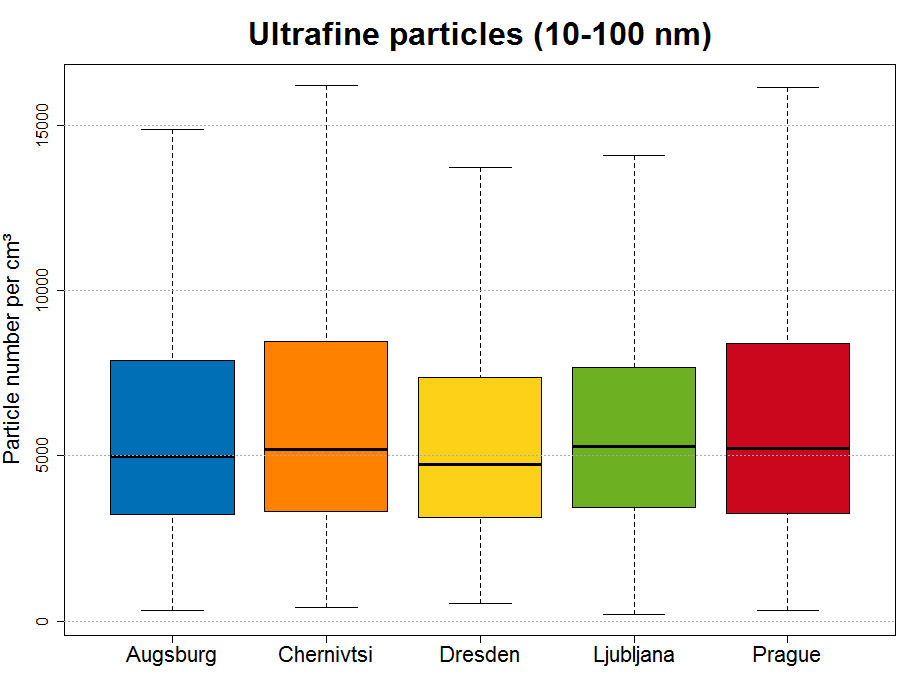
Measurements of particle number concentration of ultrafine particles in ambient air in Ljubljana in period May 2012 -April 2014 is comparable to concentrations in other four European cities. Exposure to ultra-fine particles in the indoor air is roughly comparable or even slightly higher than exposure to ultra-fine particles in ambient air.
Charts
Figure ZD30-1: Particle number concentration (10-100 nm) in ambient air, cities in the UFIREG projects, from May 2012 to April 2014
Sources:
UFIREG project, 2014
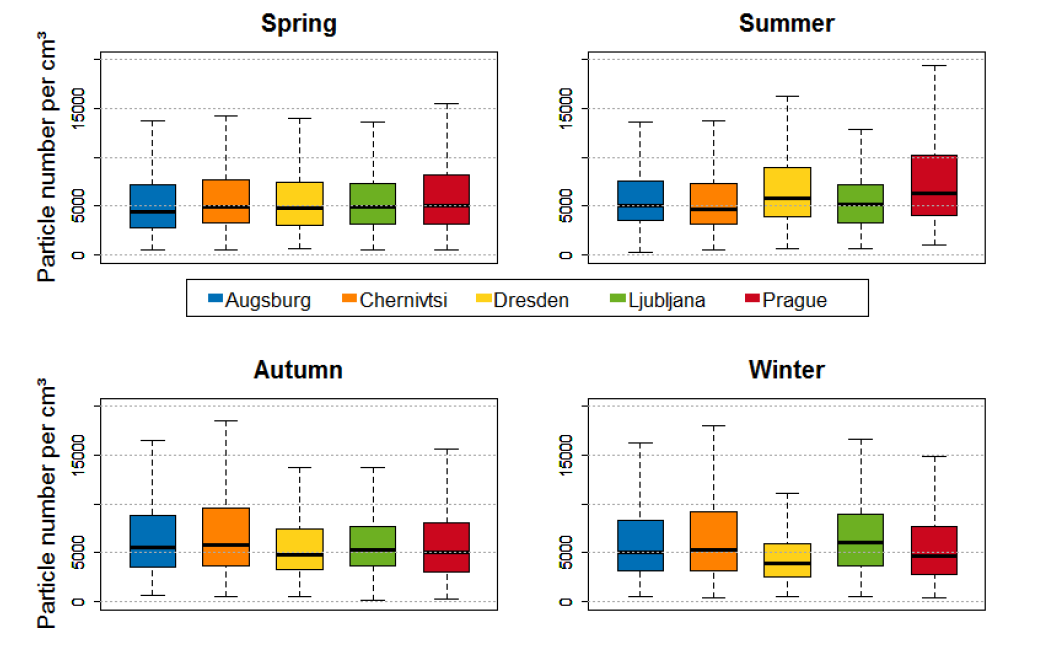
Figure ZD30-2: Fluctuations in the number of ultra-fine particles in ambient air compared to the seasons, cities in the UFIREG projects, from May 2012 to April 2014
Sources:
UFIREG project, 2014
Note:
Footnote 1: Chernivtsi, Ukraine from January 2013 to December 2014.
Footnote 2: The median is shown as the black line.
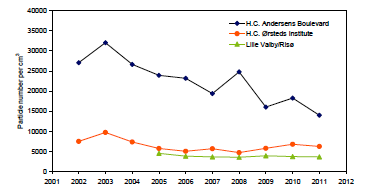
Figure ZD30-3: Average concentrations of the number of ultra-fine particles in ambient air, Copenhagen, 2001-2011
Sources:
The Danish Environmental Protection Agency, 2015
Figure ZD30-4: Particle levels (number concentrations) measured in a test chamber during different activities in the indoor environment
Sources:
The Danish Environmental Protection Agency; Afshari et al., 2005
| Ultrafine particles source | Cmax (particles/cm3) |
|---|---|
| Flat iron (without steam) on a cotton sheet | 550 |
| Flat iron (with steam) on a cotton sheet | 7200 |
| Air-freshener spray | 29900 |
| Scented candles | 69600 |
| Pure wax candle | 241500 |
| Electric stove | 111500 |
| Radiator | 218400 |
| Vacuum cleaner with full bag | 21400 |
| Vacuum cleaner (motor) without bag | 38300 |
| Cigarette | 213300 |
| Gas stove | 79600 |
| Heater | 116800 |
| Frying meat | 150900 |
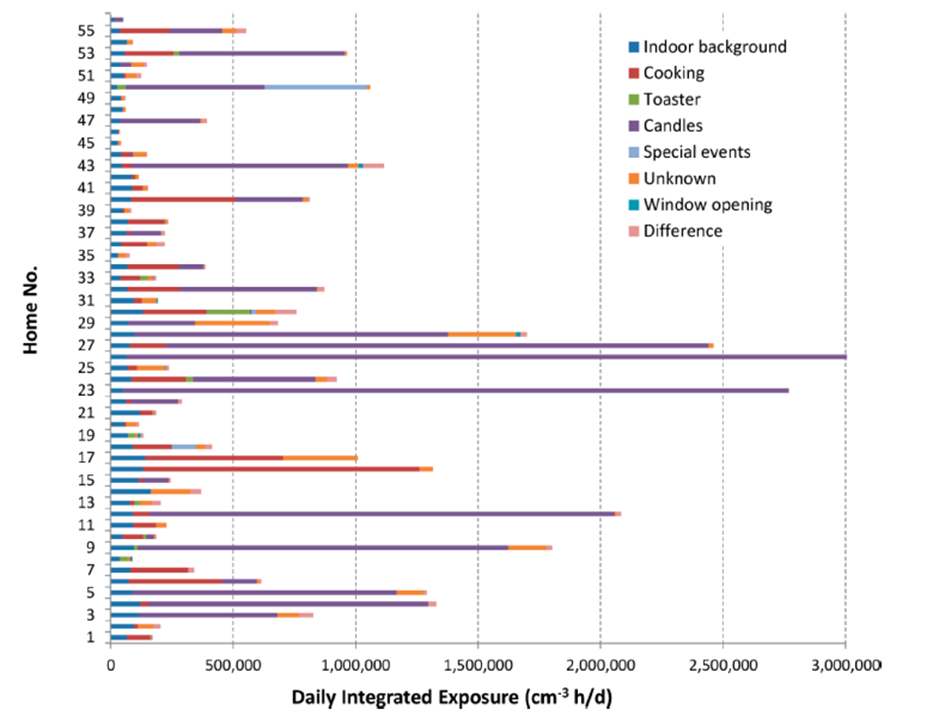
Figure ZD30-5: Contributions of various activities to total daily exposure to ultra-fine particles in the interior air
Sources:
The Danish Environmental Protection Agency; Bekö et al., 2013
Methodology
Date of data source summarization


