[PR02] Volume and structure of freight transport

Key message

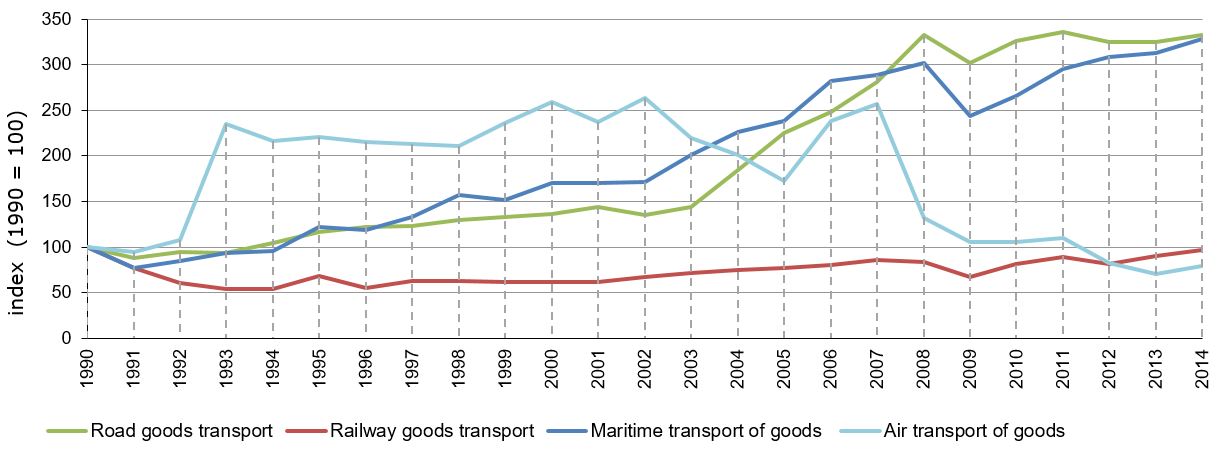
Road freight transport has increased dramatically since Slovenia joined the EU. This is due to the increased volume of tonne-kilometres of Slovenian transport carriers. In the period 2004–2014, road freight transport increased by approximately 80%. Despite the economic crisis in the EU, growth has continued, with the exception of aviation transport. After 2011, the share of road transport stabilised. From an environmental point of view, the growth of road freight transit through Slovenia is alarming, as emissions from freight transit contribute to air pollution and GHG emissions as well.
Definition
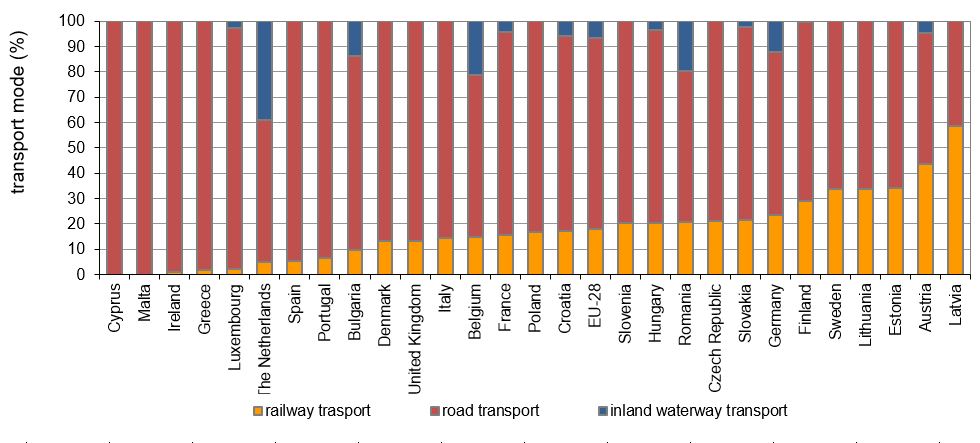
This indicator shows the volume and modal split of freight transport in Slovenia and the modal split of passenger transport in selected EU countries. The data for Slovenia is presented by indices of the development of road and rail transport as well as port and air transport in the period 1990-2014. The data for selected European countries presents the volume and shares of tonne-kilometres in road, rail and inland waterway transport.
A tonne-kilometre (tkm) is a unit of measure of freight transport representing the transport of one tonne of goods over a distance of one kilometre. In rail freight transport we distinguish between gross and net tonne-kilometres. A gross tonne-kilometre is a unit of measure representing the movement over the distance of one kilometre of one tonne of vehicle and its contents excluding the weight of tractive vehicle. A net tonne-kilometre is the sum of the tonnes carried multiplied by the distance travelled.
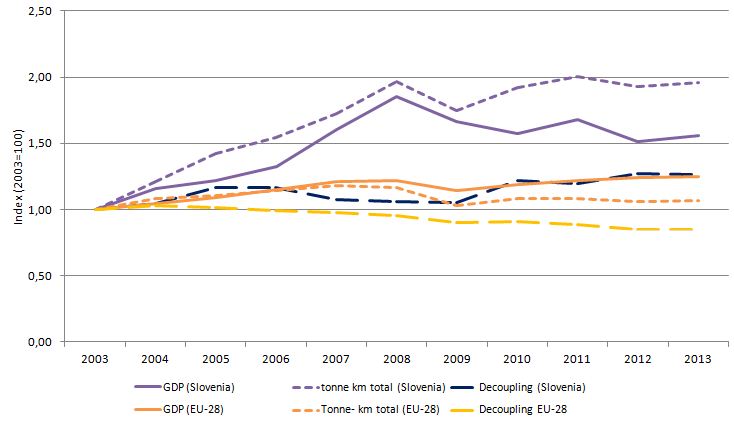
The volume of freight transport is also expressed in relation to gross domestic product (GDP) in Slovenia and the EU-28, indicating potential links between transport growth and economic growth. From an environmental perspective, decoupling of these two parameters is desirable with a view that transport, which burdens the environment, should grow at a slower rate than the economy. The relationship is expressed by a decoupling indicator: a ratio between transport and economy growth rates. The data for Slovenia and the EU-28 countries is presented by indices (the year 2003 = 100) for the period 2003–2014.
Charts
Statistical Office of the Republic of Slovenia: Statistical Yearbook of the Republic of Slovenia 1996-2013 and SI-STAT Data portal, 2015.
| 1990 | 1991 | 1992 | 1993 | 1994 | 1995 | 1996 | 1997 | 1998 | 1999 | ||
|---|---|---|---|---|---|---|---|---|---|---|---|
| Road goods transport | index (1990=100) | 100 | 88.4 | 94.9 | 94 | 104.6 | 116.3 | 121.7 | 123.1 | 129.4 | 133 |
| Railway goods transport | index (1990=100) | 100 | 77.1 | 61.1 | 53.7 | 54.6 | 68.4 | 55.7 | 62.3 | 62.6 | 61.2 |
| Maritime transport of goods | index (1990=100) | 100 | 77.6 | 84.8 | 94.1 | 95.8 | 122.4 | 119.3 | 132.6 | 157 | 152 |
| Air transport of goods | index (1990=100) | 100 | 95.2 | 107.4 | 234.7 | 217 | 220.9 | 215.7 | 213.4 | 211.1 | 236.3 |
| Road goods transport | tkm (mio) | 4887 | 4322 | 4639 | 4596 | 5114 | 5683 | 5948 | 6015 | 6324 | 6500 |
| Railway goods transport | net tkm | 4209 | 3246 | 2573 | 2262 | 2298 | 2881 | 2343 | 2623 | 2635 | 2576 |
| Maritime transport of goods | received and shipped goods (1000 t) | 5484 | 4253 | 4652 | 5159 | 5252 | 6712 | 6543 | 7270 | 8608 | 8337 |
| Air transport of goods | prepeljano blago (t) | 1755 | 1670 | 1885 | 4119 | 3808 | 3877 | 3785 | 3745 | 3705 | 4147 |
| 2000 | 2001 | 2002 | 2003 | 2004 | 2005 | 2006 | 2007 | 2008 | 2009 | ||
| Road goods transport | index (1990=100) | 136.2 | 144 | 135.2 | 144.1 | 184.3 | 225.7 | 247.8 | 281 | 332.7 | 302.1 |
| Railway goods transport | index (1990=100) | 61.8 | 61.9 | 67.5 | 71.7 | 74.8 | 77.1 | 80.1 | 85.6 | 83.6 | 66.9 |
| Maritime transport of goods | index (1990=100) | 170 | 170.6 | 172 | 201.2 | 226.2 | 238.3 | 282.3 | 289.1 | 301.9 | 243.5 |
| Air transport of goods | index (1990=100) | 259.6 | 237.8 | 263.2 | 219.6 | 201.1 | 172.9 | 238.9 | 257 | 132.3 | 105.6 |
| Road goods transport | tkm (mio) | 6654 | 7035 | 6609 | 7040 | 9007 | 11032 | 12112 | 13734 | 16261 | 14762 |
| Railway goods transport | net tkm | 2600 | 2605 | 2839 | 3018 | 3149 | 3245 | 3373 | 3603 | 3520 | 2817 |
| Maritime transport of goods | received and shipped goods (1000 t) | 9322 | 9354 | 9431 | 11036 | 12403 | 13066 | 15483 | 15853 | 16554 | 13356 |
| Air transport of goods | prepeljano blago (t) | 4556 | 4173 | 4620 | 3854 | 3530 | 3035 | 4193 | 4510 | 2321 | 1854 |
| 2010 | 2011 | 2012 | 2013 | 2014 | |||||||
| Road goods transport | index (1990=100) | 326 | 336.4 | 325 | 325 | 333 | |||||
| Railway goods transport | index (1990=100) | 81.3 | 89.1 | 82 | 90 | 97 | |||||
| Maritime transport of goods | index (1990=100) | 266.1 | 295.4 | 308.3 | 313.3 | 328.4 | |||||
| Air transport of goods | index (1990=100) | 105.5 | 110.4 | 83 | 71 | 79 | |||||
| Road goods transport | tkm (mio) | 15931 | 16439 | 15888 | 15905 | 16273 | |||||
| Railway goods transport | net tkm | 3421 | 3752 | 3470 | 3799 | 4110 | |||||
| Maritime transport of goods | received and shipped goods (1000 t) | 14591 | 16198 | 16907 | 17184 | 18012 | |||||
| Air transport of goods | prepeljano blago (t) | 1851 | 1937 | 1474 | 1257 | 1392 |
EUROSTAT, Modal split of freight transport, 2016.
| 2000 | 2001 | 2002 | 2003 | 2004 | 2005 | 2006 | 2007 | 2008 | 2009 | ||
|---|---|---|---|---|---|---|---|---|---|---|---|
| road transport | % | 73 | 74 | 75 | 75 | 76 | 76 | 76 | 76 | 76 | 77 |
| rail transport | % | 20 | 19 | 19 | 19 | 18 | 18 | 18 | 18 | 18 | 17 |
| inland waterway transport | % | 7 | 7 | 6 | 6 | 6 | 6 | 6 | 6 | 6 | 6 |
| 2010 | 2011 | 2012 | 2013 | 2014 | |||||||
| road transport | % | 76 | 76 | 75 | 76 | 75 | |||||
| rail transport | % | 17 | 18 | 18 | 18 | 18 | |||||
| inland waterway transport | % | 7 | 6 | 7 | 7 | 7 |
EUROSTAT, Modal split of freight transport, 2016.
*Note to table PR02-3: Data for Belgium are estimated.
| Cyprus | Malta | Ireland | Greece | Luxembourg | The Netherlands | Spain | Portugal | Bulgaria | Denmark | ||
|---|---|---|---|---|---|---|---|---|---|---|---|
| railway trasport | % | : | : | 1 | 1.6 | 2.1 | 4.9 | 5.2 | 6.5 | 9.5 | 13.2 |
| road transport | % | 100 | 100 | 99 | 98.4 | 95.1 | 56.1 | 94.8 | 93.5 | 76.6 | 86.8 |
| inland waterway transport | % | : | : | : | : | 2.8 | 39 | : | : | 14 | : |
| United Kingdom | Italy | Belgium | France | Poland | Croatia | EU-28 | Slovenia | Hungary | Romania | ||
| railway trasport | % | 13.4 | 14.6 | 14.7 | 15.6 | 16.6 | 17.3 | 18 | 20.2 | 20.5 | 20.7 |
| road transport | % | 86.5 | 85.4 | 64.2 | 80.1 | 83.3 | 76.8 | 75.4 | 79.8 | 75.8 | 59.4 |
| inland waterway transport | % | 0.1 | 0 | 21.1 | 4.3 | 0 | 5.9 | 6.6 | : | 3.7 | 19.9 |
| Czech Republic | Slovakia | Germany | Finland | Sweden | Lithuania | Estonia | Austria | Latvia | |||
| railway trasport | % | 21.2 | 21.5 | 23.4 | 29 | 33.7 | 33.8 | 34 | 43.6 | 58.7 | |
| road transport | % | 78.7 | 76.3 | 64.4 | 70.6 | 66.3 | 66.2 | 66 | 51.7 | 41.3 | |
| inland waterway transport | % | 0 | 2.2 | 12.3 | 0.4 | : | 0 | : | 4.6 | : |
European Commission, Statistical pocketbook 2013, Performance of freight transport (tkm), 2015.
| 1995 | 1996 | 1997 | 1998 | 1999 | 2000 | 2001 | 2002 | 2003 | 2004 | ||
|---|---|---|---|---|---|---|---|---|---|---|---|
| Road transport | bil tkm | 1288.7 | 1302.6 | 1351.7 | 1414.2 | 1460.6 | 1509.5 | 1552.5 | 1602.8 | 1607.7 | 1750.9 |
| Railway transport | bil tkm | 388.1 | 393.9 | 411.3 | 394.3 | 385.3 | 405.5 | 388 | 386 | 394.4 | 419.3 |
| inland waterways | bil tkm | 122.1 | 119.8 | 127.9 | 131.1 | 128.8 | 133.9 | 132.6 | 132.6 | 123.6 | 136.9 |
| pipe-lines | bil tkm | 114.9 | 119.3 | 118.9 | 126.3 | 124.9 | 127.1 | 133.9 | 129.7 | 131.7 | 133.3 |
| sea transport | bil tkm | 930.4 | 941.7 | 968.5 | 1000.2 | 1029.4 | 1066.8 | 1083 | 1100.1 | 1118.7 | 1158.5 |
| Air transport of goods | bil tkm | 1.8 | 1.8 | 1.9 | 2 | 2 | 2.2 | 2.2 | 2.1 | 2.1 | 2.2 |
| Total | bil tkm | 2845.9 | 2879.1 | 2980.2 | 3068.1 | 3131 | 3244.9 | 3292.3 | 3353.3 | 3378.2 | 3601.1 |
| 2005 | 2006 | 2007 | 2008 | 2009 | 2010 | 2011 | 2012 | 2013 | |||
| Road transport | bil tkm | 1794.6 | 1857.7 | 1925 | 1891.1 | 1699.8 | 1755.3 | 1743.9 | 1692.6 | 1719.4 | |
| Railway transport | bil tkm | 416 | 438.2 | 452 | 442.8 | 363.5 | 393.5 | 422.1 | 406.7 | 406.5 | |
| inland waterways | bil tkm | 138.8 | 138.6 | 145.1 | 146.1 | 130.5 | 155.5 | 142 | 150 | 152.7 | |
| pipe-lines | bil tkm | 137.6 | 136.6 | 128.5 | 124.9 | 121.8 | 121.1 | 118.4 | 114.9 | 111.8 | |
| sea transport | bil tkm | 1198.1 | 1224.4 | 1189.9 | 1163.9 | 1062.4 | 1117.8 | 1133.2 | 1113.1 | 1088.6 | |
| Air transport of goods | bil tkm | 2.3 | 2.3 | 2.4 | 2.4 | 2.2 | 2.3 | 2.3 | 2.3 | 2.2 | |
| Total | bil tkm | 3687.4 | 3797.8 | 3842.8 | 3771.3 | 3380.2 | 3545.6 | 3561.7 | 3479.5 | 3481.4 |
European Commission, Statistical pocketbook 2015, Performance of freight transport (tkm), 2015; Eurostat, Annual national accounts; SISTAT, Ekonomsko področje, Bruto domači proizvod
| 2003 | 2004 | 2005 | 2006 | 2007 | 2008 | 2009 | 2010 | 2011 | 2012 | ||
|---|---|---|---|---|---|---|---|---|---|---|---|
| GDP (Slovenia) | index | 1 | 1.2 | 1.2 | 1.3 | 1.6 | 1.9 | 1.7 | 1.6 | 1.7 | 1.5 |
| tonne km total (Slovenia) | index | 1 | 1.2 | 1.4 | 1.5 | 1.7 | 2 | 1.7 | 1.9 | 2 | 1.9 |
| Decoupling (Slovenia) | / | 1 | 1 | 1.2 | 1.2 | 1.1 | 1.1 | 1.1 | 1.2 | 1.2 | 1.3 |
| GDP (EU-28) | index | 1 | 1 | 1.1 | 1.2 | 1.2 | 1.2 | 1.1 | 1.2 | 1.2 | 1.2 |
| Tonne- km total (EU-28) | index | 1 | 1.1 | 1.1 | 1.1 | 1.2 | 1.2 | 1 | 1.1 | 1.1 | 1.1 |
| Decoupling EU-28 | / | 1 | 1 | 1 | 1 | 1 | 1 | 0.9 | 0.9 | 0.9 | 0.9 |
| 2013 | |||||||||||
| GDP (Slovenia) | index | 1.6 | |||||||||
| tonne km total (Slovenia) | index | 2 | |||||||||
| Decoupling (Slovenia) | / | 1.3 | |||||||||
| GDP (EU-28) | index | 1.2 | |||||||||
| Tonne- km total (EU-28) | index | 1.1 | |||||||||
| Decoupling EU-28 | / | 0.9 |
Goals
- To decouple transport growth from economic growth (GDP) with a goal to reduce negative impacts of transport on the environment and to reduce traffic jams.
- In the EU, 30% of road freight transport over a distance of more than 300 km should shift to other modes (rail or waterborne transport) by 2030 and 50% by 2050. In this way, efficient and environmentally friendly transport corridors would be established.
Comment
From an environmental perspective, differences in environmental efficiency of transport modes (impact on the use of resources, emissions of greenhouse gases and other air pollutants, noise pollution, land use, accidents) are important for monitoring the volume and structure of freight transport. The differences enable us to influence environmental consequences of freight transport and traffic through transport policy measures that lead to changes in the modal split.
Based on the existing sources, it is hard to estimate the volume and structure of goods by mode of transport in Slovenia. The problem is the non-availability of data on tonne-kilometres performed by foreign carriers on Slovenian roads and tonne-kilometres performed by Slovenian carriers abroad.
According to estimates, the shares of road freight transport in Slovenia are unfavourable. It is evident from the available data that road freight transport grows at the fastest rate and is taking over an increasing percentage of freight carriage in Slovenia, especially after its joining the EU. The volume of freight carried by domestic carriers expressed in tonne-kilometres grew by 81% in the period 2004–2014. In the same period, the volume of rail freight transport increased by 31%.
Before Slovenia entered the EU, the growth of road and rail transport was moderate. From 1993 onwards, road transport grew at a rate of 6% per year, while the growth of rail transport was 3% per year (Šegan, 2005). Although road freight transit through Slovenia raises concern as well, it is no longer included in statistical monitoring after Slovenia joined the Schengen area and can only be estimated indirectly. In the period 2000–2004, it grew at an average rate of 10% per year, but after Slovenia joined the EU, the growth rate took a sharp upturn – the number of border crossings of cargo vehicles from/into Hungary increased by 112% in the period 2004–2007 (the Hungarian Police Service, 2009). An estimate of the volume of freight transport, which is conducted every year by the Directorate of the Republic of Slovenia for Roads, confirms a high growth rate of road freight transport in Slovenia in recent years. It has been estimated that in the period 2000–2010, transport by light, medium and heavy trucks and haulers increased by 97% on Slovenian state roads. Transport with light and medium trucks in the same period grew by around 68%, while transport with heavy trucks and haulers grew by 148% (Directorate of the RS for Roads, 2012)
Port transport, and specifically the Port of Koper as the most important freight terminal in the country, is an important source and destination of cargo flows. The volume of port transport in the period 1990–2014 increased by almost three times and was even growing (except in 2009) during the economic recession.
The volume of air freight transport, which is mostly carried out through Ljubljana’s Jože Pučnik Airport, has been fluctuating greatly from year to year. The lowest volume of air freight transport (below 2,000 tonnes per year) was recorded in the years 1990–1992 and 2009–2011. The largest volumes of cargo (over 4,500 tonnes per year) were carried in the years of 2000, 2002 and 2007. The last notable increase in the period 2006–2008 can be attributed to the positive effects of Slovenia's joining the EU, while the addition of a new business partner for express mail delivery in 2006 at Ljubljana’s Jože Pučnik Airport contributed a lot to this increase; namely, the airport was used as a transport logistics centre for the further dispatching of consignments to other parts of south eastern Europe. After 2007, the volume of airport cargo transport dropped drastically. In the period 2013–2014, the volume of air freight transport increased slightly, but not as high as during its peak level in 2007.
Considering the state of transport policy and the (non)competitiveness of railways in Slovenia, we can expect a continuation of unfavourable development, i.e. an increase in the volume and share of road freight transport and a decrease in the share of rail freight transport. On the free market of transport services, which does not include all costs caused by individual transport modes, road freight transport is more competitive, since, as a rule, it is faster, cheaper, more reliable and more adjustable than other transport modes. Such trends are also accelerated by production and trade processes; for instance, delivery on time, which demands an adjustable transport mode. At the same time, production and trade involving cargo of higher values has been increasing, which is dominated by road transport; on the other hand, the production and trade of bulk cargo, which was traditionally transported by rail, has been decreasing. An additional impulse for road freight transport in Slovenia was its entry into the EU, which eliminated administrative barriers at borders. Moreover, the harmonisation of national railway systems, which will enable more fluid rail transport across borders, is still under way.
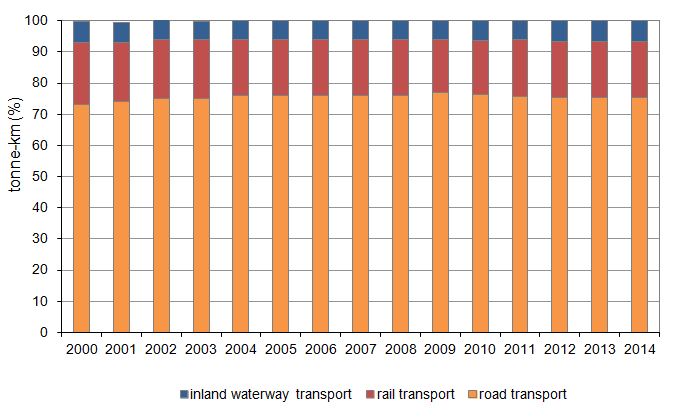
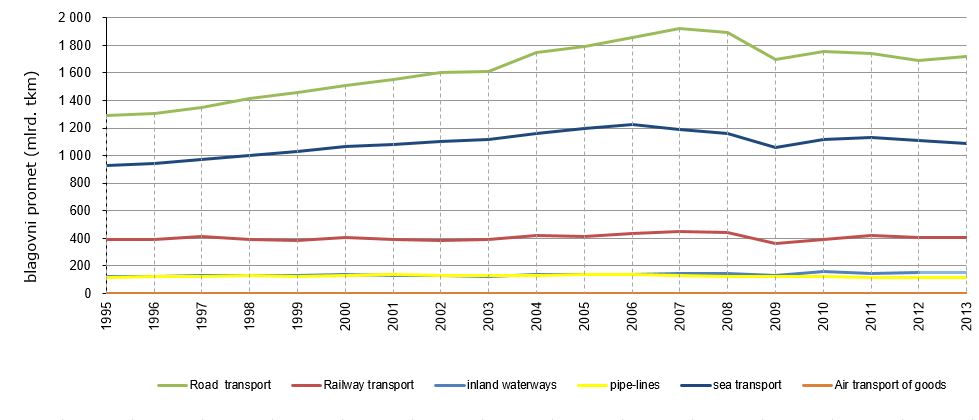
The volume of freight transport in Europe is increasing slightly faster than the economy, with road and maritime freight transport recording the highest growth rates. In the EU-28 countries, the mode of road transport predominates in freight transport. Its share in 2014 was 75%. Since 2009, the share of road transport has been decreasing slightly, while the shares of rail and inland waterway transport have been increasing slightly.
After 2008, the connection between the growth in freight transport and economic growth decoupled for the first time in many years; however, it is not clear whether this is a long-term trend, as the decrease was probably related to the effects of the economic crisis. The impact of the economic crisis is most notable in road and maritime transport, where a considerable decline in freight transport was observed in the second half of 2008 and continued until 2010. Freight transport in Slovenia began to increase after joining the European Union when domestic, as well as transit freight transport, increased noticeably. The largest number of performed tonne-kilometres was recorded in 2007. In the period 2003–2007, the number of performed tonne-kilometres increased by approximately 16%. Due to the economic recession, the volume of freight transport decreased by 10% in the period 2007–2013. The GDP grew at a slower rate than freight transport and stagnated during the economic crisis. In the EU-28 countries, the GDP grew at a slower rate until 2009, after which a shift followed, due to the economic crisis. In the period 2009–2013, the GDP increased by 9%. The number of tonne-kilometres in the EU-28 increased until 2008, after which an 8% decrease followed by 2013.


