[ZR10] Emissions of ozone precursors

Key message

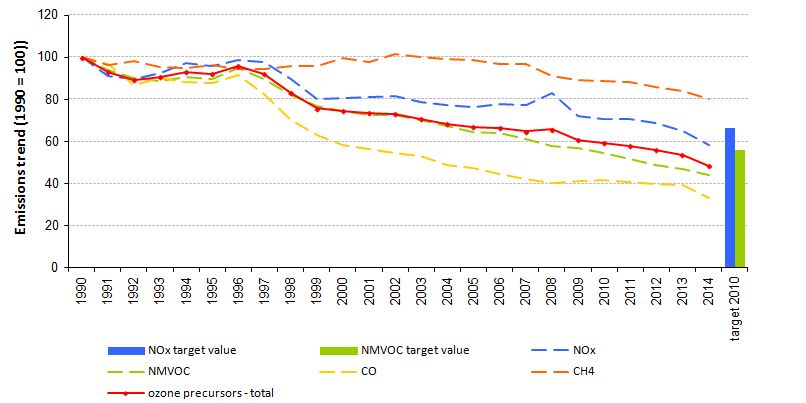
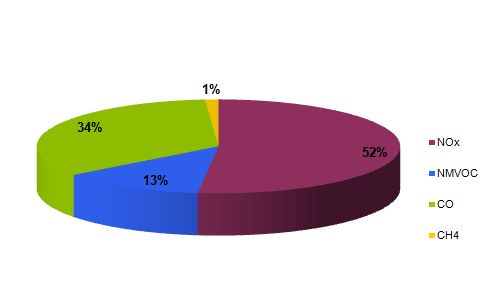
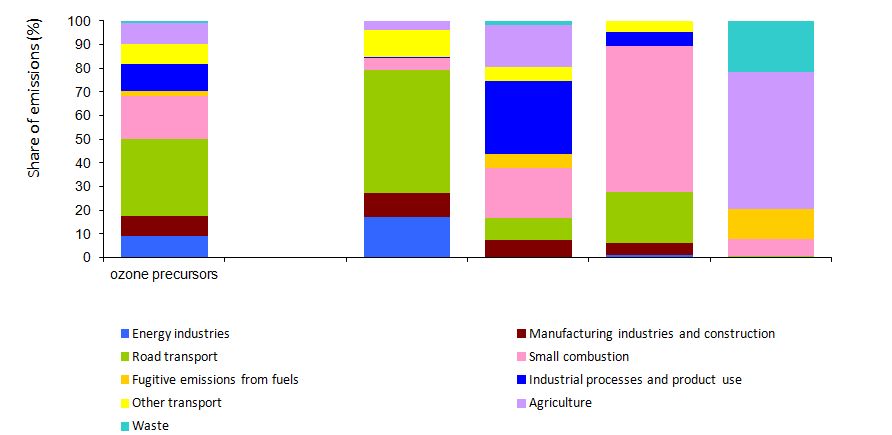
In the period 1990–2014, emissions of total ozone precursors decreased by 51%. Emissions of nitrogen oxides decreased by 42%, carbon monoxide by 67%, non-methane volatile organic compounds by 56% and methane by 20%. The decrease is mainly a consequence of the introduction of more stringent emission standards for motor vehicles. This measure contributed to a significant reduction in emissions of nitrogen oxides and carbon dioxide from road transport, which is the main source of ozone precursors. In 2014, emissions of nitrogen oxides and non-methane volatile organic compounds were below the prescribed target values that are not to have been exceeded from 2010 onwards.
Charts
National database on air emissions, Slovenian Environment Agency, 2016
| 1990 | 1991 | 1992 | 1993 | 1994 | 1995 | 1996 | 1997 | 1998 | 1999 | ||
|---|---|---|---|---|---|---|---|---|---|---|---|
| NOx | kt NMVOC equivalents | 82.5 | 75.15 | 74.19 | 76.45 | 80.37 | 79.18 | 81.57 | 80.83 | 73.94 | 66.09 |
| CO | kt NMVOC equivalents | 35.64 | 34.48 | 30.99 | 32.19 | 31.44 | 31.35 | 32.57 | 29.4 | 25.03 | 22.46 |
| NMVOC | kt NMVOC equivalents | 71.66 | 67.23 | 64.46 | 63.56 | 64.88 | 64.23 | 68 | 64.27 | 58.73 | 54.93 |
| CH4 | kt NMVOC equivalents | 1.38 | 1.34 | 1.36 | 1.32 | 1.32 | 1.33 | 1.31 | 1.31 | 1.33 | 1.33 |
| ozone precursors - total | kt NMVOC equivalents | 191.18 | 178.2 | 170.99 | 173.51 | 178.01 | 176.09 | 183.44 | 175.81 | 159.03 | 144.81 |
| NOx | index (1990 = 100) | 100 | 91.1 | 89.93 | 92.67 | 97.43 | 95.98 | 98.87 | 97.98 | 89.62 | 80.11 |
| CO | index (1990 = 100) | 100 | 96.74 | 86.94 | 90.32 | 88.2 | 87.95 | 91.38 | 82.5 | 70.22 | 63.01 |
| NMVOC | index (1990 = 100) | 100 | 93.82 | 89.95 | 88.69 | 90.54 | 89.64 | 94.9 | 89.69 | 81.97 | 76.66 |
| CH4 | index (1990 = 100) | 100 | 96.48 | 98.32 | 95.24 | 95.11 | 96.25 | 94.62 | 94.34 | 95.92 | 96.04 |
| ozone precursors - total | index (1990 = 100) | 100 | 93.21 | 89.44 | 90.76 | 93.11 | 92.11 | 95.95 | 91.96 | 83.18 | 75.75 |
| NOx target value | index (1990 = 100) | ||||||||||
| NMVOC target value | index (1990 = 100) | ||||||||||
| 2000 | 2001 | 2002 | 2003 | 2004 | 2005 | 2006 | 2007 | 2008 | 2009 | ||
| NOx | kt NMVOC equivalents | 66.4 | 67.01 | 67.43 | 64.98 | 63.96 | 63.11 | 64.12 | 63.69 | 68.65 | 59.68 |
| CO | kt NMVOC equivalents | 20.85 | 20.11 | 19.41 | 18.96 | 17.46 | 16.9 | 15.82 | 14.97 | 14.41 | 14.77 |
| NMVOC | kt NMVOC equivalents | 53.53 | 51.9 | 51.86 | 50.26 | 48.2 | 46.4 | 46 | 43.85 | 41.46 | 40.83 |
| CH4 | kt NMVOC equivalents | 1.38 | 1.36 | 1.41 | 1.38 | 1.37 | 1.37 | 1.34 | 1.34 | 1.26 | 1.24 |
| ozone precursors - total | kt NMVOC equivalents | 142.16 | 140.39 | 140.11 | 135.57 | 130.99 | 127.78 | 127.28 | 123.86 | 125.78 | 116.52 |
| NOx | index (1990 = 100) | 80.49 | 81.23 | 81.74 | 78.76 | 77.53 | 76.49 | 77.73 | 77.21 | 83.21 | 72.35 |
| CO | index (1990 = 100) | 58.51 | 56.43 | 54.46 | 53.19 | 48.98 | 47.41 | 44.37 | 42 | 40.44 | 41.44 |
| NMVOC | index (1990 = 100) | 74.71 | 72.44 | 72.37 | 70.13 | 67.27 | 64.76 | 64.2 | 61.2 | 57.86 | 56.97 |
| CH4 | index (1990 = 100) | 99.5 | 98 | 101.8 | 100 | 99.1 | 98.63 | 96.78 | 96.79 | 90.96 | 89.31 |
| ozone precursors - total | index (1990 = 100) | 74.36 | 73.43 | 73.29 | 70.91 | 68.52 | 66.83 | 66.58 | 64.79 | 65.79 | 60.95 |
| NOx target value | index (1990 = 100) | ||||||||||
| NMVOC target value | index (1990 = 100) | ||||||||||
| 2010 | 2011 | 2012 | 2013 | 2014 | target 2010 | ||||||
| NOx | kt NMVOC equivalents | 58.41 | 58.14 | 56.82 | 53.66 | 48.15 | 54.9 | ||||
| CO | kt NMVOC equivalents | 14.87 | 14.54 | 14.15 | 13.99 | 11.9 | |||||
| NMVOC | kt NMVOC equivalents | 39.18 | 37.12 | 35.07 | 33.56 | 31.77 | 40 | ||||
| CH4 | kt NMVOC equivalents | 1.23 | 1.22 | 1.19 | 1.16 | 1.11 | |||||
| ozone precursors - total | kt NMVOC equivalents | 113.7 | 111.02 | 107.24 | 102.38 | 92.92 | |||||
| NOx | index (1990 = 100) | 70.81 | 70.48 | 68.88 | 65.05 | 58.36 | |||||
| CO | index (1990 = 100) | 41.73 | 40.79 | 39.7 | 39.25 | 33.39 | |||||
| NMVOC | index (1990 = 100) | 54.68 | 51.8 | 48.94 | 46.84 | 44.33 | |||||
| CH4 | index (1990 = 100) | 88.53 | 88.3 | 86.09 | 84.17 | 80.07 | |||||
| ozone precursors - total | index (1990 = 100) | 59.47 | 58.07 | 56.09 | 53.55 | 48.61 | |||||
| NOx target value | index (1990 = 100) | 66.55 | |||||||||
| NMVOC target value | index (1990 = 100) | 55.82 |
National database on air emissions, Slovenian Environment Agency, 2016
| 2014 | ||
|---|---|---|
| NOx | kt NMVOC equivalents | 48 |
| NMVOC | kt NMVOC equivalents | 12 |
| CO | kt NMVOC equivalents | 32 |
| CH4 | kt NMVOC equivalents | 1 |
| ozone precursors - total | kt NMVOC equivalents | 93 |
| NOx | % | 52 |
| NMVOC | % | 13 |
| CO | % | 34 |
| CH4 | % | 1 |
National database on air emissions, Slovenian Environment Agency, 2016
| ozone precursors | - | NOx | NMVOC | CO | CH4 | ||
|---|---|---|---|---|---|---|---|
| Energy industries | kt NMVOC equivalents | 8.46 | 8.2 | 0.13 | 0.13 | 0 | |
| Manufacturing industries and construction | kt NMVOC equivalents | 7.71 | 4.96 | 2.16 | 0.58 | 0 | |
| Road transport | kt NMVOC equivalents | 30.48 | 24.92 | 2.98 | 2.57 | 0 | |
| Small combustion | kt NMVOC equivalents | 16.73 | 2.52 | 6.79 | 7.35 | 0.08 | |
| Fugitive emissions from fuels | kt NMVOC equivalents | 2.03 | 0 | 1.89 | 0 | 0.14 | |
| Industrial processes and product use | kt NMVOC equivalents | 10.76 | 0.23 | 9.8 | 0.73 | 0 | |
| Other transport | kt NMVOC equivalents | 7.8 | 5.4 | 1.86 | 0.54 | 0 | |
| Agriculture | kt NMVOC equivalents | 8.19 | 1.9 | 5.65 | 0 | 0.64 | |
| Waste | kt NMVOC equivalents | 0.78 | 0.03 | 0.51 | 0 | 0.24 | |
| Total | kt NMVOC equivalents | 92.92 | 48.15 | 31.77 | 11.9 | 1.11 | |
| Energy industries | % | 9.1 | 17.03 | 0.4 | 1.09 | 0.12 | |
| Manufacturing industries and construction | % | 8.29 | 10.3 | 6.8 | 4.88 | 0.26 | |
| Road transport | % | 32.8 | 51.76 | 9.39 | 21.61 | 0.35 | |
| Small combustion | % | 18 | 5.22 | 21.36 | 61.74 | 7.16 | |
| Fugitive emissions from fuels | % | 2.19 | 0.01 | 5.95 | 0.01 | 12.55 | |
| Industrial processes and product use | % | 11.58 | 0.47 | 30.85 | 6.15 | 0 | |
| Other transport | % | 8.39 | 11.22 | 5.84 | 4.52 | 0 | |
| Agriculture | % | 8.81 | 3.94 | 17.78 | 0 | 58.01 | |
| Waste | % | 0.84 | 0.05 | 1.62 | 0 | 21.54 |
CLRTAP/EMEP, CEIP, 2016, European Environment Agency, 2015, EEA Greenhouse gas data viewer, European Environment Agency, 2015, Eurostat, 2016
Notes to table ZR10-4:1- Data for Greece are not availible.2- Data from EEA are from 2013, the rest are from 2014.
| Luxembourg | Latvia | Estonia | Finland | Denmark | Poland | Slovenia | Lithuania | Austria | Ireland | ||
|---|---|---|---|---|---|---|---|---|---|---|---|
| NOx | kt NMVOC equivalents | 38.35 | 41.53 | 36.26 | 176.75 | 151.12 | 973.84 | 52.33 | 56.32 | 198.03 | 96.46 |
| NMVOC | kt NMVOC equivalents | 7.65 | 87.45 | 32.93 | 94.56 | 114.43 | 635.78 | 33.32 | 63.39 | 126.34 | 90 |
| CO | kt NMVOC equivalents | 3.28 | 16.34 | 17.37 | 40.6 | 37.27 | 316.4 | 17.1 | 16.1 | 64.06 | 13.55 |
| CH4 | kt NMVOC equivalents | 0.28 | 1.09 | 0.62 | 2.72 | 3.66 | 27.36 | 1.25 | 2.03 | 3.54 | 8.05 |
| emissions of ozone precursors | kt NMVOC equivalents | 49.57 | 146.41 | 87.18 | 314.63 | 306.48 | 1953.38 | 104 | 137.85 | 391.97 | 208.06 |
| population by countries | number | 549680 | 2001468 | 1315819 | 5451270 | 5617345 | 38017856 | 2061085 | 2943472 | 8506889 | 4605501 |
| emissions per capita | kg/capita | 90.17 | 73.15 | 66.26 | 57.72 | 54.56 | 51.38 | 50.46 | 46.83 | 46.08 | 45.18 |
| Greece | Belgium | Sweden | Czech Republic | Portugal | EU28 | Bulgaria | Germany | Spain | Italy | ||
| NOx | kt NMVOC equivalents | 291.12 | 253.37 | 153.62 | 220.93 | 197 | 9975.27 | 149.54 | 1548.4 | 990.82 | 1001.1 |
| NMVOC | kt NMVOC equivalents | 144.77 | 137.43 | 173.76 | 136.4 | 169.63 | 7004.93 | 88.83 | 1138.24 | 550.8 | 905.54 |
| CO | kt NMVOC equivalents | 44.57 | 60.83 | 61.77 | 57.12 | 31.72 | 2441.89 | 33.24 | 339.78 | 188.03 | 282.8 |
| CH4 | kt NMVOC equivalents | 6.47 | 4.26 | 3.2 | 6.84 | 8.17 | 267.84 | 4.79 | 32.47 | 21.55 | 24.05 |
| emissions of ozone precursors | kt NMVOC equivalents | 486.92 | 455.89 | 392.35 | 421.29 | 406.51 | 19689.93 | 276.4 | 3058.89 | 1751.2 | 2213.49 |
| population by countries | number | 10926807 | 11203992 | 9644864 | 10512419 | 10427301 | 506880616 | 7245677 | 80767463 | 46512199 | 60782668 |
| emissions per capita | kg/capita | 44.56 | 40.69 | 40.68 | 40.08 | 38.99 | 38.85 | 38.15 | 37.87 | 37.65 | 36.42 |
| United Kingdom | France | Slovakia | Romania | Cyprus | Croatia | Hungary | Netherlands | Malta | |||
| NOx | kt NMVOC equivalents | 1244 | 1207.22 | 97.09 | 266.96 | 19.72 | 68.01 | 147.09 | 292.33 | 5.94 | |
| NMVOC | kt NMVOC equivalents | 803 | 758.38 | 63.2 | 322.95 | 6.68 | 46.07 | 120.4 | 149.68 | 3.32 | |
| CO | kt NMVOC equivalents | 216.78 | 351.57 | 24.02 | 83.67 | 1.65 | 16.79 | 35.81 | 68.29 | 1.35 | |
| CH4 | kt NMVOC equivalents | 34.97 | 34.25 | 2.88 | 14.82 | 0.87 | 2.28 | 5.33 | 9.96 | 0.07 | |
| emissions of ozone precursors | kt NMVOC equivalents | 2298.75 | 2351.42 | 187.2 | 688.41 | 28.92 | 133.16 | 308.63 | 520.27 | 10.68 | |
| population by countries | number | 64351155 | 65835579 | 5415949 | 19947311 | 858000 | 4246809 | 9877365 | 16829289 | 425384 | |
| emissions per capita | kg/capita | 35.72 | 35.72 | 34.57 | 34.51 | 33.71 | 31.36 | 31.25 | 30.91 | 25.12 |


![Figure ZR10-4: Emissions of ozone-precursors, EU-28 countries, 2014 [in kg / capita]](/sites/default/files/charts/migrated_charts/graph_15980_en.jpg)