[EN30] Production and consumption of electricity

Key message

In 2014, an important change in the structure of electricity production occurred. For the first time since 1994, most electricity was no longer produced from nuclear energy but from RES, while the third place was taken by solid fuels. The share of production from gaseous fuels was small. The share of electricity production from domestic sources was 93%, which was above the target share set in the Resolution on the National Energy Programme. Total production of electricity in Slovenia exceeded gross consumption by 21%.
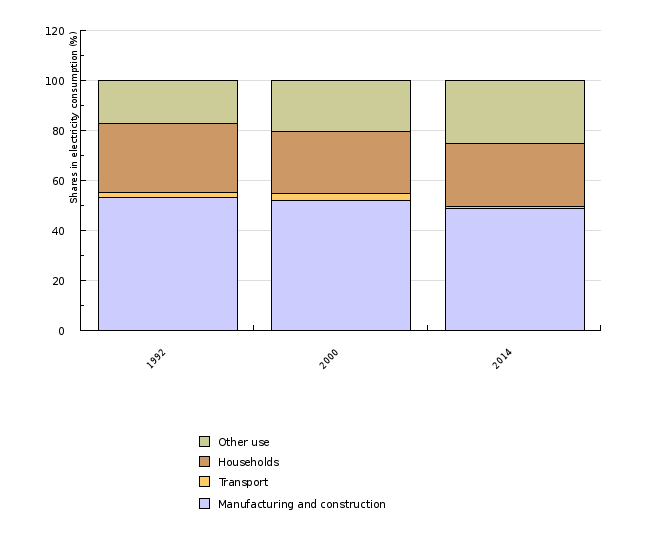
Electricity consumption was reduced in 2014, which is especially a consequence of consumption reduction in the sector 'other uses'. In the period 2000–2014, the average annual growth rate was 1.2%. The peak was reached in 2007. After 2011, consumption stabilized. Almost half of electricity is used in industry and the services sector and households follow with a quarter share each.
Definition
This indicator combines the indicators EN17 (Electricity production by fuel type) and EN12 (Electricity consumption). The indicator “Electricity production by fuel type” shows gross electricity production in the country by fuel type. It includes electricity production in large power plants, production of self-producers and production of privately owned power plants.
Electricity production by fuel type is an important indicator of emission trends, as electricity production contributes approximately one third of all greenhouse gas and particulate matter emissions (secondary: SO2, NOx, NH3; primary: PM10). From the perspective of emissions, the most environmentally harmful method of electricity production is the use of fossil fuels; however, great differences exist within the group of fossil fuels. Among them, gaseous fuels are most environmentally friendly – compared to solid fossil fuels, they cause 50% less greenhouse gas emissions and very low particulate matter emissions. Liquid fuels fall in between solid and gaseous fuels as regards to emissions. The use of nuclear energy causes no emissions, however, it is controversial due to the hazard of nuclear accidents and the issues relating to the disposal of nuclear waste, which represents a large environmental problem. The most environmentally friendly electricity production is based on the use of renewable energy sources. This, however, doesn't mean that the use of renewable energy sources doesn’t affect the environment – differences exist between the sources and projects when using the same source.
Charts
Statistical office RS, 2015
| 1992 | 1993 | 1994 | 1995 | 1996 | 1997 | 1998 | 1999 | 2000 | 2001 | ||
|---|---|---|---|---|---|---|---|---|---|---|---|
| Solid fuels (coal and lignite) | GWh | 4370 | 4432 | 4336 | 4343 | 4673 | 4710 | 4988 | 4480 | 4611 | 4919 |
| Liquid fuels | GWh | 307 | 259 | 269 | 261 | 261 | 345 | 140 | 142 | 55 | 126 |
| Gaseous fuels | GWh | 25 | 23 | 18 | 30 | 8 | 10 | 109 | 172 | 293 | 296 |
| Nuclear | GWh | 3971 | 3956 | 4609 | 4779 | 4562 | 5019 | 5019 | 4696 | 4761 | 5257 |
| Renewables (hydropower, wood, biofuels, PV) | GWh | 3413 | 3022 | 3399 | 3241 | 3449 | 3092 | 3449 | 3772 | 3904 | 3868 |
| Total | GWh | 12086 | 11692 | 12631 | 12654 | 12953 | 13176 | 13705 | 13262 | 13624 | 14466 |
| 2002 | 2003 | 2004 | 2005 | 2006 | 2007 | 2008 | 2009 | 2010 | 2011 | ||
| Solid fuels (coal and lignite) | GWh | 5303 | 5108 | 5192 | 5275 | 5460 | 5485 | 5323 | 5131 | 5289 | 5308 |
| Liquid fuels | GWh | 66 | 50 | 43 | 37 | 45 | 29 | 17 | 28 | 9 | 17 |
| Gaseous fuels | GWh | 289 | 370 | 358 | 340 | 373 | 452 | 475 | 594 | 548 | 489 |
| Nuclear | GWh | 5528 | 5207 | 5459 | 5884 | 5548 | 5695 | 6273 | 5739 | 5657 | 6215 |
| Renewables (hydropower, wood, biofuels, PV) | GWh | 3414 | 3080.1 | 4215.6 | 3575.4 | 3683.1 | 3377.1 | 4306.9 | 4904.7 | 4740.4 | 3875.4 |
| Total | GWh | 14600 | 13821 | 15273 | 15117 | 15114 | 15043 | 16398 | 16401 | 16433 | 16056 |
| 2012 | 2013 | 2014 | |||||||||
| Solid fuels (coal and lignite) | GWh | 5145 | 4876.5 | 3758.8 | |||||||
| Liquid fuels | GWh | 9 | 7.5 | 41.9 | |||||||
| Gaseous fuels | GWh | 532 | 509 | 373.6 | |||||||
| Nuclear | GWh | 5528 | 5300 | 6370 | |||||||
| Renewables (hydropower, wood, biofuels, PV) | GWh | 4320.9 | 5108.7 | 6611.4 | |||||||
| Total | GWh | 15729 | 16103.1 | 17436.9 |
Statistical office RS, 2015; Eurostat, 2015
| EU-28 2000 | EU-15 2000 | EU-10 2000 | SI 2000 | - | EU-28 2013 | EU-15 2013 | EU-10 2013 | SI 2013 | ||
|---|---|---|---|---|---|---|---|---|---|---|
| Solid fuels (coal and lignite) | GWh | 926337 | 680588 | 208331 | 4611 | 862271 | 629604 | 193760 | 4876 | |
| Liquid fuels | GWh | 180960 | 162159 | 13054 | 55 | 59485 | 49785 | 8842 | 7 | |
| Gaseous fuels | GWh | 512529 | 478784 | 20995 | 293 | 539181 | 499995 | 25554 | 509 | |
| Nuclear | GWh | 944993 | 863915 | 57444 | 4761 | 876836 | 783912 | 67135 | 5300 | |
| Renewables (hydropower, wood, biofuels) | GWh | 418150 | 378272 | 16552 | 3904 | 854430 | 771447 | 47256 | 5094 | |
| Other | GWh | 44552 | 40299 | 3942 | 0 | 56661 | 52087 | 3386 | 301 | |
| Electricity production | GWh | 3027521 | 2604017 | 320318 | 13624 | 3248864 | 2786830 | 345933 | 16087 | |
| Solid fuels (coal and lignite) | % | 30.6 | 26.1 | 65 | 33.8 | 26.5 | 22.6 | 56 | 30.3 | |
| Liquid fuels | % | 6 | 6.2 | 4.1 | 0.4 | 1.8 | 1.8 | 2.6 | 0 | |
| Gaseous fuels | % | 16.9 | 18.4 | 6.6 | 2.2 | 16.6 | 17.9 | 7.4 | 3.2 | |
| Nuclear | % | 31.2 | 33.2 | 17.9 | 34.9 | 27 | 28.1 | 19.4 | 32.9 | |
| Renewables (hydropower, wood, biofuels) | % | 13.8 | 14.5 | 5.2 | 28.7 | 26.3 | 27.7 | 13.7 | 31.7 | |
| Other | % | 1.5 | 1.5 | 1.2 | 0 | 1.7 | 1.9 | 1 | 1.9 |
Statistical office RS, 2015; Eurostat, 2015
| Solid fuels | Liquid fuels | Gaseous fuels | Nuclear | Renewables (hydropower, wood, biofuels) | Other | ||
|---|---|---|---|---|---|---|---|
| EU-28 | % | -28.9 | -54.9 | 12 | -30.8 | 197.1 | 5.5 |
| SI | % | 10.8 | -1.9 | 8.8 | 21.9 | 48.3 | 12.2 |
Statistical office RS, 2015
| 1992 | 1993 | 1994 | 1995 | 1996 | 1997 | 1998 | 1999 | 2000 | 2001 | ||
|---|---|---|---|---|---|---|---|---|---|---|---|
| Manufacturing and construction | GWh | 4660 | 4553 | 4956 | 4943 | 4921 | 4853 | 5055 | 5099 | 5490 | 5648 |
| Transport | GWh | 147 | 146 | 147 | 170 | 258 | 264 | 268 | 271 | 265 | 256 |
| Households | GWh | 2404 | 2490 | 2585 | 2553 | 2594 | 2637 | 2658 | 2692 | 2601 | 2675 |
| Other use | GWh | 1516 | 1561 | 1597 | 1718 | 1641 | 2028 | 2059 | 2151 | 2166 | 2348 |
| Total | GWh | 8727 | 8750 | 9285 | 9384 | 9414 | 9782 | 10040 | 10213 | 10522 | 10927 |
| 2002 | 2003 | 2004 | 2005 | 2006 | 2007 | 2008 | 2009 | 2010 | 2011 | ||
| Manufacturing and construction | GWh | 5790 | 6543 | 6710 | 7172 | 7440 | 7468 | 6311 | 4966 | 5487 | 5864 |
| Transport | GWh | 172 | 179 | 189 | 197 | 198 | 195 | 196 | 156 | 173 | 164 |
| Households | GWh | 2704 | 3008 | 3012 | 2951 | 3055 | 3021 | 3182 | 3137 | 3219 | 3211 |
| Other use | GWh | 3023 | 2335 | 2637 | 2423 | 2472 | 2579 | 3117 | 3033 | 3066 | 3261 |
| Total | GWh | 11689 | 12065 | 12548 | 12743 | 13165 | 13263 | 12806 | 11292 | 11945 | 12500 |
| 2012 | 2013 | 2014 | |||||||||
| Manufacturing and construction | GWh | 5922 | 5878 | 6057 | |||||||
| Transport | GWh | 159 | 154 | 136 | |||||||
| Households | GWh | 3179 | 3229 | 3125 | |||||||
| Other use | GWh | 3168 | 3218 | 3141 | |||||||
| Total | GWh | 12428 | 12479 | 12459 |
Statistical office RS, 2015
| 1992 | 2000 | 2014 | ||
|---|---|---|---|---|
| Manufacturing and construction | GWh | 4660 | 5490 | 6057 |
| Transport | GWh | 147 | 265 | 136 |
| Households | GWh | 2404 | 2601 | 3125 |
| Other use | GWh | 1516 | 2166 | 3141 |
| Total | GWh | 8727 | 10522 | 12459 |
| Manufacturing and construction | % | 53.4 | 52.2 | 48.6 |
| Transport | % | 1.7 | 2.5 | 1.1 |
| Households | % | 27.5 | 24.7 | 25.1 |
| Other use | % | 17.4 | 20.6 | 25.2 |
Statistical office RS, 2015
| EU-28 | EU-25 | EU-15 | EU-10 | - | Latvia | Lithuania | Estonia | Cyprus | Croatia | ||
|---|---|---|---|---|---|---|---|---|---|---|---|
| 2000 | TWh | 2531.2 | 2460.8 | 2230.5 | 230.3 | 4.5 | 6.2 | 5 | 3 | 11.8 | |
| 2001 | TWh | 2595.5 | 2522.4 | 2287 | 235.5 | 4.6 | 6.4 | 5.2 | 3.1 | 12 | |
| 2002 | TWh | 2623.5 | 2550.7 | 2314.5 | 236.3 | 4.9 | 6.7 | 5.3 | 3.4 | 12.7 | |
| 2003 | TWh | 2687.8 | 2611.5 | 2368 | 243.5 | 5.2 | 7.2 | 5.6 | 3.6 | 13 | |
| 2004 | TWh | 2748.1 | 2670.4 | 2419 | 251.4 | 5.4 | 7.7 | 5.9 | 3.7 | 13.7 | |
| 2005 | TWh | 2785.8 | 2706.6 | 2452.4 | 254.2 | 5.7 | 8 | 6 | 4 | 14.4 | |
| 2006 | TWh | 2836.3 | 2753.2 | 2487.9 | 265.2 | 6.1 | 8.4 | 6.5 | 4.2 | 15.1 | |
| 2007 | TWh | 2853.6 | 2769.7 | 2497.9 | 271.8 | 6.6 | 8.9 | 6.8 | 4.4 | 15.4 | |
| 2000-2013 | % | 0.7 | 0.7 | 0.6 | 1.6 | 3 | 2.9 | 2.4 | 2.1 | 1.9 | |
| 2012-2013 | % | -0.9 | -0.9 | -1.2 | 1.3 | -4 | 0.4 | -2.3 | -11.1 | -1.8 | |
| Poland | Spain | Austria | Malta | Romania | Slovenia | Ireland | Hungary | Portugal | Czech Republic | ||
| 2000 | TWh | 98.6 | 188.5 | 51.5 | 1.6 | 33.9 | 10.5 | 20.3 | 29.4 | 38.4 | 49.4 |
| 2001 | TWh | 98.8 | 201 | 53.6 | 1.6 | 36.3 | 10.9 | 21 | 30.5 | 39.9 | 50.9 |
| 2002 | TWh | 97.5 | 205.5 | 53.9 | 1.7 | 35.6 | 11.7 | 21.8 | 31.5 | 41.5 | 50.8 |
| 2003 | TWh | 101.2 | 217.9 | 55.6 | 1.8 | 37.5 | 12 | 23 | 31.4 | 43.2 | 52.4 |
| 2004 | TWh | 104.7 | 230.7 | 56.8 | 1.8 | 38.8 | 12.5 | 23.1 | 31.8 | 44.7 | 53.8 |
| 2005 | TWh | 105.4 | 242.2 | 58.3 | 1.9 | 38.9 | 12.7 | 24.4 | 32.3 | 46.3 | 55.3 |
| 2006 | TWh | 111.1 | 246.1 | 60.9 | 1.9 | 41 | 13.2 | 25.9 | 33.2 | 47.8 | 57 |
| 2007 | TWh | 114.5 | 250.8 | 62 | 1.9 | 41 | 13.3 | 25.9 | 33.7 | 49 | 57.2 |
| 2000-2013 | % | 1.8 | 1.6 | 1.5 | 1.5 | 1.4 | 1.4 | 1.4 | 1.3 | 1.3 | 1.1 |
| 2012-2013 | % | 1.1 | -3.4 | -0 | -1.6 | -4.1 | 0.3 | 0.2 | 6.2 | -2.1 | 0.1 |
| France | Slovakia | Bulgaria | Greece | Netherlands | Luxembourg (Grand-Duché) | Germany (including ex-GDR from 1991) | Finland | Italy | Belgium | ||
| 2000 | TWh | 384.9 | 22 | 24.3 | 43.2 | 97.8 | 5.8 | 483.5 | 75.7 | 273 | 77.5 |
| 2001 | TWh | 395.8 | 23.5 | 24.6 | 44.5 | 99.2 | 5.8 | 495.3 | 77.4 | 277.7 | 78.1 |
| 2002 | TWh | 393.5 | 22.8 | 24.1 | 46.6 | 99.7 | 5.9 | 508.5 | 79.7 | 282.8 | 78.4 |
| 2003 | TWh | 408.4 | 23 | 25.1 | 48.6 | 100.4 | 6.2 | 514.6 | 80.9 | 291.4 | 79.7 |
| 2004 | TWh | 420.2 | 24 | 24.9 | 49.7 | 104.7 | 6.4 | 521.3 | 83.1 | 295.5 | 80.6 |
| 2005 | TWh | 422.8 | 22.9 | 25.7 | 50.9 | 104.5 | 6.2 | 522.3 | 80.7 | 300.9 | 80.2 |
| 2006 | TWh | 426.9 | 23.7 | 26.9 | 52.5 | 106 | 6.6 | 528 | 86 | 308.8 | 82.6 |
| 2007 | TWh | 426 | 24.6 | 27.2 | 55.2 | 108.5 | 6.7 | 529.4 | 86.1 | 309.3 | 82.9 |
| 2000-2013 | % | 1 | 1 | 1 | 0.9 | 0.6 | 0.6 | 0.5 | 0.4 | 0.4 | 0.3 |
| 2012-2013 | % | 1.5 | 4.8 | -1.1 | -6.2 | -0.3 | -0.6 | -1.5 | -1 | -3.1 | -0.4 |
| Sweden | Denmark | United Kingdom | |||||||||
| 2000 | TWh | 128.7 | 32.5 | 329.8 | |||||||
| 2001 | TWh | 132.3 | 32.6 | 332.9 | |||||||
| 2002 | TWh | 130.9 | 32.5 | 333.8 | |||||||
| 2003 | TWh | 129.4 | 32.4 | 337 | |||||||
| 2004 | TWh | 130.4 | 33 | 339.3 | |||||||
| 2005 | TWh | 130.7 | 33.5 | 348.9 | |||||||
| 2006 | TWh | 130.8 | 33.8 | 345.4 | |||||||
| 2007 | TWh | 131.1 | 33.5 | 341.9 | |||||||
| 2000-2013 | % | -0.2 | -0.2 | -0.3 | |||||||
| 2012-2013 | % | -1.8 | 0.2 | -0.2 |
Statistical office RS, 2015
| EU-28 | EU-25 | EU-15 | EU-10 | - | Finland | Sweden | Luxembourg (Grand-Duché) | Austria | Belgium | ||
|---|---|---|---|---|---|---|---|---|---|---|---|
| 2000 | MWh/capita | 5.2 | 5.9 | 6.5 | 3.1 | 14.6 | 14.5 | 13.2 | 6.4 | 7.6 | |
| 2001 | MWh/capita | 5.3 | 6 | 6.6 | 3.2 | 14.9 | 14.8 | 13.2 | 6.6 | 7.6 | |
| 2002 | MWh/capita | 5.3 | 6.1 | 6.7 | 3.2 | 15.3 | 14.6 | 13.2 | 6.6 | 7.6 | |
| 2003 | MWh/capita | 5.5 | 6.2 | 6.8 | 3.3 | 15.5 | 14.4 | 13.6 | 6.8 | 7.7 | |
| 2004 | MWh/capita | 5.6 | 6.3 | 6.9 | 3.4 | 15.9 | 14.5 | 13.9 | 6.9 | 7.7 | |
| 2005 | MWh/capita | 5.6 | 6.4 | 7 | 3.4 | 15.4 | 14.4 | 13.1 | 7.1 | 7.6 | |
| 2006 | MWh/capita | 5.7 | 6.4 | 7 | 3.6 | 16.3 | 14.4 | 13.9 | 7.4 | 7.8 | |
| 2007 | MWh/capita | 5.7 | 6.5 | 7 | 3.7 | 16.2 | 14.3 | 13.8 | 7.5 | 7.8 | |
| 2008 | MWh/capita | 5.7 | 6.5 | 7 | 3.7 | 15.5 | 13.9 | 13.4 | 7.4 | 7.7 | |
| 2009 | MWh/capita | 5.4 | 6.1 | 6.6 | 3.6 | 14.4 | 13.2 | 12.2 | 7.1 | 7.1 | |
| 2010 | MWh/capita | 5.6 | 6.4 | 6.9 | 3.7 | 15.5 | 13.9 | 12.9 | 7.4 | 7.6 | |
| 2011 | MWh/capita | 5.5 | 6.2 | 6.7 | 3.8 | 14.8 | 13.1 | 12.4 | 7.4 | 7.2 | |
| 2012 | MWh/capita | 5.5 | 6.2 | 6.7 | 3.8 | 14.9 | 13.3 | 11.7 | 7.4 | 7.3 | |
| 2013 | MWh/capita | 5.5 | 6.2 | 6.7 | 3.8 | 14.7 | 13 | 11.3 | 7.4 | 7.2 | |
| France | Germany (including ex-GDR from 1991) | Netherlands | Slovenia | Denmark | Czech Republic | Ireland | Estonia | Spain | United Kingdom | ||
| 2000 | MWh/capita | 6.3 | 5.9 | 6.1 | 5.3 | 6.1 | 4.8 | 5.3 | 3.6 | 4.7 | 5.6 |
| 2001 | MWh/capita | 6.4 | 6 | 6.2 | 5.5 | 6.1 | 5 | 5.4 | 3.7 | 4.9 | 5.6 |
| 2002 | MWh/capita | 6.4 | 6.2 | 6.2 | 5.9 | 6 | 5 | 5.5 | 3.9 | 4.9 | 5.6 |
| 2003 | MWh/capita | 6.6 | 6.2 | 6.2 | 6 | 6 | 5.1 | 5.7 | 4.1 | 5.1 | 5.6 |
| 2004 | MWh/capita | 6.7 | 6.3 | 6.4 | 6.3 | 6.1 | 5.3 | 5.6 | 4.4 | 5.3 | 5.6 |
| 2005 | MWh/capita | 6.7 | 6.3 | 6.4 | 6.4 | 6.2 | 5.4 | 5.8 | 4.5 | 5.5 | 5.8 |
| 2006 | MWh/capita | 6.7 | 6.4 | 6.5 | 6.5 | 6.2 | 5.6 | 6 | 4.8 | 5.5 | 5.7 |
| 2007 | MWh/capita | 6.7 | 6.4 | 6.6 | 6.6 | 6.1 | 5.5 | 5.8 | 5.1 | 5.5 | 5.6 |
| 2008 | MWh/capita | 6.7 | 6.4 | 6.6 | 6.3 | 6 | 5.6 | 5.9 | 5.2 | 5.5 | 5.5 |
| 2009 | MWh/capita | 6.5 | 6.1 | 6.3 | 5.5 | 5.7 | 5.2 | 5.6 | 5 | 5.2 | 5.1 |
| 2010 | MWh/capita | 6.8 | 6.5 | 6.4 | 5.8 | 5.8 | 5.5 | 5.6 | 5.2 | 5.2 | 5.2 |
| 2011 | MWh/capita | 6.4 | 6.4 | 6.4 | 6.1 | 5.7 | 5.4 | 5.4 | 5 | 5.2 | 5 |
| 2012 | MWh/capita | 6.6 | 6.4 | 6.3 | 6.1 | 5.6 | 5.4 | 5.3 | 5.3 | 5.1 | 5 |
| 2013 | MWh/capita | 6.7 | 6.4 | 6.3 | 6.1 | 5.6 | 5.4 | 5.3 | 5.2 | 5 | 4.9 |
| Italy | Slovakia | Cyprus | Greece | Malta | Portugal | Bulgaria | Croatia | Hungary | Latvia | ||
| 2000 | MWh/capita | 4.8 | 4.1 | 4.3 | 4 | 4 | 3.7 | 3 | 2.8 | 2.9 | 1.9 |
| 2001 | MWh/capita | 4.9 | 4.4 | 4.4 | 4.1 | 4 | 3.8 | 3.1 | 2.8 | 3 | 2 |
| 2002 | MWh/capita | 4.9 | 4.2 | 4.7 | 4.3 | 4.2 | 4 | 3.1 | 3 | 3.1 | 2.1 |
| 2003 | MWh/capita | 5.1 | 4.3 | 5 | 4.4 | 4.5 | 4.1 | 3.2 | 3 | 3.1 | 2.3 |
| 2004 | MWh/capita | 5.1 | 4.5 | 5.1 | 4.5 | 4.4 | 4.3 | 3.2 | 3.2 | 3.2 | 2.4 |
| 2005 | MWh/capita | 5.2 | 4.3 | 5.3 | 4.6 | 4.6 | 4.4 | 3.4 | 3.3 | 3.2 | 2.6 |
| 2006 | MWh/capita | 5.3 | 4.4 | 5.5 | 4.8 | 4.6 | 4.5 | 3.6 | 3.5 | 3.3 | 2.8 |
| 2007 | MWh/capita | 5.3 | 4.6 | 5.6 | 5 | 4.5 | 4.6 | 3.6 | 3.6 | 3.4 | 3 |
| 2008 | MWh/capita | 5.2 | 4.6 | 5.8 | 5.1 | 4.5 | 4.6 | 3.8 | 3.7 | 3.4 | 3.1 |
| 2009 | MWh/capita | 4.9 | 4.3 | 5.8 | 4.9 | 4.1 | 4.5 | 3.6 | 3.6 | 3.3 | 2.9 |
| 2010 | MWh/capita | 5 | 4.5 | 5.8 | 4.8 | 4.3 | 4.7 | 3.7 | 3.7 | 3.4 | 3 |
| 2011 | MWh/capita | 5.1 | 4.6 | 5.5 | 4.7 | 4.4 | 4.6 | 3.9 | 3.7 | 3.5 | 3 |
| 2012 | MWh/capita | 5 | 4.4 | 5.1 | 4.7 | 4.6 | 4.4 | 3.8 | 3.6 | 3.3 | 3.4 |
| 2013 | MWh/capita | 4.7 | 4.6 | 4.6 | 4.5 | 4.4 | 4.3 | 3.8 | 3.5 | 3.5 | 3.3 |
| Poland | Lithuania | Romania | |||||||||
| 2000 | MWh/capita | 2.6 | 1.8 | 1.5 | |||||||
| 2001 | MWh/capita | 2.6 | 1.9 | 1.7 | |||||||
| 2002 | MWh/capita | 2.6 | 2 | 1.6 | |||||||
| 2003 | MWh/capita | 2.6 | 2.1 | 1.7 | |||||||
| 2004 | MWh/capita | 2.7 | 2.3 | 1.8 | |||||||
| 2005 | MWh/capita | 2.8 | 2.4 | 1.8 | |||||||
| 2006 | MWh/capita | 2.9 | 2.6 | 1.9 | |||||||
| 2007 | MWh/capita | 3 | 2.8 | 2 | |||||||
| 2008 | MWh/capita | 3.1 | 2.8 | 2 | |||||||
| 2009 | MWh/capita | 3 | 2.7 | 1.9 | |||||||
| 2010 | MWh/capita | 3.1 | 2.7 | 2 | |||||||
| 2011 | MWh/capita | 3.2 | 2.9 | 2.1 | |||||||
| 2012 | MWh/capita | 3.2 | 3 | 2.1 | |||||||
| 2013 | MWh/capita | 3.3 | 3 | 2 |
Goals
Electricity production
- diversification of the use of various primary energy sources,
- electricity production from domestic sources in the amount of at least 75% of total annual consumption,
- reliable and high-quality energy supply,
- balanced long-term development of the energy sector based on energy consumption patterns,
- a 25% share of renewable energy sources in gross final energy consumption by 2020; indicative goal: 39.3% share of renewable electricity in gross electricity consumption by 2020.
Electricity consumption
Slovenia has no particular goal as regards energy consumption, but goals can be defined in a wider context of general energy efficiency goals:
- Within the climate and energy policy framework, the EU set the goal of 20% improvement in energy efficiency by 2020 (EU Council, 2007), placing it among priority EU development goals of the EU (EC, 2009).
- The Energy Efficiency Directive (2012/27/EU) imposes the setting of indicative energy efficiency targets on the Member States. These must comply with the EU target on efficient primary energy use.
- Slovenia set the following goals for 2020: final energy consumption 5,118 ktoe and primary energy consumption 7,125 ktoe. The goal at the level of primary energy affects the consumption and production of electricity.
- The projections of the National Energy Efficiency Action Plan and the Renewable Energy Action Plan show 1.2% average annual growth in energy consumption in the period 2010–2020.
Comment
Electricity production by fuel type
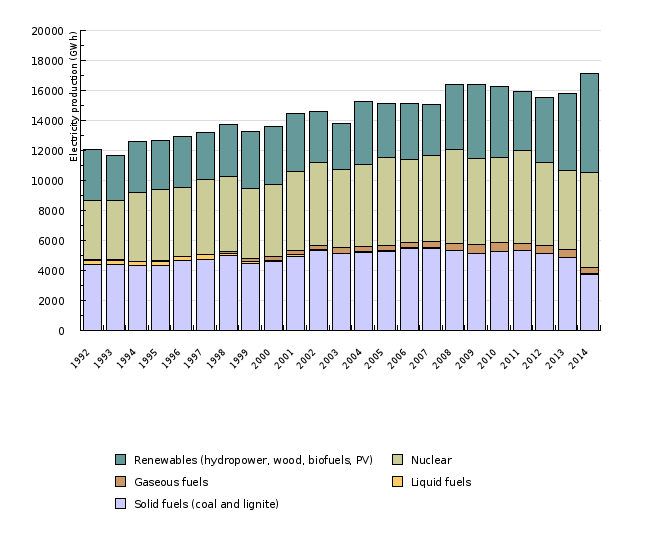
In 2014, total electricity production amounted to 17,437 GWh, which was the highest value within the monitoring period. 38% of electricity was produced from renewable energy sources, 37% from nuclear energy, while the contribution of solid fuels was 22%. Total electricity production is increasing. Compared to 1992, it was 44% higher, while it exceeded production in the preceding year by 8.3%. The shares of individual fuel types in electricity productions are subject to fluctuations, which is a consequence of climate conditions, particularly hydrology, and overhauls of the nuclear power plant. Long-term trends in the period 1992–2014 show that the share of production from solid fuels was decreasing while the shares of production from nuclear energy and RES were increasing, particularly the latter in the last year due to favourable hydrological conditions.
In the nuclear power plant, 6,370 GWh of electricity was produced in 2014, which was the highest value within the observed period. The Krško Nuclear Power Plant reaches its peak production in years without overhauls, which is the consequence of an 18-month overhaul cycle. Compared to 1992, electricity production was 34% higher in 2014, which was achieved by optimisation of operation through shorter overhauls and shorter facility improvement times. Electricity production at the nuclear power plant also depends on hydrological conditions, as water from the Sava river is used for cooling. However, dependence on the river has been reduced due to modernisation and expansion of the cooling towers.
In 2014, electricity production from solid fuels amounted to 3,759 GWh, which was the lowest production after 2001. The maximum in electricity production from coal was reached in 2006 and 2007 with 5,460 and 5,485 GWh, respectively. After 2007, production was stopped at blocks 1 (2010) and 2 (2008) of the Šoštanj thermal power plant and at the Trbovlje thermal power plant (2014). Electricity production from solid fuels is adapting to electricity production from renewable energy sources and the thermal power plant as well as to the conditions on the electricity market.
Within the observed period, electricity production from renewable energy sources in Slovenia reached their peak in 2014 (6,611 GWh). By far the highest share of electricity is produced by hydroelectric power plants (96%), where production fluctuates significantly as it corresponds closely to river discharge (for more detailed information see indicator EN24: The share of renewables in final energy consumption). Solar and wind power plants generate 4% of electricity, while wood and biogas contribute 2% each.
Electricity production from natural gas represents 2% of total electricity production, while liquid fuels contribute 0.2%. Other production represents 2% and includes pumped storage plants and waste.
In 2014, the share of electricity produced from domestic energy sources was 93%, whereby the nuclear plant contributed half the electricity in gross consumption. During the period 2005–2014, 2007 was the only year in which the share of local energy sources in electricity production was below the target value of 75% set in the Resolution on the National Energy Programme.
In the future, major changes in the share of various fuel types in electricity production are expected due to the continuation of urgent technological renovation of thermal power plants as they approach the end of their life cycle and stricter environmental regulations. Electricity production from renewable energy sources will increase, which is planned in the National Renewable Energy Action Plan 2010–2020. An increased share of electricity produced from natural gas is expected as well. On the other hand, the share of solid fuels in electricity production is expected to decrease. It has been planned that the operating life of the nuclear power plant will be extended until 2043.
Changes towards more environmentally friendly electricity production are also encouraged by the legislation currently in force: the CO2 Emission Trading Scheme, the Decree on limit values for emissions from large combustion plants into the atmosphere, setting the limit values for air pollutant concentrations. Electricity production from renewable energy sources and in high efficiency heat and power cogeneration facilities is encouraged through the support scheme. In recent years, the conditions for electricity generation from fossil fuels are uncertain and tight due to low prices of electricity. Uncertainty on the electricity market also influences the investments in new facilities and renovation of existing facilities.
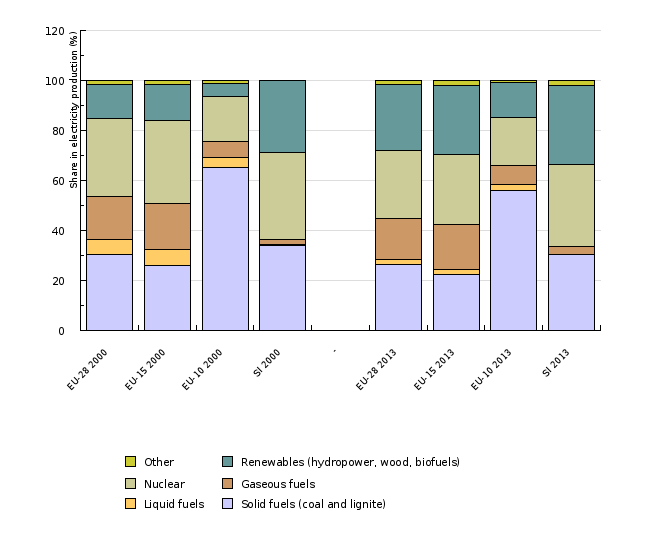
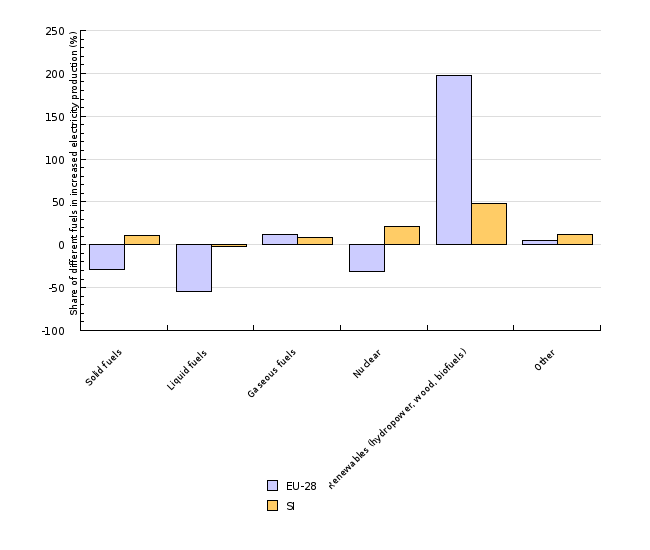
In 2013, solid fuels (27%), nuclear energy (27%) and renewable energy sources (26%) contributed almost equally to electricity production in the EU-28. Gaseous fuels contributed 17%. In the period 2000–2013, electricity production in the EU-28 increased by 7%, while in Slovenia it increased by 18%. The highest contribution to the increase in the EU-28 came from RES and natural gas, while electricity production from solid and liquid fuels, as well as from nuclear energy, decreased. In Slovenia, the greatest contribution to the increase in electricity production came from RES, followed by nuclear energy, solid fuels and natural gas.
Statistically and physically, all nuclear electricity production takes place in Slovenia, while legally and commercially, according to the reciprocal agreement between Slovenia and Croatia[1], half the production is attributed to Croatia and cannot be placed directly on the electricity market in Slovenia. Taking into account half the production of the nuclear power plant in Slovenia, total electricity production in 2014 amounted to 14,252 GWh, while gross consumption, in which final electricity consumption has the largest share by far, was 14,633 GWh, which is 3% more than the total production. The highest excess of gross consumption over production (25%) occurred in 2003 and 2007.
Electricity consumption
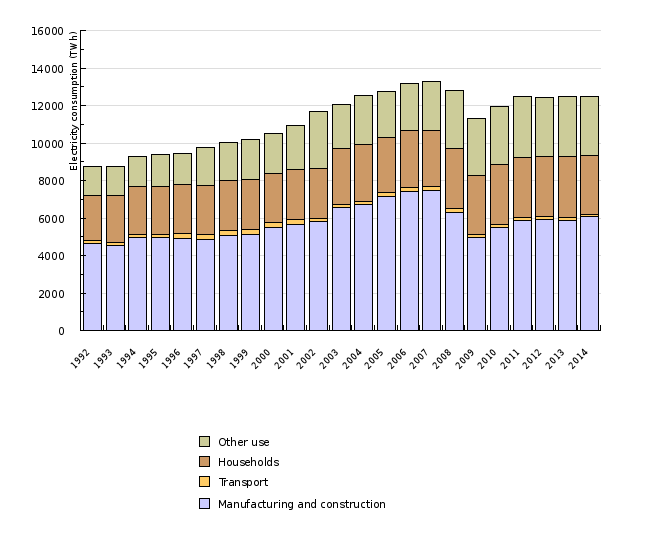
In 2014, final electricity consumption was 12,558 GWh, which was 0.2% less than a year earlier. The largest share of electricity was consumed by manufacturing and construction (49%), followed by the service sector, agriculture and forestry (commonly referred to as “other use”) (25%) and households (25%). Transport contributed 1% to overall electricity consumption. In final energy consumption, electricity represented 23.3% in 2014.
In 2014, total energy consumption was 42.8% higher compared to 1992 (average annual growth of 1.6%) and 18.4% higher than in 2000 (average annual growth of 1.2%). Electricity consumption increased until the outbreak of economic crisis in 2007 (average annual growth of 3.8% in the period 2000–2006). After 2011, when the crisis was over, growth stabilised. Over the last four years, the consumption has been decreasing at an average annual rate of 0.1%.
In the period 1992–2014, the highest increase in electricity consumption was recorded in the sector “other use” (107%), which was followed by households and manufacturing and construction (both 30%). In transport, consumption was 8% lower in 2014 compared to 1992.
In the sector “other use” (which includes services, agriculture and forestry), electricity consumption increased due to changes in the methodology of statistical data collection (it is calculated as the difference between final electricity consumption in Slovenia and consumption in manufacturing, construction, households and transport) and changes in tariff groups, while it was also partly a consequence of the sector's growth (in 2014, the value added was 86% higher in real terms compared to 1992).
In 2014, 6,057 GWh of electricity was consumed in the ‘manufacturing and construction’ sector. The greatest consumer within the sector was metal manufacturing (35%) where 60% of electricity was consumed in the production of primary aluminium. Here, the reduction of consumption in 2009 was much greater than in the rest of the ‘manufacturing and construction’ sector. By 2020, however, consumption returned to the level from 2008. Manufacture of metals is followed by manufacture of paper and paper products with 11%. A share higher than 5% was recorded in the following activities: manufacture of chemicals and chemical products, manufacture of non-metal mineral products, manufacture of metal products, manufacture of electrical devices and manufacture of rubber and plastic mass products. In manufacturing and construction, electricity consumption has a similar trend as in total energy consumption.
In households, electricity consumption decreased by 3.2% in 2014, to 3,125 GWh. In the period 1992–2010, consumption steadily increased with minor fluctuations (to 3,219 GWh), while since 2010, it has been gradually decreasing. The growth in energy consumption in households was influenced by improvements in the standard of living, growth in the number of households, growth in household informatisation and growth in the use of other electric appliances. In recent years, the use of electricity for heating has also been increasing due to the use of heat pumps. On the other hand, the decrease in electricity consumption is influenced by considerable improvement in the efficiency of electric devices and changed behaviour of consumers due to informing and awareness-raising activities. The structure of electricity consumption in households for 2014 is as follows: 19% for water heating, 12% for food cooling (freezers and refrigerators), 10% for heating, 9% for clothing- and dish washing and drying, 8% for computers and TVs, 8% for lighting, 9% for cooking and 25% for other uses (Statistical Office of the Republic of Slovenia, 2014).
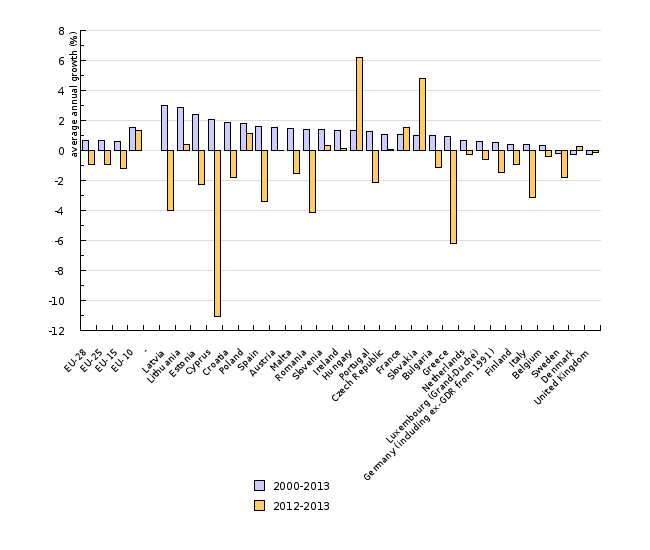
In 2013, electricity consumption in the majority of the EU-28 Member States was higher than in 2000, with the exception of Denmark, Sweden and the UK. Average annual growth varied between 3% in Latvia to –0.3% in the UK. In 2013, growth was recorded in only nine countries. For the period 2000-2013, Slovenia ranks among the upper half of the countries.
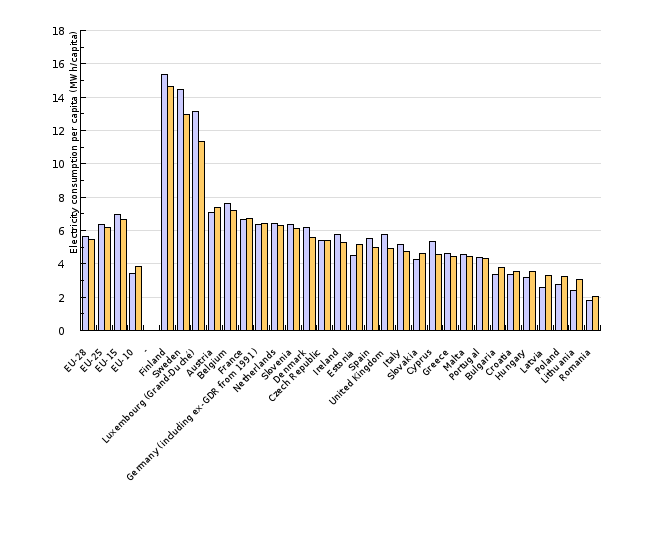
Energy consumption per capita differs considerably among the countries, as it is influenced by many factors – the structure of manufacturing activities, the structure of electricity consumption in households and the service sector, standard of living, climate conditions, etc. Slovenia ranks among the upper half of the countries, one of the reasons being the economic structure with a high share of energy intensive manufacturing and a low share of services, agriculture and forestry in energy consumption (the fifth lowest share in the EU-28).
Controlling growth in electricity consumption is important for Slovenia to achieve the 25% target share of renewable energy sources in gross final electricity consumption by 2020 and the energy efficiency goal under the Energy Efficiency Directive. In this context, Slovenia must reduce its primary energy consumption to below 7,125 ktoe and final energy consumption to below 5,118 ktoe, which will only be achievable at low electricity consumption growth (in the Renewable Energy Action Plan for the period 2010–2014, an average annual growth of 1.2% is planned).
[1] Act Ratifying the Treaty between the Government of the Republic of Slovenia and the government of the Republic of Croatia on the regulation of the status and other legal relations regarding investment, exploitation and decommissioning of the Krško Nuclear Plant (Official Gazette of the Republic of Slovenia, no. 23/2003)


