-
-
-
-
-
-
-
-
Tools and collections
- Environmental atlas
- EIONET in Slovenia
- Environmental indicators
- IED devices
- Endangered species
- IS-waste

[PP01] Ekonomska škoda zaradi podnebnih sprememb [PP04] Temperatura[PP05] Triglavski ledenik[PP06] Dolžina letne rastne dobe[PP07] Ekstremni temperaturni dogodki [PP09] Padavine[PP10] Ekstremni padavinski dogodki[PP11] Heating and cooling degree days[PP12] Hidrološka suša površinskih vod[PP13] Hidrološka suša podzemnih voda[PP14] Kmetijske suše[PP15] Suša v tleh [PP16] Požari v naravnem okolju[GZ04] Forest area[RE03] Ozaveščenost javnosti o vplivih podnebnih sprememb v Sloveniji[RE04] Odnos prebivalstva do okolju prijaznega prometa[VD01] Indeks izkoriščanja vode[ZD22] Population exposure to airborne pollen/allergens[ZD25] Reported Lyme borreliosis cases in Slovenia [ZD29] Izpostavljenost prebivalcev ozonu
[PB02] Poraba snovi, ki povzročajo tanjšanje ozonskega plašča[PB03] Izpusti toplogrednih plinov[PB08] Projekcije izpustov toplogrednih plinov [PR09] Transport emissions of greenhouse gases[RE01] Odnos javnosti do porabe energije v slovenskih gospodinjstvih [RE02] Ozaveščenost prebivalstva o energetski učinkovitosti [RE03] Ozaveščenost javnosti o vplivih podnebnih sprememb v Sloveniji[RE04] Public attitude towards sustainable transport[RE05] Odnos prebivalstva do baterijskih električnih vozil in plug-in hibridnih vozil[RE06] Odnos prebivalstva do porabe goriv v prometu v Sloveniji
[EN05] Emissions intensity of public conventional thermal power (electricity and heat) production[EN06] Emissions (CO2, SO2 and NOx) from public electricity and heat production[EN07] Residues from combustion of coal for energy production[EN08] Nuclear waste production[EN09] Emissions of air pollutants from energy sources[EN10] Final energy consumption by sector[EN11] Total energy intensity[EN15] Final energy consumption intensity[EN16] Primary energy consumption by fuel[EN18] Renewable energy sources[EN19] Electricity production from renewable energy sources [EN20] Energy prices[EN21] Energy taxes[EN22] Subsidies in the energy sector[EN23] External costs of electricity production[EN24] The share of renewables in final energy consumption[EN25] Energy import dependency[EN26] Energy losses in transformation and distribution[EN30] Production and consumption of electricity[EN31] Efficiency of systems of production, transport and distribution of electricity and heat[EN32] Energy efficiency and energy use in sectors of final energy consumption[PP12] Hydrological drought of surface waters[PP13] Hydrological droughts of groundwater [PP14] Agricultural droughts[PP15] Soil drought[PR04] Final energy consumption in transport[RE01] Public attitude towards energy consumption[RE02] Public Awareness on Energy Efficiency [RE06] Public attitude toward the use of fuel in Slovenian traffic[EN01] Energy-related greenhouse gas emissions[EN02] Ozone precursors (for updated data see indicator EN09)[EN03] Acidifying substances (for updated data see EN09)[EN04] Particulate emissions in the energy sector (for updated data see EN09) [EN12] Electricity consumption[EN13] Efficiency of electricity production[EN14] Cogeneration of electricity and heat[EN17] Electricity production by fuel[EN27] Energy efficiency and energy consumption in the transport sector[EN28] Energy efficiency and energy consumption in the household sector [EN29] Energy efficiency and energy consumption in the industry sector
[RE01] Public attitude towards energy consumption[RE02] Public Awareness on Energy Efficiency [RE03] Public awareness on climate change impacts [RE04] Public attitude towards sustainable transport[RE05] Public attitude towards battery-powered electric vehicles and plug-in hybrids[RE06] Public attitude toward the use of fuel in Slovenian traffic[RE07] Public attitude on use of public transport by households[RE08] Conditions for increasing the use of public transport by households[RE09] Attitude of organisations from the public and service sectors towards energy consumption in public and business premises[RE10] Awareness of the public and service sectors of the energy efficiency in their business premises[RE11] Awareness of the public and service sector of the environmental impact of their business premises[RE12] Public opinion on integrating different forms of transportation[RE13] Household Perspectives on Achieving Electricity Self-Sufficiency with Photovoltaics Index[RE14] Household Attitudes Towards Heat Pump Technology Index[RE15] Attitude of households towards financial incentives for efficient use and renewable energy sources index [RE16] Household Perspectives on propensity for building energy efficiency index[RE17] Household Perspectives on propensity for energy-saving household appliances Index
[ZD01] Infant mortality due to respiratory diseases[ZD02] Asthma and allergic diseases in children[ZD03] Population exposure to PM₁₀ concentrations in ambient air[ZD04] Outbreaks of waterborne diseases (epidemics)[ZD05] Access to safe drinking water[ZD07] Biomonitoring of air pollution using epiphytic lichens[ZD08] Exposure of roe deer to heavy metals (lead and cadmium) and fluorides[ZD09] Critical loads and exceedances of sulfur and nitrogen for ecosystems[ZD10] Biomonitoring of deposition of metals and nitrogen[ZD12] Incidence of childhood leukaemia[ZD13] The incidence of melanoma in adults [ZD14] Exposure of children to road traffic noise in the Municipality of Ljubljana[ZD15] Dietary intake of certain metals[ZD16] Dioxins in human milk [ZD17] Levels of lead in children's blood in the Upper Meža Valley[ZD18] Mortality due to respiratory diseases [ZD19] Foodborne disease outbreaks[ZD20] Heat waves and daily number of deaths[ZD21] Incidence of foodborne diseases[ZD22] Population exposure to airborne pollen/allergens[ZD23] Exposure of children to road traffic noise in the Municipality of Nova Gorica[ZD24] Proportion of resident population living in a flood plain[ZD25] Reported cases of lyme borreliosis and tick-borne meningoencephalitis in Slovenia[ZD26] Life expectancy at birth[ZD27] Exposure to road traffic noise in the Municipality of Maribor[ZD28] Persistent organic pollutants in food - dioxins and dioxin-like PCBs (dlPCBs) in fish and other seafood[ZD29] Population exposure to ozone[ZD30] Exposure to ultra-fine particles (nanoparticles) in ambient air [ZD31] Health impacts of exposure to fine particulate matter PM2.5[ZD32] Incidence of malignant mesothelioma and mortality[ZD33] Arsenic exposure and health risk assessment for adult population[ZD34] Lead exposure and health risk assessment for adult population[ZR19] Health costs of air pollution in European cities and the linkage with transport
[PR01] Volume and structure of passenger transport[PR02] Volume and structure of freight transport[PR03] Investments in transport Infrastructure[PR04] Final energy consumption in transport[PR05] External costs of transport[PR06] Public awareness about the effects of transport on the environment[PR07] Impacts of transport on air quality in urban areas[PR08] Emissions of air pollutants from transport[PR09] Transport emissions of greenhouse gases[PR10] Transport accident fatalities [PR11] Passenger car ownership[PR12] Age of vehicle fleet[PR13] Introduction of alternative fuels in transport[PR14] Expenditure on personal mobility[PR15] Progress in charge levels[PR16] Road transport fuel prices[PR17] Quality of transport fuels[PR19] Municipal and regional sustainable urban mobility plans in Slovenia[PR20] Energy efficiency and specific emissions of CO2 from transport [PR21] Introducing new technologies in transport[PR22] Number of electric vehicles[PR23] Daily Passenger Mobility[PR24] European mobility week[PR25] Greenhouse gas emission intensity of fuels and energy in road transport[HR01] Exposure to traffic noise[HR02] Exposure to road traffic noise outside urban areas[HR03] Exposure to noise from rail traffic outside urban areas[RE04] Public attitude towards sustainable transport[RE05] Public attitude towards battery-powered electric vehicles and plug-in hybrids[RE06] Public attitude toward the use of fuel in Slovenian traffic[RE12] Public opinion on integrating different forms of transportation[PR18] Exposure to traffic noise[OD15] End-of-life tyres
[KM01] Use of plant protection products[KM02] Consumption of mineral fertilisers[KM03] Areas of land with agri-environmental measures[KM04] Intensity of agriculture[KM05] Share of Agricultural Land with High Natural Value[KM06] Nature areas under protection and agriculture[KM07] Farmers' training levels[KM08] Areas of land with organic farming[KM09] Energy use in agriculture[KM10] Land use change and agriculture[KM11] Production methods on agricultural holdings[KM12] Specialisation and diversification of agriculture[KM13] Emissions of Ammonia in Agricuture[KM14] Emissions of Methane and Nitrous oxide[KM15] Genetic diversity - agriculture plants[KM16] Genetic diversity - domestic animals[KM17] Soil quality[KM21] Irrigation of agricultural land[KM22] The Nitrogen Budget in Agriculture[KM24] Production of renewable energy from agriculture[KM25] The Phosphorous Budget in Agriculture[KM26] Plant available phosphorus and potassium in agricultural topsoil[KM27] Agricultural area - Arable land per capita[KM28] Agricultural output[KM29] Food self-sufficiency[KM31] Structure of food imports[KM32] Market prices of agricultural products[KM33] Coverage of food imports by exports[KM34] The Concentration of Agricultural Production[KM35] Soil water erosion[KM36] Soil organic carbon stocks[PP12] Hydrological drought of surface waters[PP13] Hydrological droughts of groundwater [PP14] Agricultural droughts[PP15] Soil drought[KM18] Nitrates in groundwater and agriculture (replaced by indicator VD05)[KM19] Plant protection poducts and their degradation products in groundwater (replaced by indicator VD06)[KM23] Water protection areas and agriculture (latest data available in VD16)
[GZ01] Forest decline and tree defoliation[GZ02] Naturalness of forests [GZ03] Growing stock, increment and fellings [GZ04] Forest area[GZ05] Deforestation[GZ06] Deadwood[PP16] Wildfires[ZD07] Biomonitoring of air pollution using epiphytic lichens
[EN07] Residues from the combustion of coal for energy production[GZ06] Odmrla lesna biomasa[IP01] Uvajanje sistemov za ravnanje z okoljem[KM03] Površine zemljišč s kmetijsko-okoljskimi ukrepi[KM05] Delež kmetijskih zemljišč z visoko naravno vrednostjo[KM08] Površine zemljišč z ekološkim kmetovanjem[KM09] Poraba energije v kmetijstvu[OD04] Čezmejni prevoz odpadkov [OD07] Waste management[OD12] Waste batteries and accumulators [OD13] Packaging waste [OD14] Construction waste [OD17] Waste generated by manufacturing and service activities[OD34] Odlaganje komunalnih odpadkov[RE01] Odnos javnosti do porabe energije v slovenskih gospodinjstvih [RE03] Ozaveščenost javnosti o vplivih podnebnih sprememb v Sloveniji[RE04] Odnos prebivalstva do okolju prijaznega prometa[RE05] Odnos prebivalstva do baterijskih električnih vozil in plug-in hibridnih vozil[RE06] Odnos prebivalstva do porabe goriv v prometu v Sloveniji[RE07] Odnos javnosti do uporabe javnega prevoza v gospodinjstvih[TP01] Pokrovnost in raba tal[TP02] Funkcionalno razvrednotena območja [TP03] Pozidava[VD01] Indeks izkoriščanja vode[VD02] Čiščenje odpadnih voda na komunalnih in skupnih čistilnih napravah[OD01] Komunalni odpadki (spremljano do 2014)[OD02] Odlaganje odpadkov na odlagališča (spremljano do 2010) [OD03] Nevarni odpadki (spremljano do 2023)[OD05] Odpadna olja (spremljano do 2009) [OD06] Neposredni vnos in domača poraba snovi (spremljano do 2022)[OD08] Blato iz komunalnih čistilnih naprav (spremljano do 2016)[OD09] Health-care waste (followed untill 2010)[OD10] Waste edible oils and fat (followed untill 2010)[OD11] Organski kuhinjski odpadki (spremljano do 2010) [OD15] Izrabljene gume (spremljano do 2019)[OD16] Izrabljena vozila (spremljano do 2016)[OD18] Snovna produktivnost (spremljano do 2020)
[EN09] Emissions of air pollutants from energy sources[EN11] Total energy intensity[EN16] Primary energy consumption by fuel[EN18] Renewable energy sources[EN20] Energy prices[EN21] Energy taxes[EN22] Subsidies in the energy sector[EN23] External costs of electricity production[EN25] Energy import dependency[EN32] Energy efficiency and energy use in sectors of final energy consumption[GZ03] Growing stock, increment and fellings [IP01] Environmental management systems[KM03] Areas of land with agri–environmental measures[KM05] Share of Agricultural Land with High Natural Value[KM08] Areas of land with organic farming[NB04] Subterranean biodiversity[NB05] Plants – species richness and endangered species[NB11] Species of European interest[NB12] Habitats of European interest[NB14] Farmland bird index[OD04] Transboundary shipments of waste[OD07] Waste management[OD12] Waste batteries and accumulators [OD13] Packaging waste [OD14] Construction waste [OD17] Waste generated by manufacturing and service activities[OD34] Municipal waste disposal (landfiling)[OP01] Environmental protection taxes and other environmental pressure duties[OP04] Attitudes of citizens towards the environment[PB03] GHG emissions[PR01] Volume and structure of passenger transport[PR02] Volume and structure of freight transport[PR07] Impacts of transport on air quality in urban areas[PR08] Emissions of air pollutants from transport[PR09] Transport emissions of greenhouse gases[PR12] Age of vehicle fleet[SE08] Ecological footprint[TP01] Land cover and land use[TP02] Functionally degraded areas[TP03] Land take[VD01] Water Exploitation Index[VD02] Wastewater treatment[VD05] Nitrates in groundwater[VD06] Pesticides in groundwater[VD07] Phosphorus in lakes[VD08] Drinking water quality [VD09] Inland bathing water quality[VD11] Groundwater quality[VD12] Chemical and ecological status of surface water bodies[VD16] Water protection areas[ZD03] Population exposure to PM₁₀ concentrations in ambient air[ZD14] Exposure of children to road traffic noise in the Municipality of Ljubljana[ZD23] Exposure of children to road traffic noise in the Municipality of Nova Gorica[ZD27] Exposure to road traffic noise in the Municipality of Maribor[ZR08] Concentrations of particulate matter in ambient air[OD01] Municipal waste [OD02] Landfilling of waste (followed untill 2010)[OD03] Hazardous waste[OD05] Waste oils (followed untill 2009)[OD06] Direct Material Input and Domestic Material Consumption[OD08] Sewage sludge from urban waste water treatment plants[OD09] Health-care waste (followed untill 2010)[OD10] Waste edible oils and fat (followed untill 2010)[OD11] Organic kitchen waste (followed untill 2010)[OD15] End-of-life tyres [OD16] End-of-life vehicles [OD18] Resource productivity [VD04] Quality of watercourses[ZR05] Air pollution by sulphur dioxide [ZR06] Air pollution by nitrogen dioxide[ZR07] Air pollution by ozone[ZR08] Concentrations of particulate matter in ambient air[ZR09] Emissions of substances that cause acidification and eutrophication[ZR10] Emissions of ozone-precursors[ZR11] Air quality[ZR12] Emissions of heavy metals[ZR13] Persistent organic pollutants emissions (POPs)[ZR14] Air emission projections[ZR15] Emissions of particulate matter[ZR16] Sulphur content of fuels [ZR17] Chemical composition of patricles PM10[ZR18] Effects of ozone on vegetation[ZR19] Health costs of air pollution in European cities and the linkage with transport[ZR20] Investments in air pollution mitigation measures [GZ01] Forest decline and tree defoliation[PP09] Precipitation[PP10] Extreme precipitation [PR07] Impacts of transport on air quality in urban areas[PR17] Quality of transport fuels[ZD07] Biomonitoring of air pollution using epiphytic lichens[ZD08] Exposure of roe deer to heavy metals (lead and cadmium) and fluorides[ZD10] Biomonitoring of deposition of metals and nitrogen[ZD22] Population exposure to airborne pollen/allergens[ZD29] Population exposure to ozone[ZR01] Emissions of sulphur dioxide [ZR02] Emissions of nitrogen oxides [ZR04] Emissions of non-methane volatile organic compounds
[VD01] Water Exploitation Index[VD02] Wastewater treatment[VD03] River balance[VD05] Nitrates in groundwater[VD06] Pesticides in groundwater[VD07] Phosphorus in lakes[VD08] Drinking water quality [VD09] Inland bathing water quality[VD10] Nutrient and biochemical oxygen demand in rivers[VD11] Groundwater quality[VD12] Chemical and ecological status of surface water bodies[VD14] Water permits[VD15] Groundwater recharge[VD16] Water protection areas[VD17] Surface water and water areas[MR08] Nutrients in the coastal waters[PP09] Precipitation[PP10] Extreme precipitation [PP12] Hydrological drought of surface waters[PP13] Hydrological droughts of groundwater [PP14] Agricultural droughts[PP15] Soil drought[TP06] Land cover and land use in water protection areas[VD04] Quality of watercourses[VD13] Meeting water quality critera for freshwater fish (monitored until 2014)
[MR01] Accidental oil spills from marine shipping[MR02] Sea level[MR03] Dissolved oxygen in the bottom layer[MR04] Chlorophyll a in coastal waters[MR05] Bathing water quality in costal zones[MR06] Chemical and trophic state of the sea - this indicator is no longer being updated - data is available in VD12[MR08] Nutrients in the coastal waters[MR07] Suitability of marine water to support marine bivalves and gastropods
[NV01] Nature areas under protection[NV02] Zavarovana območja[NV03] Natura 2000[NV04] Naravne vrednote
[NB01] Population size of selected bird species[NB02] Threatened species[NB03] Game preservation[NB04] Subterranean biodiversity[NB05] Plants – species richness and endangered species[NB06] Brown bear[NB07] Compensation for damage caused by protected animal species[NB09] Plants – invasive species[NB10] Dolphins[NB11] Species of European interest[NB12] Habitats of European interest[NB14] Farmland bird index[GZ06] Deadwood[PP12] Hydrological drought of surface waters[OD04] Transboundary shipments of waste[OD07] Waste management[OD12] Waste batteries and accumulators [OD13] Packaging waste [OD14] Construction waste [OD17] Waste generated by manufacturing and service activities[OD20] Waste containing asbestos[OD30] Separate collection of waste containing hazardous substances[OD31] Sustainable models of production and consumption [OD33] Recycling of waste and preparation for re-use[OD34] Municipal waste disposal (landfiling)[EN07] Residues from combustion of coal for energy production[EN08] Nuclear waste production[OD01] Municipal waste [OD02] Landfilling of waste (followed untill 2010)[OD03] Hazardous waste[OD05] Waste oils (followed untill 2009)[OD06] Direct Material Input and Domestic Material Consumption[OD08] Sewage sludge from urban waste water treatment plants[OD09] Health-care waste (followed untill 2010)[OD10] Waste edible oils and fat (followed untill 2010)[OD11] Organic kitchen waste (followed untill 2010)[OD15] End-of-life tyres [OD16] End-of-life vehicles [OD18] Resource productivity
[TP01] Land cover and land use[TP02] Functionally degraded areas[TP03] Land take[TP04] Soil pollution [TP06] Land cover and land use in water protection areas[TP07] Potentially contaminated sites[PP12] Hydrological drought of surface waters[PP13] Hydrological droughts of groundwater [PP15] Soil drought
[PG02] Households[PG03] Housing[PG04] Household energy and transportation fuel consumption[PG05] Electricity consumption in households[PG06] Household expenditure[PG07] Food[PG08] Household vehicle ownership[PG09] Eco innovation[PG10] Material footprint of households[PG11] Tourist travel[PG12] Eco tourism[PG13] Food consumption – animal based protein[PG14] Household disposable income[PG15] Households equipped with white goods[PG16] General health status according to the type of food consumed and according to household income
[OP01] Environmental protection taxes and other environmental pressure duties[OP02] Reporting of environmental data[OP03] Eco-schools in Slovenia [OP04] Attitudes of citizens towards the environment[PR05] External costs of transport[PR13] Introduction of alternative fuels in transport[PR16] Road transport fuel prices[PR19] Municipal and regional sustainable urban mobility plans in Slovenia[ZR19] Health costs of air pollution in European cities and the linkage with transport[ZR20] Investments in air pollution mitigation measures
[SE01] Gross domestic product - the impact of economic development on the environment[SE02] Demographic changes and its impact on the environment[SE03] Human Development Index[SE04] Life Expectancy and Infant Mortality [SE05] Education level and green transition[SE06] Risk of poverty rate[SE07] The structure of the economy and green transition[SE08] Ecological footprint[SE09] Gross domestic expenditure on R&D[SE10] Internet usage[SE11] Happy planet index[SE12] Ecological footprint of statistical regions[ZD26] Life expectancy at birth
[TU01] Development and distribution of tourism[TU02] Outstanding natural features visited[TU03] Green key
[HR01] Exposure to traffic noise[HR02] Exposure to road traffic noise outside urban areas[HR03] Exposure to noise from rail traffic outside urban areas[HR04] Exposure to traffic noise in Ljubljana[HR05] Exposure to traffic noise in Maribor
[PO01] Letni izpusti TGP po Uredbi (EU) 2018/842[PO36] Zmanjšanje rabe energije v sistemu obveznosti energetske učinkovitosti[EN10] Raba končne energije po sektorjih[EN16] Raba primarne energije po gorivih[EN24] Delež obnovljivih virov v bruto rabi končne energije
[PO02] Izpusti CO2 iz novih in vseh osebnih vozil[PO03] Delež OVE v energiji goriv za pogon vozil[PO04] Potniški kilometri v javnem potniškem prevozu[PO05] Trajnostni tovorni prevoz
[PO06] Finančni vzvod spodbud v javnem sektorju[PO07] Zmanjšanje izpustov CO₂ z ukrepi v javnem sektorju[PO08] Površina energetsko saniranih stavb v javnem sektorju[PO09] CO2 intensity in the commercial and institutional sector[PO10] Izboljšanje energetske učinkovitosti v stanovanjskem sektorju[PO11] Specifični izpusti CO2 v stanovanjskem sektorju[PO12] Raba končne energije, izpusti TGP in delež OVE v stavbah
[PO13] Intenzivnost izpustov TGP pri prireji mleka in govejega mesa[PO14] Racionalno gnojenje kmetijskih rastlin z dušikom - poraba dušikovih mineralnih gnojil[PO15] Bruto bilančni presežek dušika[PO16] Ukrepi za učinkovitejše kroženje dušika v kmetijstvu – površina zemljišč v ukrepu Ekološko kmetovanje[PO17] Ukrepi za učinkovitejše kroženje dušika v kmetijstvu – površine njiv in vrtov v ukrepih, ki zahtevajo gnojenje na podlagi hitrih talnih ali rastlinskih testov
[PO31] GHG net emissions in the LULUCF sector[PO32] GHG emissions due to land-use change[PO33] Površina obnovljenih gozdov[PO34] Razmerje razvojnih faz gozda[PO35] Izpusti TGP zaradi goznih požarov
[PO18] Finančne spodbude za URE in rabo OVE v industriji neETS[PO19] Delež OVE v rabi goriv v industriji[PO20] Izpusti TGP zaradi puščanja naprav z F-plini[PO21] Količina odloženih biorazgradljivih odpadkov[PO37] Energetska učinkovitost v industriji[PO38] Izpusti TGP v industriji[PO39] Priključenost prebivalcev na sisteme čiščenja odpadnih voda
[PO22] Emisijska produktivnost[PO23] Implicitna stopnja obdavčitve energije[PO24] Incentives that work against the goal of reducing GHG emissions[PO25] Zelena delovna mesta[PO26] Spodbujanje eko-inovacij za prehod v nizko ogljično družbo
[PO27] Letni izpusti TGP iz ETS[PO28] Delež oskrbe s toploto iz energetsko učinkovitih sistemov daljinskega ogrevanja[PO29] Inštalirana moč naprav za proizvodnjo električne energije iz OVE[PO30] Samooskrba z električno energijo iz OVE[PO40] Specifični izpusti TGP na enoto proizvedene električne energije[PO41] Faktor zasedenosti v cestnem prometu
-
-
Tools and collections
- Environmental atlas
- EIONET in Slovenia
- Environmental indicators
- IED devices
- Endangered species
- IS-waste

ARSO OKOLJE
Okoljsko omrežje
KAZALCI OKOLJA
[VD10] Nutrients in rivers
[VD10] Nutrients in rivers

Key message

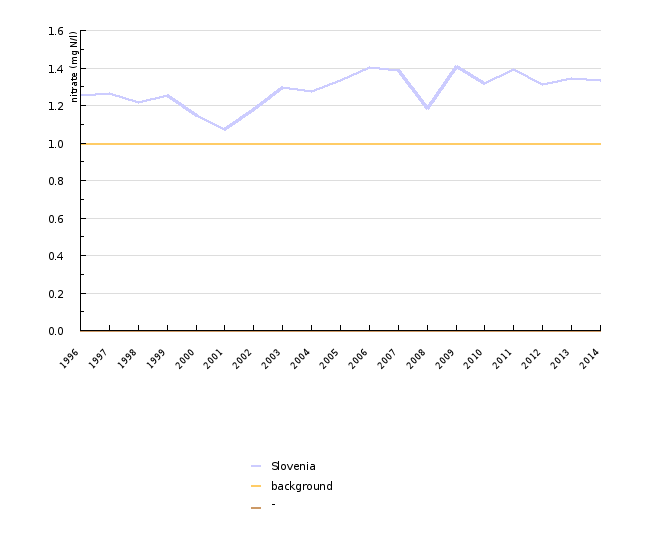
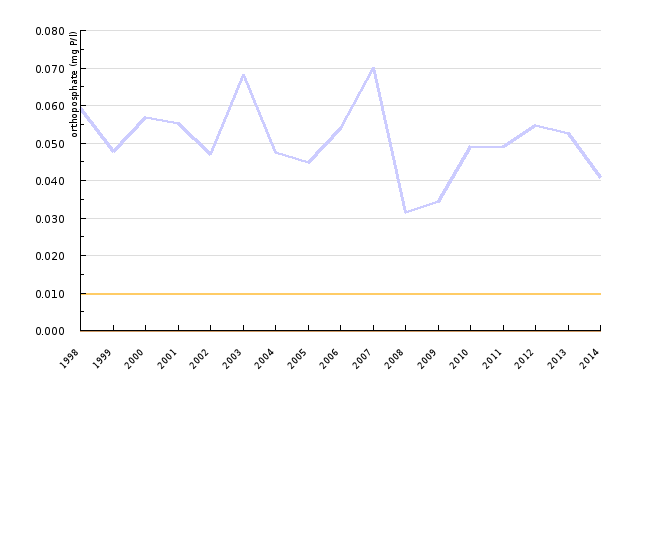
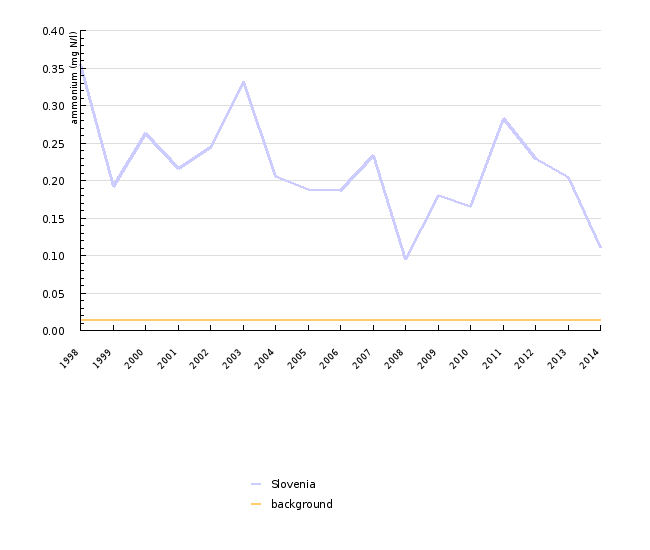
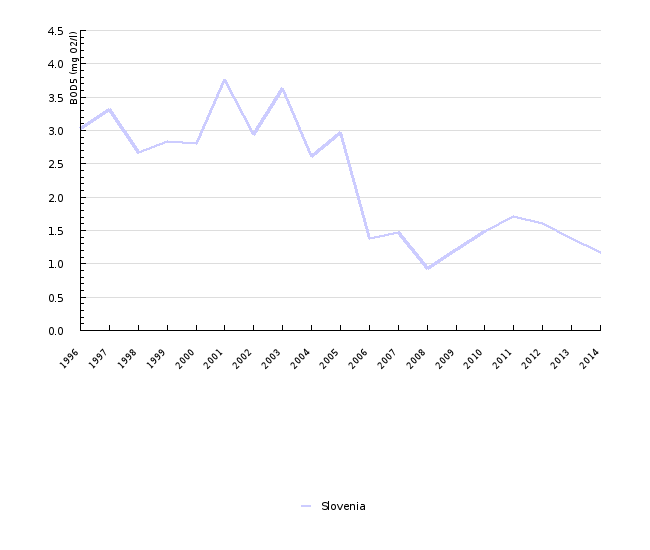
The values of biochemical oxygen demand, which is usually an indicator of organic pollution, have significantly decreased in Slovenia since 2005. Average levels of nitrate, orthophosphate and ammonium, which are slightly above background levels, do not show significant changes in the period.
Definition
Charts
Figure VD10-1: Average annual concentration of nitrate in rivers (mg N / l) (indicative value for the natural state is 1 mg N / l)
Sources:
Standardised Database for Water Quality Monitoring, Slovenian Environmental Agency, 2015
| 1996 | 1997 | 1998 | 1999 | 2000 | 2001 | 2002 | 2003 | 2004 | 2005 | ||
|---|---|---|---|---|---|---|---|---|---|---|---|
| Slovenia | mg N/l | 1.25 | 1.26 | 1.22 | 1.25 | 1.14 | 1.07 | 1.18 | 1.3 | 1.28 | 1.33 |
| 2006 | 2007 | 2008 | 2009 | 2010 | 2011 | 2012 | 2013 | 2014 | |||
| Slovenia | mg N/l | 1.4 | 1.39 | 1.18 | 1.41 | 1.32 | 1.39 | 1.31 | 1.35 | 1.33 |
Figure VD10-2: Average annual concentration of orthophosphate in the rivers (mg P / l) (indicative value for the natural state is 0,010 mg P / l)
Sources:
Standardised Database for Water Quality Monitoring, Slovenian Environmental Agency, 2015
| 1998 | 1999 | 2000 | 2001 | 2002 | 2003 | 2004 | 2005 | 2006 | 2007 | ||
|---|---|---|---|---|---|---|---|---|---|---|---|
| orthophosphate | mg P/l | 0.059 | 0.048 | 0.057 | 0.055 | 0.047 | 0.068 | 0.047 | 0.045 | 0.054 | 0.07 |
| 2008 | 2009 | 2010 | 2011 | 2012 | 2013 | 2014 | |||||
| orthophosphate | mg P/l | 0.031 | 0.034 | 0.049 | 0.049 | 0.055 | 0.053 | 0.041 |
Figure VD10-3: Average annual concentration of ammonia (mg N / l) (indicative value for the natural state is 0,015 mg N / l)
Sources:
Standardised Database for Water Quality Monitoring, Slovenian Environmental Agency, 2015
| 1998 | 1999 | 2000 | 2001 | 2002 | 2003 | 2004 | 2005 | 2006 | 2007 | ||
|---|---|---|---|---|---|---|---|---|---|---|---|
| Slovenia | mg N/l | 0.355 | 0.192 | 0.263 | 0.216 | 0.245 | 0.332 | 0.206 | 0.188 | 0.187 | 0.234 |
| 2008 | 2009 | 2010 | 2011 | 2012 | 2013 | 2014 | |||||
| Slovenia | mg N/l | 0.095 | 0.181 | 0.166 | 0.282 | 0.23 | 0.204 | 0.11 |
Figure VD10-4: Average annual value of biochemical oxygen demand - BOD5 (mg O 2 /l)
Sources:
Standardised Database for Water Quality Monitoring, Slovenian Environmental Agency, 2015
| 1996 | 1997 | 1998 | 1999 | 2000 | 2001 | 2002 | 2003 | 2004 | 2005 | ||
|---|---|---|---|---|---|---|---|---|---|---|---|
| Slovenia | mg O2/l | 3.03 | 3.32 | 2.67 | 2.84 | 2.81 | 3.76 | 2.94 | 3.62 | 2.61 | 2.97 |
| 2006 | 2007 | 2008 | 2009 | 2010 | 2011 | 2012 | 2013 | 2014 | |||
| Slovenia | mg O2/l | 1.38 | 1.47 | 0.93 | 1.22 | 1.48 | 1.71 | 1.61 | 1.37 | 1.17 |
Comment
Methodology
Last modified
15.09.2014
Author(s)
Polona Mihorko, Slovenian Environment Agency


