[ZD21] Incidence of foodborne

Key message

The incidence of intestinal infections is estimated on the basis of notifications. This approach underestimates the actual burden of acute gastrointestinal infections (AGI) and foodborne diseases in the population because they capture only the reported cases, which are only part of the infected or diseased population.
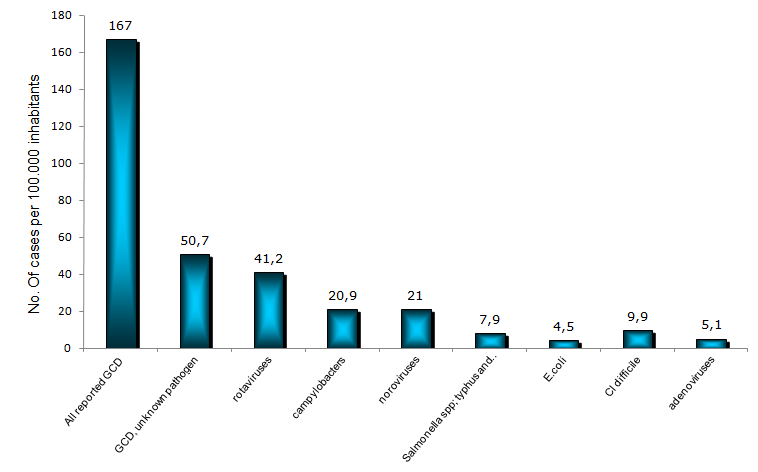
The incidence of acute gastrointestinal infections (AGI) and foodborne diseases remains high. The most frequent is gastroenterocolitis of unknown etiology, followed by viral infections of the gut which are becoming increasingly important. Among bacterial infections Campylobacter infections prevail followed by infections caused by Clostridium difficile, Salmonella, adenoviruses and pathogenic E.coli.
The real burden of the CNB and foodborne diseases can be assessed only through research.
Definition
Charts
National Institute of Public Health, 2003–2014.
| 2002 | 2003 | 2004 | 2005 | 2006 | 2007 | 2008 | 2009 | 2010 | 2011 | ||
|---|---|---|---|---|---|---|---|---|---|---|---|
| All notified gastrointestinal communicable diseases (GCD) | No.of reported cases/100.000 inh. | 1001.9 | 947.3 | 943.8 | 814.2 | 899.3 | 1046.5 | 1118.2 | 936.3 | 997.5 | 1087.6 |
| GCD , unknown pathogen | No.of reported cases/100.000 inh. | 556.3 | 493.1 | 546.2 | 489.1 | 586.2 | 704.1 | 790.6 | 665.5 | 696.1 | 760.6 |
| Salmonellosis | No.of reported cases/100.000 inh. | 136.6 | 200.6 | 165.5 | 75.8 | 75.8 | 67.2 | 54 | 30.1 | 17 | 19.5 |
| Rotavirosis | No.of reported cases/100.000 inh. | 102 | 97 | 91.1 | 83.4 | 91.1 | 89.1 | 102.5 | 80.5 | 78 | 107.5 |
| Campylobacteriosis | No.of reported cases/100.000 inh. | 60.1 | 43.6 | 52 | 54.3 | 47.1 | 53.7 | 44 | 45.1 | 48.9 | 48 |
| Other GCD with known pathogen | No.of reported cases/100.000 inh. | 91.8 | 75 | 57.7 | 85.5 | 70 | 107 | 91 | 19.7 | 17.5 | 10.9 |
| 2012 | 2013 | ||||||||||
| All notified gastrointestinal communicable diseases (GCD) | No.of reported cases/100.000 inh. | 972.5 | 964.8 | ||||||||
| GCD , unknown pathogen | No.of reported cases/100.000 inh. | 709.4 | 678 | ||||||||
| Salmonellosis | No.of reported cases/100.000 inh. | 19.5 | 14.2 | ||||||||
| Rotavirosis | No.of reported cases/100.000 inh. | 68.1 | 70.7 | ||||||||
| Campylobacteriosis | No.of reported cases/100.000 inh. | 45.4 | 48.4 | ||||||||
| Other GCD with known pathogen | No.of reported cases/100.000 inh. | 4.3 | 7 |
National Institute of Public Health, 2014.
| No. of aplications | No of cases/100.000 residents | ||
|---|---|---|---|
| All reported GCD | No. of aplications | 3438 | 167 |
| GCD, unknown pathogen | No. of aplications | 1043 | 50.7 |
| rotaviruses | No. of aplications | 849 | 41.2 |
| campylobacters | No. of aplications | 430 | 20.9 |
| noroviruses | No. of aplications | 433 | 21 |
| Salmonella spp; typhus and paratyphus | No. of aplications | 162 | 7.9 |
| E.coli | No. of aplications | 92 | 4.5 |
| Cl difficile | No. of aplications | 204 | 9.9 |
| adenoviruses | No. of aplications | 106 | 5.1 |
| shigellas | No. of aplications | 4 | 0.2 |
| Y. enterocolitica | No. of aplications | 12 | 0.6 |
| hepatitis A virus | No. of aplications | 10 | 0.5 |
| hepatitis E virus | No. of aplications | 1 | 0.1 |
| parasites | No. of aplications | 12 | 0.6 |
| other GCD with known pathogen | No. of aplications | 68 | 3.3 |
WHO, 2013.
| 2006 | 2007 | 2008 | 2009 | 2010 | 2011 | ||
|---|---|---|---|---|---|---|---|
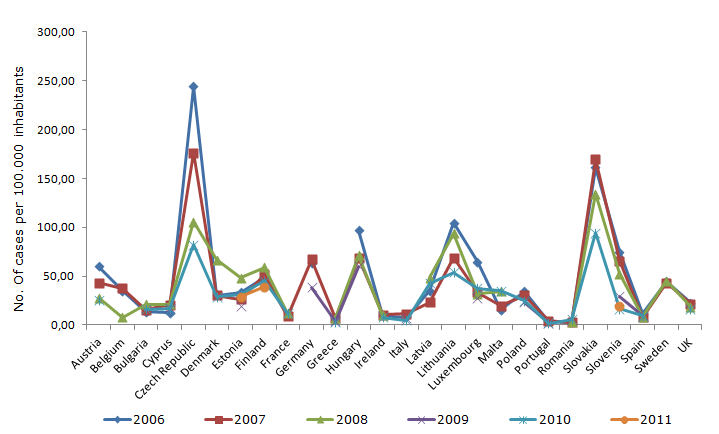
| Austria | No. of cases/100.000 inh. | 60.2 | 43.1 | 27.9 | NP | 25.5 | NP |
| Belgium | No. of cases/100.000 inh. | 35.1 | 37.4 | 7.7 | NP | NP | NP |
| Bulgaria | No. of cases/100.000 inh. | 13.7 | 15.4 | 21.3 | NP | 16.2 | NP |
| Cyprus | No. of cases/100.000 inh. | 12.5 | 20.8 | 21.3 | 17.2 | 16.4 | NP |
| Czech Republic | No. of cases/100.000 inh. | 244.5 | 176.4 | 105.6 | NP | 82 | NP |
| Denmark | No. of cases/100.000 inh. | 30.5 | 30.4 | 66.6 | NP | 28.8 | NP |
| Estonia | No. of cases/100.000 inh. | 33.7 | 26.2 | 48.3 | 19.5 | 30.9 | 28.7 |
| Finland | No. of cases/100.000 inh. | 48.7 | 51.8 | 58.9 | NP | 45.2 | 38.9 |
| France | No. of cases/100.000 inh. | NP | 9.1 | 11.8 | NP | 11.8 | NP |
| Germany | No. of cases/100.000 inh. | 63.8 | 67.4 | NP | 38.4 | NP | NP |
| Greece | No. of cases/100.000 inh. | NP | 6.6 | 7.3 | 3.6 | 2.6 | NP |
| Hungary | No. of cases/100.000 inh. | 96.8 | 68.5 | 71.4 | 60.2 | NP | NP |
| Ireland | No. of cases/100.000 inh. | 10 | 10.5 | 10.2 | NP | 8 | NP |
| Italy | No. of cases/100.000 inh. | 8 | 11.3 | NP | 6.7 | 4.9 | NP |
| Latvia | No. of cases/100.000 inh. | 35 | 23.1 | 48.5 | NP | 42.5 | NP |
| Lithuania | No. of cases/100.000 inh. | 104.8 | 69 | 94.1 | NP | 53.7 | NP |
| Luxembourg | No. of cases/100.000 inh. | 64.7 | 33.5 | 32.1 | 27.5 | 37.5 | NP |
| Malta | No. of cases/100.000 inh. | 15.8 | 19.6 | 34.5 | NP | 35.1 | NP |
| Netherlands | No. of cases/100.000 inh. | NP | NP | NP | NP | NP | NP |
| Poland | No. of cases/100.000 inh. | 34.7 | 30.4 | NP | 23.2 | 25 | NP |
| Portugal | No. of cases/100.000 inh. | 3.9 | 4.3 | NP | 2 | 1.9 | NP |
| Romania | No. of cases/100.000 inh. | 3 | 2.9 | 2.9 | NP | 6 | NP |
| Slovakia | No. of cases/100.000 inh. | 161.7 | 169.6 | 134.3 | NP | 94.5 | NP |
| Slovenia | No. of cases/100.000 inh. | 74.8 | 66 | 52.4 | 29.5 | 16.5 | 19.5 |
| Spain | No. of cases/100.000 inh. | 11.3 | 8 | 8.4 | 9.2 | 9.6 | NP |
| Sweden | No. of cases/100.000 inh. | 44.7 | 43 | 45.4 | NP | NP | NP |
| United Kingdom | No. of cases/100.000 inh. | 22.5 | 21.5 | 18.7 | NP | 16.6 | NP |
WHO, 2013.
| 2006 | 2007 | 2008 | 2009 | 2010 | 2011 | ||
|---|---|---|---|---|---|---|---|
| Belgium | No. of cases/100.000 inh. | 9.8 | 8 | 7.9 | 8.5 | NP | NP |
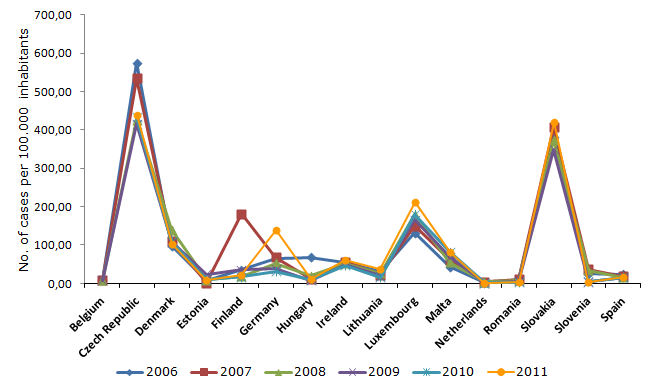
| Czech Republic | No. of cases/100.000 inh. | 574.7 | 534.4 | 426 | 416 | 432.1 | 437.6 |
| Denmark | No. of cases/100.000 inh. | 98.5 | 110.8 | 139.9 | 109 | 109.9 | 103.4 |
| Estonia | No. of cases/100.000 inh. | 8.3 | 2.1 | 9.9 | 23.2 | 11 | 9.8 |
| Finland | No. of cases/100.000 inh. | 35.3 | 181.9 | 18.8 | 35 | 17.7 | 21.3 |
| Germany | No. of cases/100.000 inh. | 63.9 | 67.4 | 52.3 | 38.4 | 31 | 138.3 |
| Hungary | No. of cases/100.000 inh. | 68.1 | 11.5 | 19.8 | 8.4 | 11 | 10.8 |
| Ireland | No. of cases/100.000 inh. | 54.2 | 55.8 | 52 | 50.2 | 46.9 | 61.1 |
| Lithuania | No. of cases/100.000 inh. | 29.9 | 22.9 | 25.8 | 19.6 | 16.4 | 38.1 |
| Luxembourg | No. of cases/100.000 inh. | 131.4 | 150.4 | 179.3 | 165.7 | 179.9 | 210.7 |
| Malta | No. of cases/100.000 inh. | 43.3 | 60.9 | 55.3 | 68.8 | 82.5 | 80.6 |
| Netherlands | No. of cases/100.000 inh. | 2.9 | 4.6 | 4.2 | 2.1 | 2.1 | 2.2 |
| Romania | No. of cases/100.000 inh. | 11.1 | 10.9 | 8.3 | 5 | 2.5 | 3.4 |
| Slovakia | No. of cases/100.000 inh. | 380 | 407.1 | 374 | 349.6 | NP | 421.6 |
| Slovenia | No. of cases/100.000 inh. | 24.8 | 36.6 | 33.9 | 4.1 | 5.9 | 4.6 |
| Spain | No. of cases/100.000 inh. | 23.9 | 18.6 | 16.4 | 16.2 | 15.9 | 17.3 |


