[ZD21] Incidence of foodborne
[ZD21] Incidence of foodborne

Key message

The incidence of gastrointestinal communicable diseases (GCD) and foodborne infections remains high. Among unknown pathogen the majority is bacteria kampilobaktri but otherwise, the viral infections have an increasingly important role. The incidence of infection is assessed on the basis of all notified cases. This approach underestimated the actual burden of GCD and foodborne infections in the population. Indeed, the burden of GCD and foodborne infections can be assessed through research.
Definition
Charts
Figure ZD21-1: Incidence of the most commonly reported gastrointestinal communicable diseases (GCD), Slovenia, 2002-2012
Sources:
National Institute of Public Health of RS, 2002–2012.
| 2002 | 2003 | 2004 | 2005 | 2006 | 2007 | 2008 | 2009 | 2010 | 2011 | ||
|---|---|---|---|---|---|---|---|---|---|---|---|
| All notified gastrointestinal communicable diseases (GCD) | No.of reported cases/100.000 inh. | 1001.9 | 947.3 | 943.8 | 814.2 | 899.3 | 1046.5 | 1118.2 | 936.3 | 997.5 | 1087.6 |
| GCD , unknown pathogen | No.of reported cases/100.000 inh. | 556.3 | 493.1 | 546.2 | 489.1 | 586.2 | 704.1 | 790.6 | 665.5 | 696.1 | 760.6 |
| Salmonellosis | No.of reported cases/100.000 inh. | 136.6 | 200.6 | 165.5 | 75.8 | 75.8 | 67.2 | 54 | 30.1 | 17 | 19.5 |
| Rotavirosis | No.of reported cases/100.000 inh. | 102 | 97 | 91.1 | 83.4 | 91.1 | 89.1 | 102.5 | 80.5 | 78 | 107.5 |
| Campylobacteriosis | No.of reported cases/100.000 inh. | 60.1 | 43.6 | 52 | 54.3 | 47.1 | 53.7 | 44 | 45.1 | 48.9 | 48 |
| Other GCD with known pathogen | No.of reported cases/100.000 inh. | 91.8 | 75 | 57.7 | 85.5 | 70 | 107 | 91 | 19.7 | 17.5 | 10.9 |
| 2012 | |||||||||||
| All notified gastrointestinal communicable diseases (GCD) | No.of reported cases/100.000 inh. | 972.5 | |||||||||
| GCD , unknown pathogen | No.of reported cases/100.000 inh. | 709.4 | |||||||||
| Salmonellosis | No.of reported cases/100.000 inh. | 19.5 | |||||||||
| Rotavirosis | No.of reported cases/100.000 inh. | 68.1 | |||||||||
| Campylobacteriosis | No.of reported cases/100.000 inh. | 45.4 | |||||||||
| Other GCD with known pathogen | No.of reported cases/100.000 inh. | 4.3 |
Figure ZD21-2: Hospitalised because of gastrointestinal communicable diseases (GCD), Slovenia, 2012
Sources:
National Institute of Public Health of RS, 2013.
| No. of aplications | No of cases/100.000 residents | ||
|---|---|---|---|
| All reported GCD | No. of aplications | 3653 | 177.7 |
| GCD, unknown pathogen | No. of aplications | 1240 | 60.3 |
| rotaviruses | No. of aplications | 886 | 43.1 |
| campylobacters | No. of aplications | 442 | 21.5 |
| noroviruses | No. of aplications | 332 | 16.1 |
| Salmonella spp; typhus and paratyphus | No. of aplications | 230 | 11.2 |
| E.coli | No. of aplications | 103 | 5 |
| Cl difficile | No. of aplications | 190 | 9.2 |
| adenoviruses | No. of aplications | 138 | 6.7 |
| shigellas | No. of aplications | 11 | 0.5 |
| Y. enterocolitica | No. of aplications | 12 | 0.6 |
| hepatitis A virus | No. of aplications | 9 | 0.4 |
| parasites | No. of aplications | 7 | 0.3 |
| other GCD with known pathogen | No. of aplications | 44 | 2.1 |
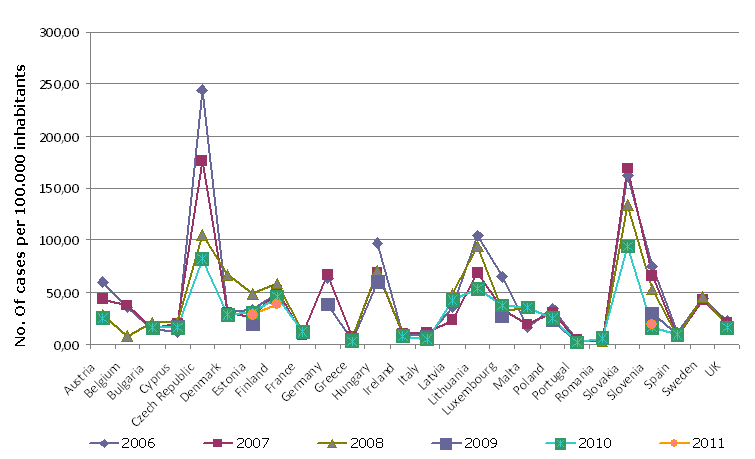
Figure ZD21-3: Salmonellosis cases per 100.000, EU-27, 2006-2011
Sources:
WHO, 2013.
| 2006 | 2007 | 2008 | 2009 | 2010 | 2011 | ||
|---|---|---|---|---|---|---|---|
| Austria | No. of cases/100.000 inh. | 60.2 | 43.1 | 27.9 | NP | 25.5 | NP |
| Belgium | No. of cases/100.000 inh. | 35.1 | 37.4 | 7.7 | NP | NP | NP |
| Bulgaria | No. of cases/100.000 inh. | 13.7 | 15.4 | 21.3 | NP | 16.2 | NP |
| Cyprus | No. of cases/100.000 inh. | 12.5 | 20.8 | 21.3 | 17.2 | 16.4 | NP |
| Czech Republic | No. of cases/100.000 inh. | 244.5 | 176.4 | 105.6 | NP | 82 | NP |
| Denmark | No. of cases/100.000 inh. | 30.5 | 30.4 | 66.6 | NP | 28.8 | NP |
| Estonia | No. of cases/100.000 inh. | 33.7 | 26.2 | 48.3 | 19.5 | 30.9 | 28.7 |
| Finland | No. of cases/100.000 inh. | 48.7 | 51.8 | 58.9 | NP | 45.2 | 38.9 |
| France | No. of cases/100.000 inh. | NP | 9.1 | 11.8 | NP | 11.8 | NP |
| Germany | No. of cases/100.000 inh. | 63.8 | 67.4 | NP | 38.4 | NP | NP |
| Greece | No. of cases/100.000 inh. | NP | 6.6 | 7.3 | 3.6 | 2.6 | NP |
| Hungary | No. of cases/100.000 inh. | 96.8 | 68.5 | 71.4 | 60.2 | NP | NP |
| Ireland | No. of cases/100.000 inh. | 10 | 10.5 | 10.2 | NP | 8 | NP |
| Italy | No. of cases/100.000 inh. | 8 | 11.3 | NP | 6.7 | 4.9 | NP |
| Latvia | No. of cases/100.000 inh. | 35 | 23.1 | 48.5 | NP | 42.5 | NP |
| Lithuania | No. of cases/100.000 inh. | 104.8 | 69 | 94.1 | NP | 53.7 | NP |
| Luxembourg | No. of cases/100.000 inh. | 64.7 | 33.5 | 32.1 | 27.5 | 37.5 | NP |
| Malta | No. of cases/100.000 inh. | 15.8 | 19.6 | 34.5 | NP | 35.1 | NP |
| Netherlands | No. of cases/100.000 inh. | NP | NP | NP | NP | NP | NP |
| Poland | No. of cases/100.000 inh. | 34.7 | 30.4 | NP | 23.2 | 25 | NP |
| Portugal | No. of cases/100.000 inh. | 3.9 | 4.3 | NP | 2 | 1.9 | NP |
| Romania | No. of cases/100.000 inh. | 3 | 2.9 | 2.9 | NP | 6 | NP |
| Slovakia | No. of cases/100.000 inh. | 161.7 | 169.6 | 134.3 | NP | 94.5 | NP |
| Slovenia | No. of cases/100.000 inh. | 74.8 | 66 | 52.4 | 29.5 | 16.5 | 19.5 |
| Spain | No. of cases/100.000 inh. | 11.3 | 8 | 8.4 | 9.2 | 9.6 | NP |
| Sweden | No. of cases/100.000 inh. | 44.7 | 43 | 45.4 | NP | NP | NP |
| United Kingdom | No. of cases/100.000 inh. | 22.5 | 21.5 | 18.7 | NP | 16.6 | NP |
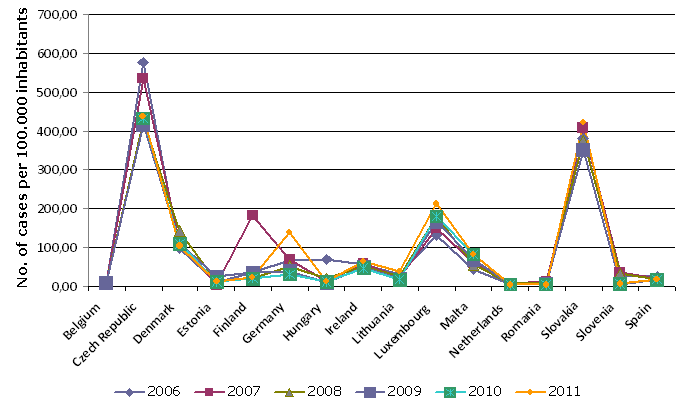
Figure ZD21-4: Microbiological foodborne diseases per 100.000, EU-27, 2006-2011
Sources:
WHO, 2013.
| 2006 | 2007 | 2008 | 2009 | 2010 | 2011 | ||
|---|---|---|---|---|---|---|---|
| Austria | No. of cases/100.000 inh. | NP | NP | NP | NP | NP | NP |
| Belgium | No. of cases/100.000 inh. | 9.8 | 8 | 7.9 | 8.5 | NP | NP |
| Bulgaria | No. of cases/100.000 inh. | NP | NP | NP | NP | NP | NP |
| Cyprus | No. of cases/100.000 inh. | NP | NP | NP | NP | NP | NP |
| Czech Republic | No. of cases/100.000 inh. | 574.7 | 534.4 | 426 | 416 | 432.1 | 437.6 |
| Denmark | No. of cases/100.000 inh. | 98.5 | 110.8 | 139.9 | 109 | 109.9 | 103.4 |
| Estonia | No. of cases/100.000 inh. | 8.3 | 2.1 | 9.9 | 23.2 | 11 | 9.8 |
| Finland | No. of cases/100.000 inh. | 35.3 | 181.9 | 18.8 | 35 | 17.7 | 21.3 |
| France | No. of cases/100.000 inh. | NP | NP | NP | NP | NP | NP |
| Germany | No. of cases/100.000 inh. | 63.9 | 67.4 | 52.3 | 38.4 | 31 | 138.3 |
| Greece | No. of cases/100.000 inh. | NP | NP | NP | NP | NP | NP |
| Hungary | No. of cases/100.000 inh. | 68.1 | 11.5 | 19.8 | 8.4 | 11 | 10.8 |
| Ireland | No. of cases/100.000 inh. | 54.2 | 55.8 | 52 | 50.2 | 46.9 | 61.1 |
| Italy | No. of cases/100.000 inh. | NP | NP | NP | NP | NP | NP |
| Latvia | No. of cases/100.000 inh. | NP | NP | NP | NP | NP | NP |
| Lithuania | No. of cases/100.000 inh. | 29.9 | 22.9 | 25.8 | 19.6 | 16.4 | 38.1 |
| Luxembourg | No. of cases/100.000 inh. | 131.4 | 150.4 | 179.3 | 165.7 | 179.9 | 210.7 |
| Malta | No. of cases/100.000 inh. | 43.3 | 60.9 | 55.3 | 68.8 | 82.5 | 80.6 |
| Netherlands | No. of cases/100.000 inh. | 2.9 | 4.6 | 4.2 | 2.1 | 2.1 | 2.2 |
| Poland | No. of cases/100.000 inh. | NP | NP | NP | NP | NP | NP |
| Portugal | No. of cases/100.000 inh. | NP | NP | NP | NP | NP | NP |
| Romania | No. of cases/100.000 inh. | 11.1 | 10.9 | 8.3 | 5 | 2.5 | 3.4 |
| Slovakia | No. of cases/100.000 inh. | 380 | 407.1 | 374 | 349.6 | NP | 421.6 |
| Slovenia | No. of cases/100.000 inh. | 24.8 | 36.6 | 33.9 | 4.1 | 5.9 | 4.6 |
| Spain | No. of cases/100.000 inh. | 23.9 | 18.6 | 16.4 | 16.2 | 15.9 | 17.3 |
| Sweden | No. of cases/100.000 inh. | NP | NP | NP | NP | NP | NP |
| UK | No. of cases/100.000 inh. | NP | NP | NP | NP | NP | NP |


