[EN01] Energy-related greenhouse gas emissions

Key message

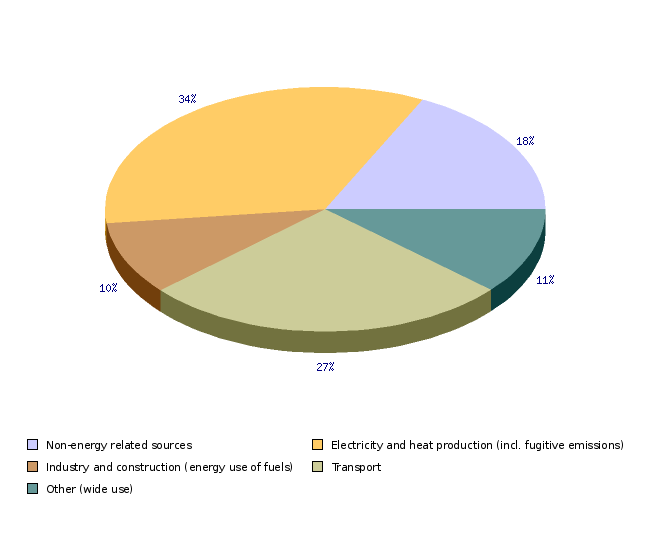
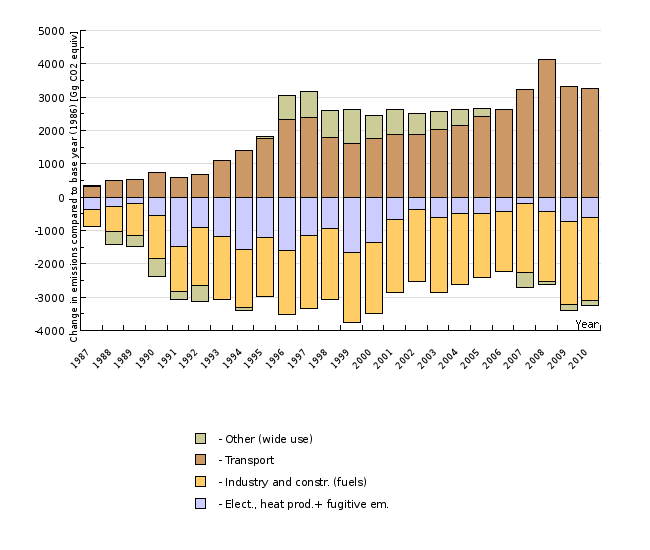
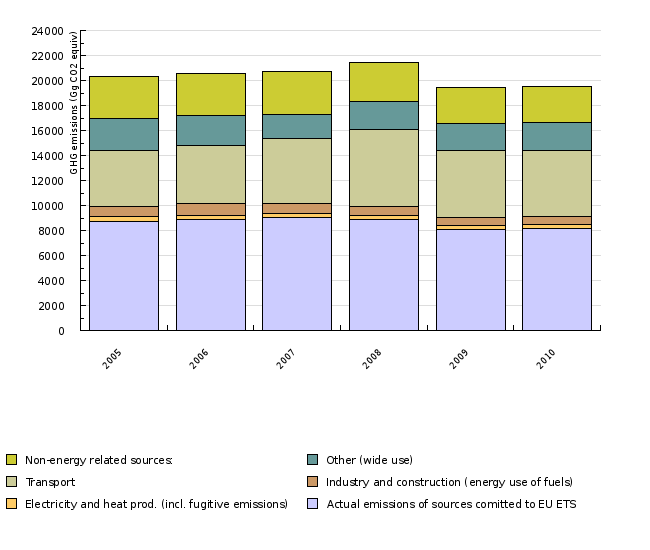
80 % of greenhouse gas emissions in Slovenia are caused by energy use. The biggest source of emissions is energy and heat production, followed by the transport. For achieving Kyoto and other targets of GHG reduction, since the introduction of the EU-ETS, only emissions from the sources that are not included in the ETS are important. In 2010 emissions from these sources were lower than the Kyoto target, but average emission for years 2008-2010 were 133 kt CO2 eq higher of the Kyoto target. Energy use contributed 75% and the biggest source is by far the transport.
Definition
The indicator shows past energy-related greenhouse gas emissions (of carbon dioxide (CO2), methane (CH4), nitrous oxide (N2O) and F-gases), Kyoto Protocol targets in the 2008–2012 period and analyses of their trends.
Charts
Slovenian Environment Agency, 2012;
| Non-energy related sources | Electricity and heat production (incl. fugitive emissions) | Industry and construction (energy use of fuels) | Transport | Other (wide use) | ||
|---|---|---|---|---|---|---|
| 2010 | Gg CO2 equiv | 3450.5 | 6669.1 | 1899.6 | 5271.6 | 2231.3 |
| 2010 | % | 17.7 | 34.2 | 9.7 | 27 | 11.4 |
Slovenian Environment Agency, 2012; Ministry responsible for the Environment, 2012, Jožef Stefan Institute, 2012.
| Year | 1987 | 1988 | 1989 | 1990 | 1991 | 1992 | 1993 | 1994 | 1995 | 1996 | |
|---|---|---|---|---|---|---|---|---|---|---|---|
| Energy sector: | Gg CO2 equiv | 15507.5 | 15133 | 15107.3 | 14400.2 | 13558.5 | 13582.3 | 14060.6 | 14041.1 | 14878.4 | 15550.8 |
| - Elect., heat prod.+ fugitive em. | Gg CO2 equiv | 6890 | 6971.1 | 7089.5 | 6724.6 | 5777.8 | 6354.4 | 6092.4 | 5682.5 | 6069.3 | 5662.8 |
| - Industry and constr. (fuels) | Gg CO2 equiv | 3901.5 | 3673.6 | 3445.8 | 3118.8 | 3057.4 | 2662.7 | 2503.2 | 2665.4 | 2615.2 | 2478.5 |
| - Transport | Gg CO2 equiv | 2332.3 | 2512.3 | 2544.7 | 2749.1 | 2596.9 | 2679.1 | 3097.1 | 3418.6 | 3757 | 4349.9 |
| - Other (wide use) | Gg CO2 equiv | 2383.6 | 1976 | 2027.2 | 1807.7 | 2126.3 | 1886.1 | 2367.9 | 2274.5 | 2436.9 | 3059.6 |
| Energy sector: | Gg CO2 equiv | -536.5 | -910.9 | -936.7 | -1643.8 | -2485.5 | -2461.6 | -1983.4 | -2002.9 | -1165.6 | -493.2 |
| - Elect., heat prod.+ fugitive em. | Gg CO2 equiv | -374.8 | -293.7 | -175.3 | -540.2 | -1486.9 | -910.4 | -1172.3 | -1582.3 | -1195.5 | -1602 |
| - Industry and constr. (fuels) | Gg CO2 equiv | -504.2 | -732.1 | -959.8 | -1286.9 | -1348.3 | -1743 | -1902.5 | -1740.3 | -1790.5 | -1927.2 |
| - Transport | Gg CO2 equiv | 324.7 | 504.7 | 537.1 | 741.5 | 589.3 | 671.6 | 1089.5 | 1411 | 1749.4 | 2342.3 |
| - Other (wide use) | Gg CO2 equiv | 17.8 | -389.9 | -338.6 | -558.2 | -239.6 | -479.8 | 2 | -91.3 | 71 | 693.7 |
| Year | 1997 | 1998 | 1999 | 2000 | 2001 | 2002 | 2003 | 2004 | 2005 | 2006 | |
| Energy sector: | Gg CO2 equiv | 15862 | 15574.8 | 14902.2 | 14991.2 | 15834.1 | 16014.6 | 15737 | 16059.9 | 16287.6 | 16447.8 |
| - Elect., heat prod.+ fugitive em. | Gg CO2 equiv | 6099.9 | 6321.4 | 5611.6 | 5908.9 | 6609.4 | 6895.3 | 6648.6 | 6777 | 6777.3 | 6843.9 |
| - Industry and constr. (fuels) | Gg CO2 equiv | 2219.6 | 2285.8 | 2296.7 | 2268.7 | 2210.5 | 2243.8 | 2157.9 | 2276.4 | 2485.5 | 2593.5 |
| - Transport | Gg CO2 equiv | 4411.9 | 3806.3 | 3617.9 | 3763 | 3890.9 | 3896 | 4030.2 | 4170.5 | 4441.7 | 4652.2 |
| - Other (wide use) | Gg CO2 equiv | 3130.6 | 3161.2 | 3376 | 3050.7 | 3123.3 | 2979.5 | 2900.4 | 2835.9 | 2583.1 | 2358.2 |
| Energy sector: | Gg CO2 equiv | -181.9 | -469.2 | -1141.7 | -1052.7 | -209.9 | -29.3 | -306.9 | 15.9 | 243.7 | 403.8 |
| - Elect., heat prod.+ fugitive em. | Gg CO2 equiv | -1164.9 | -943.4 | -1653.2 | -1355.9 | -655.4 | -369.4 | -616.2 | -487.8 | -487.5 | -420.9 |
| - Industry and constr. (fuels) | Gg CO2 equiv | -2186 | -2119.9 | -2109 | -2137 | -2195.2 | -2161.9 | -2247.8 | -2129.2 | -1920.2 | -1812.2 |
| - Transport | Gg CO2 equiv | 2404.3 | 1798.7 | 1610.3 | 1755.4 | 1883.3 | 1888.4 | 2022.6 | 2162.9 | 2434.1 | 2644.6 |
| - Other (wide use) | Gg CO2 equiv | 764.7 | 795.4 | 1010.1 | 684.8 | 757.4 | 613.6 | 534.5 | 470.1 | 217.2 | -7.7 |
| Year | 2007 | 2008 | 2009 | 2010 | |||||||
| Energy sector: | Gg CO2 equiv | 16552.4 | 17580.3 | 15985.9 | 16071.6 | ||||||
| - Elect., heat prod.+ fugitive em. | Gg CO2 equiv | 7066.8 | 6842.5 | 6540.7 | 6669.1 | ||||||
| - Industry and constr. (fuels) | Gg CO2 equiv | 2346 | 2304.6 | 1917.8 | 1899.6 | ||||||
| - Transport | Gg CO2 equiv | 5227.1 | 6152.3 | 5337 | 5271.6 | ||||||
| - Other (wide use) | Gg CO2 equiv | 1912.5 | 2280.9 | 2190.4 | 2231.3 | ||||||
| Energy sector: | Gg CO2 equiv | 508.4 | 1536.4 | -58.1 | 27.7 | ||||||
| - Elect., heat prod.+ fugitive em. | Gg CO2 equiv | -198 | -422.3 | -724.1 | -595.7 | ||||||
| - Industry and constr. (fuels) | Gg CO2 equiv | -2059.7 | -2101.1 | -2487.9 | -2506.1 | ||||||
| - Transport | Gg CO2 equiv | 3219.5 | 4144.8 | 3329.4 | 3264 | ||||||
| - Other (wide use) | Gg CO2 equiv | -453.4 | -85 | -175.5 | -134.6 |
Slovenian Environment Agency, 2012; Ministry responsible for the Environment, 2012, Jožef Stefan Institute, 2012.
| 2005 | 2006 | 2007 | 2008 | 2009 | 2010 | ||
|---|---|---|---|---|---|---|---|
| Actual emissions of sources comitted to EU ETS | Gg CO2 equiv | 8720.6 | 8842.2 | 9048.6 | 8860.1 | 8067 | 8129.9 |
| Granted quotas in the national allocation plan for the period 2005-2007 | Gg CO2 equiv | 9192.5 | 8757.3 | 8311.2 | 8214.4 | 8216.1 | 8209 |
| The difference between actual emissions and quotas | Gg CO2 equiv | -472 | 84.9 | 737.4 | 645.7 | -149 | -79.1 |
| Emissions due to energy use | Gg CO2 equiv | 8249.4 | 8321.2 | 8242.7 | 9498.9 | 8528.5 | 8530.5 |
| Electricity and heat prod. (incl. fugitive emissions) | Gg CO2 equiv | 365.1 | 366.6 | 342.5 | 305.3 | 308.1 | 328.9 |
| Industry and construction (energy use of fuels) | Gg CO2 equiv | 859.5 | 944.2 | 760.6 | 760.4 | 693 | 698.8 |
| Transport | Gg CO2 equiv | 4441.7 | 4652.2 | 5227.1 | 6152.3 | 5337 | 5271.6 |
| Other (wide use) | Gg CO2 equiv | 2583.1 | 2358.2 | 1912.5 | 2280.9 | 2190.4 | 2231.3 |
| Non-energy related sources: | Gg CO2 equiv | 3370.7 | 3416.4 | 3417.3 | 3071.6 | 2881.9 | 2861.8 |
| TOTAL non-EU ETS | Gg CO2 equiv | 11620.1 | 11737.6 | 11659.9 | 12570.6 | 11410.4 | 11392.3 |
| Target for non-EU ETS sector 2008-2012 | Gg CO2 equiv | 11746.8 | 11746.8 | 11746.8 | 11746.8 | 11746.8 | 11746.8 |
| Distance to target for non-EU ETS | Gg CO2 equiv | -126.7 | -9.2 | -86.9 | 823.8 | -336.4 | -354.5 |
| Cumulative distance to target in the period 2008-2012 | Gg CO2 equiv | 823.8 | 487.4 | 132.9 |
Goals
- reduction of GHG emissions by 8 % from the base year (CO2, N2O, CH4 in 1986 and F-gases in 1995) by 2008–2012;
- using the allowed quota of sinks (1320 kt CO2), actual average emissions in 2008–2012 should not exceed 20,046 kt CO2 equiv.;
- reduction of GHG emissions by 20 % or by 30 % by the year 2020 from the base year (by 20 % if a global climate deal is not struck and by 30 % if a global climate deal is struck). Currently 20% reduction for EU is valid. According to the decision 406/2009 Slovenia must limit its GHG emissions from nonETS sources in 2020 so that they do not increase by more that 4% compared to 2005
Methodology
Data for Slovenia
Objectives summarised by: Resolucija o Nacionalnem programu varstva okolja 2005-2012 (Resolution on the National Environmental Action Plan 2005–2012, Official Gazette of the Republic of Slovenia, No. 2/06) and the proposal of the climate and energy package.
Source database or other source of data: Official data on GHG emissions were used as sent on 19 April 2011 to UNFCCC and as located in the Central Data Repository (CDR) under Slovenia/United Nations/UNFCCC – UN Framework Convention on Climate Change data/UNFCCC - GHG Report 2011 (1986 - 2009 data) (upon preparing new records, data for previous years are often corrected).
Data administrator: The Environmental Agency of the Republic of Slovenia, the Environment Office, Air Quality Sector, contact person: Tajda Mekinda Majaron.
Data acquisition date for this indicator: 15 February 2011.
Methodology and frequency of data collection for the indicator: Data are prepared on an annual basis and on the basis of data on activities (the use of fuels, number of animals, quantity of waste, industrial manufacturing, etc.), calorific value of fuels and emission factors. The recommended methodology has been prepared by the Intergovernmental Panel on Climate Change (IPCC).
The energy sector (CRF 1) is responsible for energy-related emissions, such as those arising from fuel combustion activities (CRF 1A) that are further divided into energy industries (CRF 1A1), manufacturing industries and construction (CRF 1A2), transport (CRF 1A3) and other sectors (CRF 1A4) that includes emissions from households, the services sector and fuel combustion in agriculture and forestry. In addition to emissions arising from fuel combustion activities, energy-related emissions also include fugitive emissions from fuels (CRF 1B) that are further classified into fugitive emissions from solid fuels (CRF 1.B.1) and fugitive emissions from oil and natural gas (CRF 1.B.2) that originate in the production of fuels (coal mines) or the transmission and distribution of oil and natural gas. Transmissions or production of electricity and heat in this text includes emissions from energy industries (CRF 1.A.1) and fugitive emissions (CRF 1.B).
Non-energy related GHG emissions include industry (CRF 2) (i.e. processes in manufacturing industries and construction without fossil fuel combustion including the production and consumption of fluorinated gases), agriculture (CRF 4) (i.e. domestic livestock (manure management and enteric fermentation) and emissions from fertilisers), waste (CRF 6) (i.e. emissions from landfill sites and incineration plants and waste water treatment) and other non-energy emissions (CRF 3) (i.e. solvent and other product use).
Ministry of the Environment and Spatial Planning, 2009. Operativni program zmanjševanja emisij toplogrednih plinov do leta 2012 – OPTGP-01 (Data source for the 2008–2012 emissions projection is the Operational Programme for Limiting Greenhouse Gas Emissions by 2012).
Data processing methodology: Total GHG emissions have been calculated as a weighted sum of gas emissions (CO2, CH4, N2O and F-gases). The global warming potential (GWP) has been determined by the UN Framework Convention on Climate Change based on IPCC findings. GWP: CO2 = 1, CH4 = 21, N2O = 310, SF6 = 23900, HFC-134a = 1300, CF4 = 6500, C2F6 = 9200. The values of GWP are CO2 equivalents (CO2 equiv). For CO2, totals do not include emissions from biomass burning. Average annual rate of growth is calculated using: [(last year/base year)(1 / number of years) –1] x 100.
Information concerning data quality:
- Advantages and disadvantages of the indicator:
Advantages: Officially reported data that are calculated using internationally confirmed methods have been used to calculate the indicator. Data and procedures are reviewed by the UNFCCC.
- Relevance, accuracy, robustness, uncertainty:
Reliability of the indicator (archival data): Data reliability was estimated for 1986, 2002 and 2003. For absolute data it stands at 16 %, 13.1 % and 12 % and for trends for 2002 and 2003 at 4 % and 3 % respectively. The reliability of emission factors and activity data is estimated on the basis of an expert assessment. In 2003, the reliability of data on activities and emission factors for the transformations sector was improved due to using national emission factors and improving procedures for determining the quantity of used fuel.
Uncertainty of the indicator (scenarios/projections): /
- Overall assessment (1 = no major comments, 3 = data to be considered with reservation):
Relevance: 1
Accuracy: 1
Completeness over time: 1
Completeness over space: 1
Other sources and literature:
- ARSO, 2011. National Inventory Report.
- National Assembly of the Republic of Slovenia, 2002. Zakon o ratifikaciji Kjotskega protokola k Okvirni konvenciji Združenih narodov o spremembi podnebja (MKPOKSP) (Act Ratifying the Kyoto Protocol to the United Nations Framework Convention on Climate Change).
- European Commission, 2011. Communication from the Commission to the European Parliament, the Council, the European Economic and Social Committee and the Committee of the Regions – an energy policy for Europe.
- EU, 2009. Decision No. 406/2009/EC of the European Parliament and of the Council of 23 April 2009 on the effort of Member States to reduce their greenhouse gas emissions to meet the Community’s greenhouse gas emission reduction commitments up to 2020.
- EU, 2009a. Directive 2009/29/EC of the European Parliament and of the Council of 23 April 2009 amending Directive 2003/87/EC so as to improve and extend the greenhouse gas emission allowance trading scheme of the Community.
- Ministry of the Environment and Spatial Planning, 2006. Operativni program zmanjševanja emisij toplogrednih plinov do leta 2012 (Operational Programme for Limiting Greenhouse Gas Emissions by 2012)
- Ministry of the Environment and Spatial Planning, 2008. Poročilo o izvajanju Operativnega programa zmanjšanja emisij toplogrednih plinov do leta 2012 (Report on the Implementation of the Operational Programme for Limiting Greenhouse Gas Emissions by 2012).
- Ministry of the Environment and Spatial Planning, 2009. Operativni program zmanjševanja emisij toplogrednih plinov do leta 2012 (OP TGP-01) (Operational Programme for Limiting Greenhouse Gas Emissions by 2012).


