-
-
-
-
-
-
-
-
Tools and collections
- Environmental atlas
- EIONET in Slovenia
- Environmental indicators
- IED devices
- Endangered species
- IS-waste

[PP01] Ekonomska škoda zaradi podnebnih sprememb [PP04] Temperatura[PP05] Triglavski ledenik[PP06] Dolžina letne rastne dobe[PP07] Ekstremni temperaturni dogodki [PP09] Padavine[PP10] Ekstremni padavinski dogodki[PP11] Heating and cooling degree days[PP12] Hidrološka suša površinskih vod[PP13] Hidrološka suša podzemnih voda[PP14] Kmetijske suše[PP15] Suša v tleh [PP16] Požari v naravnem okolju[GZ04] Forest area[RE03] Ozaveščenost javnosti o vplivih podnebnih sprememb v Sloveniji[RE04] Odnos prebivalstva do okolju prijaznega prometa[VD01] Indeks izkoriščanja vode[ZD22] Population exposure to airborne pollen/allergens[ZD25] Reported Lyme borreliosis cases in Slovenia [ZD29] Izpostavljenost prebivalcev ozonu
[PB02] Poraba snovi, ki povzročajo tanjšanje ozonskega plašča[PB03] Izpusti toplogrednih plinov[PB08] Projekcije izpustov toplogrednih plinov [PR09] Transport emissions of greenhouse gases[RE01] Odnos javnosti do porabe energije v slovenskih gospodinjstvih [RE02] Ozaveščenost prebivalstva o energetski učinkovitosti [RE03] Ozaveščenost javnosti o vplivih podnebnih sprememb v Sloveniji[RE04] Public attitude towards sustainable transport[RE05] Odnos prebivalstva do baterijskih električnih vozil in plug-in hibridnih vozil[RE06] Odnos prebivalstva do porabe goriv v prometu v Sloveniji
[EN05] Emissions intensity of public conventional thermal power (electricity and heat) production[EN06] Emissions (CO2, SO2 and NOx) from public electricity and heat production[EN07] Residues from combustion of coal for energy production[EN08] Nuclear waste production[EN09] Emissions of air pollutants from energy sources[EN10] Final energy consumption by sector[EN11] Total energy intensity[EN15] Final energy consumption intensity[EN16] Primary energy consumption by fuel[EN18] Renewable energy sources[EN19] Electricity production from renewable energy sources [EN20] Energy prices[EN21] Energy taxes[EN22] Subsidies in the energy sector[EN23] External costs of electricity production[EN24] The share of renewables in final energy consumption[EN25] Energy import dependency[EN26] Energy losses in transformation and distribution[EN30] Production and consumption of electricity[EN31] Efficiency of systems of production, transport and distribution of electricity and heat[EN32] Energy efficiency and energy use in sectors of final energy consumption[PP12] Hydrological drought of surface waters[PP13] Hydrological droughts of groundwater [PP14] Agricultural droughts[PP15] Soil drought[PR04] Final energy consumption in transport[RE01] Public attitude towards energy consumption[RE02] Public Awareness on Energy Efficiency [RE06] Public attitude toward the use of fuel in Slovenian traffic[EN01] Energy-related greenhouse gas emissions[EN02] Ozone precursors (for updated data see indicator EN09)[EN03] Acidifying substances (for updated data see EN09)[EN04] Particulate emissions in the energy sector (for updated data see EN09) [EN12] Electricity consumption[EN13] Efficiency of electricity production[EN14] Cogeneration of electricity and heat[EN17] Electricity production by fuel[EN27] Energy efficiency and energy consumption in the transport sector[EN28] Energy efficiency and energy consumption in the household sector [EN29] Energy efficiency and energy consumption in the industry sector
[RE01] Public attitude towards energy consumption[RE02] Public Awareness on Energy Efficiency [RE03] Public awareness on climate change impacts [RE04] Public attitude towards sustainable transport[RE05] Public attitude towards battery-powered electric vehicles and plug-in hybrids[RE06] Public attitude toward the use of fuel in Slovenian traffic[RE07] Public attitude on use of public transport by households[RE08] Conditions for increasing the use of public transport by households[RE09] Attitude of organisations from the public and service sectors towards energy consumption in public and business premises[RE10] Awareness of the public and service sectors of the energy efficiency in their business premises[RE11] Awareness of the public and service sector of the environmental impact of their business premises[RE12] Public opinion on integrating different forms of transportation[RE13] Household Perspectives on Achieving Electricity Self-Sufficiency with Photovoltaics Index[RE14] Household Attitudes Towards Heat Pump Technology Index[RE15] Attitude of households towards financial incentives for efficient use and renewable energy sources index [RE16] Household Perspectives on propensity for building energy efficiency index[RE17] Household Perspectives on propensity for energy-saving household appliances Index
[ZD01] Infant mortality due to respiratory diseases[ZD02] Asthma and allergic diseases in children[ZD03] Population exposure to PM₁₀ concentrations in ambient air[ZD04] Outbreaks of waterborne diseases (epidemics)[ZD05] Access to safe drinking water[ZD07] Biomonitoring of air pollution using epiphytic lichens[ZD08] Exposure of roe deer to heavy metals (lead and cadmium) and fluorides[ZD09] Critical loads and exceedances of sulfur and nitrogen for ecosystems[ZD10] Biomonitoring of deposition of metals and nitrogen[ZD12] Incidence of childhood leukaemia[ZD13] The incidence of melanoma in adults [ZD14] Exposure of children to road traffic noise in the Municipality of Ljubljana[ZD15] Dietary intake of certain metals[ZD16] Dioxins in human milk [ZD17] Levels of lead in children's blood in the Upper Meža Valley[ZD18] Mortality due to respiratory diseases [ZD19] Foodborne disease outbreaks[ZD20] Heat waves and daily number of deaths[ZD21] Incidence of foodborne diseases[ZD22] Population exposure to airborne pollen/allergens[ZD23] Exposure of children to road traffic noise in the Municipality of Nova Gorica[ZD24] Proportion of resident population living in a flood plain[ZD25] Reported cases of lyme borreliosis and tick-borne meningoencephalitis in Slovenia[ZD26] Life expectancy at birth[ZD27] Exposure to road traffic noise in the Municipality of Maribor[ZD28] Persistent organic pollutants in food - dioxins and dioxin-like PCBs (dlPCBs) in fish and other seafood[ZD29] Population exposure to ozone[ZD30] Exposure to ultra-fine particles (nanoparticles) in ambient air [ZD31] Health impacts of exposure to fine particulate matter PM2.5[ZD32] Incidence of malignant mesothelioma and mortality[ZD33] Arsenic exposure and health risk assessment for adult population[ZD34] Lead exposure and health risk assessment for adult population[ZR19] Health costs of air pollution in European cities and the linkage with transport
[PR01] Volume and structure of passenger transport[PR02] Volume and structure of freight transport[PR03] Investments in transport Infrastructure[PR04] Final energy consumption in transport[PR05] External costs of transport[PR06] Public awareness about the effects of transport on the environment[PR07] Impacts of transport on air quality in urban areas[PR08] Emissions of air pollutants from transport[PR09] Transport emissions of greenhouse gases[PR10] Transport accident fatalities [PR11] Passenger car ownership[PR12] Age of vehicle fleet[PR13] Introduction of alternative fuels in transport[PR14] Expenditure on personal mobility[PR15] Progress in charge levels[PR16] Road transport fuel prices[PR17] Quality of transport fuels[PR19] Municipal and regional sustainable urban mobility plans in Slovenia[PR20] Energy efficiency and specific emissions of CO2 from transport [PR21] Introducing new technologies in transport[PR22] Number of electric vehicles[PR23] Daily Passenger Mobility[PR24] European mobility week[PR25] Greenhouse gas emission intensity of fuels and energy in road transport[HR01] Exposure to traffic noise[HR02] Exposure to road traffic noise outside urban areas[HR03] Exposure to noise from rail traffic outside urban areas[RE04] Public attitude towards sustainable transport[RE05] Public attitude towards battery-powered electric vehicles and plug-in hybrids[RE06] Public attitude toward the use of fuel in Slovenian traffic[RE12] Public opinion on integrating different forms of transportation[PR18] Exposure to traffic noise[OD15] End-of-life tyres
[KM01] Use of plant protection products[KM02] Consumption of mineral fertilisers[KM03] Areas of land with agri-environmental measures[KM04] Intensity of agriculture[KM05] Share of Agricultural Land with High Natural Value[KM06] Nature areas under protection and agriculture[KM07] Farmers' training levels[KM08] Areas of land with organic farming[KM09] Energy use in agriculture[KM10] Land use change and agriculture[KM11] Production methods on agricultural holdings[KM12] Specialisation and diversification of agriculture[KM13] Emissions of Ammonia in Agricuture[KM14] Emissions of Methane and Nitrous oxide[KM15] Genetic diversity - agriculture plants[KM16] Genetic diversity - domestic animals[KM17] Soil quality[KM21] Irrigation of agricultural land[KM22] The Nitrogen Budget in Agriculture[KM24] Production of renewable energy from agriculture[KM25] The Phosphorous Budget in Agriculture[KM26] Plant available phosphorus and potassium in agricultural topsoil[KM27] Agricultural area - Arable land per capita[KM28] Agricultural output[KM29] Food self-sufficiency[KM31] Structure of food imports[KM32] Market prices of agricultural products[KM33] Coverage of food imports by exports[KM34] The Concentration of Agricultural Production[KM35] Soil water erosion[KM36] Soil organic carbon stocks[PP12] Hydrological drought of surface waters[PP13] Hydrological droughts of groundwater [PP14] Agricultural droughts[PP15] Soil drought[KM18] Nitrates in groundwater and agriculture (replaced by indicator VD05)[KM19] Plant protection poducts and their degradation products in groundwater (replaced by indicator VD06)[KM23] Water protection areas and agriculture (latest data available in VD16)
[GZ01] Forest decline and tree defoliation[GZ02] Naturalness of forests [GZ03] Growing stock, increment and fellings [GZ04] Forest area[GZ05] Deforestation[GZ06] Deadwood[PP16] Wildfires[ZD07] Biomonitoring of air pollution using epiphytic lichens
[EN07] Residues from the combustion of coal for energy production[GZ06] Odmrla lesna biomasa[IP01] Uvajanje sistemov za ravnanje z okoljem[KM03] Površine zemljišč s kmetijsko-okoljskimi ukrepi[KM05] Delež kmetijskih zemljišč z visoko naravno vrednostjo[KM08] Površine zemljišč z ekološkim kmetovanjem[KM09] Poraba energije v kmetijstvu[OD04] Čezmejni prevoz odpadkov [OD07] Waste management[OD12] Waste batteries and accumulators [OD13] Packaging waste [OD14] Construction waste [OD17] Waste generated by manufacturing and service activities[OD34] Odlaganje komunalnih odpadkov[RE01] Odnos javnosti do porabe energije v slovenskih gospodinjstvih [RE03] Ozaveščenost javnosti o vplivih podnebnih sprememb v Sloveniji[RE04] Odnos prebivalstva do okolju prijaznega prometa[RE05] Odnos prebivalstva do baterijskih električnih vozil in plug-in hibridnih vozil[RE06] Odnos prebivalstva do porabe goriv v prometu v Sloveniji[RE07] Odnos javnosti do uporabe javnega prevoza v gospodinjstvih[TP01] Pokrovnost in raba tal[TP02] Funkcionalno razvrednotena območja [TP03] Pozidava[VD01] Indeks izkoriščanja vode[VD02] Čiščenje odpadnih voda na komunalnih in skupnih čistilnih napravah[OD01] Komunalni odpadki (spremljano do 2014)[OD02] Odlaganje odpadkov na odlagališča (spremljano do 2010) [OD03] Nevarni odpadki (spremljano do 2023)[OD05] Odpadna olja (spremljano do 2009) [OD06] Neposredni vnos in domača poraba snovi (spremljano do 2022)[OD08] Blato iz komunalnih čistilnih naprav (spremljano do 2016)[OD09] Health-care waste (followed untill 2010)[OD10] Waste edible oils and fat (followed untill 2010)[OD11] Organski kuhinjski odpadki (spremljano do 2010) [OD15] Izrabljene gume (spremljano do 2019)[OD16] Izrabljena vozila (spremljano do 2016)[OD18] Snovna produktivnost (spremljano do 2020)
[EN09] Emissions of air pollutants from energy sources[EN11] Total energy intensity[EN16] Primary energy consumption by fuel[EN18] Renewable energy sources[EN20] Energy prices[EN21] Energy taxes[EN22] Subsidies in the energy sector[EN23] External costs of electricity production[EN25] Energy import dependency[EN32] Energy efficiency and energy use in sectors of final energy consumption[GZ03] Growing stock, increment and fellings [IP01] Environmental management systems[KM03] Areas of land with agri–environmental measures[KM05] Share of Agricultural Land with High Natural Value[KM08] Areas of land with organic farming[NB04] Subterranean biodiversity[NB05] Plants – species richness and endangered species[NB11] Species of European interest[NB12] Habitats of European interest[NB14] Farmland bird index[OD04] Transboundary shipments of waste[OD07] Waste management[OD12] Waste batteries and accumulators [OD13] Packaging waste [OD14] Construction waste [OD17] Waste generated by manufacturing and service activities[OD34] Municipal waste disposal (landfiling)[OP01] Environmental protection taxes and other environmental pressure duties[OP04] Attitudes of citizens towards the environment[PB03] GHG emissions[PR01] Volume and structure of passenger transport[PR02] Volume and structure of freight transport[PR07] Impacts of transport on air quality in urban areas[PR08] Emissions of air pollutants from transport[PR09] Transport emissions of greenhouse gases[PR12] Age of vehicle fleet[SE08] Ecological footprint[TP01] Land cover and land use[TP02] Functionally degraded areas[TP03] Land take[VD01] Water Exploitation Index[VD02] Wastewater treatment[VD05] Nitrates in groundwater[VD06] Pesticides in groundwater[VD07] Phosphorus in lakes[VD08] Drinking water quality [VD09] Inland bathing water quality[VD11] Groundwater quality[VD12] Chemical and ecological status of surface water bodies[VD16] Water protection areas[ZD03] Population exposure to PM₁₀ concentrations in ambient air[ZD14] Exposure of children to road traffic noise in the Municipality of Ljubljana[ZD23] Exposure of children to road traffic noise in the Municipality of Nova Gorica[ZD27] Exposure to road traffic noise in the Municipality of Maribor[ZR08] Concentrations of particulate matter in ambient air[OD01] Municipal waste [OD02] Landfilling of waste (followed untill 2010)[OD03] Hazardous waste[OD05] Waste oils (followed untill 2009)[OD06] Direct Material Input and Domestic Material Consumption[OD08] Sewage sludge from urban waste water treatment plants[OD09] Health-care waste (followed untill 2010)[OD10] Waste edible oils and fat (followed untill 2010)[OD11] Organic kitchen waste (followed untill 2010)[OD15] End-of-life tyres [OD16] End-of-life vehicles [OD18] Resource productivity [VD04] Quality of watercourses[ZR05] Air pollution by sulphur dioxide [ZR06] Air pollution by nitrogen dioxide[ZR07] Air pollution by ozone[ZR08] Concentrations of particulate matter in ambient air[ZR09] Emissions of substances that cause acidification and eutrophication[ZR10] Emissions of ozone-precursors[ZR11] Air quality[ZR12] Emissions of heavy metals[ZR13] Persistent organic pollutants emissions (POPs)[ZR14] Air emission projections[ZR15] Emissions of particulate matter[ZR16] Sulphur content of fuels [ZR17] Chemical composition of patricles PM10[ZR18] Effects of ozone on vegetation[ZR19] Health costs of air pollution in European cities and the linkage with transport[ZR20] Investments in air pollution mitigation measures [GZ01] Forest decline and tree defoliation[PP09] Precipitation[PP10] Extreme precipitation [PR07] Impacts of transport on air quality in urban areas[PR17] Quality of transport fuels[ZD07] Biomonitoring of air pollution using epiphytic lichens[ZD08] Exposure of roe deer to heavy metals (lead and cadmium) and fluorides[ZD10] Biomonitoring of deposition of metals and nitrogen[ZD22] Population exposure to airborne pollen/allergens[ZD29] Population exposure to ozone[ZR01] Emissions of sulphur dioxide [ZR02] Emissions of nitrogen oxides [ZR04] Emissions of non-methane volatile organic compounds
[VD01] Water Exploitation Index[VD02] Wastewater treatment[VD03] River balance[VD05] Nitrates in groundwater[VD06] Pesticides in groundwater[VD07] Phosphorus in lakes[VD08] Drinking water quality [VD09] Inland bathing water quality[VD10] Nutrient and biochemical oxygen demand in rivers[VD11] Groundwater quality[VD12] Chemical and ecological status of surface water bodies[VD14] Water permits[VD15] Groundwater recharge[VD16] Water protection areas[VD17] Surface water and water areas[MR08] Nutrients in the coastal waters[PP09] Precipitation[PP10] Extreme precipitation [PP12] Hydrological drought of surface waters[PP13] Hydrological droughts of groundwater [PP14] Agricultural droughts[PP15] Soil drought[TP06] Land cover and land use in water protection areas[VD04] Quality of watercourses[VD13] Meeting water quality critera for freshwater fish (monitored until 2014)
[MR01] Accidental oil spills from marine shipping[MR02] Sea level[MR03] Dissolved oxygen in the bottom layer[MR04] Chlorophyll a in coastal waters[MR05] Bathing water quality in costal zones[MR06] Chemical and trophic state of the sea - this indicator is no longer being updated - data is available in VD12[MR08] Nutrients in the coastal waters[MR07] Suitability of marine water to support marine bivalves and gastropods
[NV01] Nature areas under protection[NV02] Zavarovana območja[NV03] Natura 2000[NV04] Naravne vrednote
[NB01] Population size of selected bird species[NB02] Threatened species[NB03] Game preservation[NB04] Subterranean biodiversity[NB05] Plants – species richness and endangered species[NB06] Brown bear[NB07] Compensation for damage caused by protected animal species[NB09] Plants – invasive species[NB10] Dolphins[NB11] Species of European interest[NB12] Habitats of European interest[NB14] Farmland bird index[GZ06] Deadwood[PP12] Hydrological drought of surface waters[OD04] Transboundary shipments of waste[OD07] Waste management[OD12] Waste batteries and accumulators [OD13] Packaging waste [OD14] Construction waste [OD17] Waste generated by manufacturing and service activities[OD20] Waste containing asbestos[OD30] Separate collection of waste containing hazardous substances[OD31] Sustainable models of production and consumption [OD33] Recycling of waste and preparation for re-use[OD34] Municipal waste disposal (landfiling)[EN07] Residues from combustion of coal for energy production[EN08] Nuclear waste production[OD01] Municipal waste [OD02] Landfilling of waste (followed untill 2010)[OD03] Hazardous waste[OD05] Waste oils (followed untill 2009)[OD06] Direct Material Input and Domestic Material Consumption[OD08] Sewage sludge from urban waste water treatment plants[OD09] Health-care waste (followed untill 2010)[OD10] Waste edible oils and fat (followed untill 2010)[OD11] Organic kitchen waste (followed untill 2010)[OD15] End-of-life tyres [OD16] End-of-life vehicles [OD18] Resource productivity
[TP01] Land cover and land use[TP02] Functionally degraded areas[TP03] Land take[TP04] Soil pollution [TP06] Land cover and land use in water protection areas[TP07] Potentially contaminated sites[PP12] Hydrological drought of surface waters[PP13] Hydrological droughts of groundwater [PP15] Soil drought
[PG02] Households[PG03] Housing[PG04] Household energy and transportation fuel consumption[PG05] Electricity consumption in households[PG06] Household expenditure[PG07] Food[PG08] Household vehicle ownership[PG09] Eco innovation[PG10] Material footprint of households[PG11] Tourist travel[PG12] Eco tourism[PG13] Food consumption – animal based protein[PG14] Household disposable income[PG15] Households equipped with white goods[PG16] General health status according to the type of food consumed and according to household income
[OP01] Environmental protection taxes and other environmental pressure duties[OP02] Reporting of environmental data[OP03] Eco-schools in Slovenia [OP04] Attitudes of citizens towards the environment[PR05] External costs of transport[PR13] Introduction of alternative fuels in transport[PR16] Road transport fuel prices[PR19] Municipal and regional sustainable urban mobility plans in Slovenia[ZR19] Health costs of air pollution in European cities and the linkage with transport[ZR20] Investments in air pollution mitigation measures
[SE01] Gross domestic product - the impact of economic development on the environment[SE02] Demographic changes and its impact on the environment[SE03] Human Development Index[SE04] Life Expectancy and Infant Mortality [SE05] Education level and green transition[SE06] Risk of poverty rate[SE07] The structure of the economy and green transition[SE08] Ecological footprint[SE09] Gross domestic expenditure on R&D[SE10] Internet usage[SE11] Happy planet index[SE12] Ecological footprint of statistical regions[ZD26] Life expectancy at birth
[TU01] Development and distribution of tourism[TU02] Outstanding natural features visited[TU03] Green key
[HR01] Exposure to traffic noise[HR02] Exposure to road traffic noise outside urban areas[HR03] Exposure to noise from rail traffic outside urban areas[HR04] Exposure to traffic noise in Ljubljana[HR05] Exposure to traffic noise in Maribor
[PO01] Letni izpusti TGP po Uredbi (EU) 2018/842[PO36] Zmanjšanje rabe energije v sistemu obveznosti energetske učinkovitosti[EN10] Raba končne energije po sektorjih[EN16] Raba primarne energije po gorivih[EN24] Delež obnovljivih virov v bruto rabi končne energije
[PO02] Izpusti CO2 iz novih in vseh osebnih vozil[PO03] Delež OVE v energiji goriv za pogon vozil[PO04] Potniški kilometri v javnem potniškem prevozu[PO05] Trajnostni tovorni prevoz
[PO06] Finančni vzvod spodbud v javnem sektorju[PO07] Zmanjšanje izpustov CO₂ z ukrepi v javnem sektorju[PO08] Površina energetsko saniranih stavb v javnem sektorju[PO09] CO2 intensity in the commercial and institutional sector[PO10] Izboljšanje energetske učinkovitosti v stanovanjskem sektorju[PO11] Specifični izpusti CO2 v stanovanjskem sektorju[PO12] Raba končne energije, izpusti TGP in delež OVE v stavbah
[PO13] Intenzivnost izpustov TGP pri prireji mleka in govejega mesa[PO14] Racionalno gnojenje kmetijskih rastlin z dušikom - poraba dušikovih mineralnih gnojil[PO15] Bruto bilančni presežek dušika[PO16] Ukrepi za učinkovitejše kroženje dušika v kmetijstvu – površina zemljišč v ukrepu Ekološko kmetovanje[PO17] Ukrepi za učinkovitejše kroženje dušika v kmetijstvu – površine njiv in vrtov v ukrepih, ki zahtevajo gnojenje na podlagi hitrih talnih ali rastlinskih testov
[PO31] GHG net emissions in the LULUCF sector[PO32] GHG emissions due to land-use change[PO33] Površina obnovljenih gozdov[PO34] Razmerje razvojnih faz gozda[PO35] Izpusti TGP zaradi goznih požarov
[PO18] Finančne spodbude za URE in rabo OVE v industriji neETS[PO19] Delež OVE v rabi goriv v industriji[PO20] Izpusti TGP zaradi puščanja naprav z F-plini[PO21] Količina odloženih biorazgradljivih odpadkov[PO37] Energetska učinkovitost v industriji[PO38] Izpusti TGP v industriji[PO39] Priključenost prebivalcev na sisteme čiščenja odpadnih voda
[PO22] Emisijska produktivnost[PO23] Implicitna stopnja obdavčitve energije[PO24] Incentives that work against the goal of reducing GHG emissions[PO25] Zelena delovna mesta[PO26] Spodbujanje eko-inovacij za prehod v nizko ogljično družbo
[PO27] Letni izpusti TGP iz ETS[PO28] Delež oskrbe s toploto iz energetsko učinkovitih sistemov daljinskega ogrevanja[PO29] Inštalirana moč naprav za proizvodnjo električne energije iz OVE[PO30] Samooskrba z električno energijo iz OVE[PO40] Specifični izpusti TGP na enoto proizvedene električne energije[PO41] Faktor zasedenosti v cestnem prometu
-
-
Tools and collections
- Environmental atlas
- EIONET in Slovenia
- Environmental indicators
- IED devices
- Endangered species
- IS-waste

ARSO OKOLJE
Okoljsko omrežje
KAZALCI OKOLJA
[PR07] Exceedances of air quality objectives due to traffic
[PR07] Exceedances of air quality objectives due to traffic

Definition
Charts
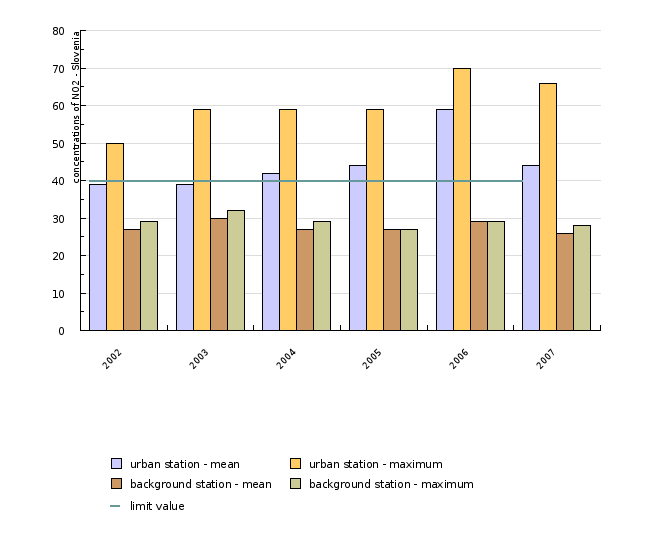
Figure PR07-1: Missing title
Show data| 2002 | 2003 | 2004 | 2005 | 2006 | 2007 | ||
|---|---|---|---|---|---|---|---|
| Maribor (DMKZ) | µg/m3 | 36 | 37 | 31 | 33 | 39 | 37 |
| Ljubljana Figovec (OMS Ljubljana) | µg/m3 | 50 | 59 | 59 | 59 | 70 | 66 |
| Celje (EIS Celje) | µg/m3 | 30 | 22 | 36 | 40 | 67 | 29 |
| urban station - mean | µg/m3 | 39 | 39 | 42 | 44 | 59 | 44 |
| urban station - maximum | µg/m3 | 50 | 59 | 59 | 59 | 70 | 66 |
| Ljubljana Bežigrad (DMKZ) | µg/m3 | 29 | 32 | 29 | 27 | 29 | 28 |
| Celje (DMKZ) | µg/m3 | 24 | 27 | 24 | 26 | 28 | 23 |
| background station - mean | µg/m3 | 27 | 30 | 27 | 27 | 29 | 26 |
| background station - maximum | µg/m3 | 29 | 32 | 29 | 27 | 29 | 28 |
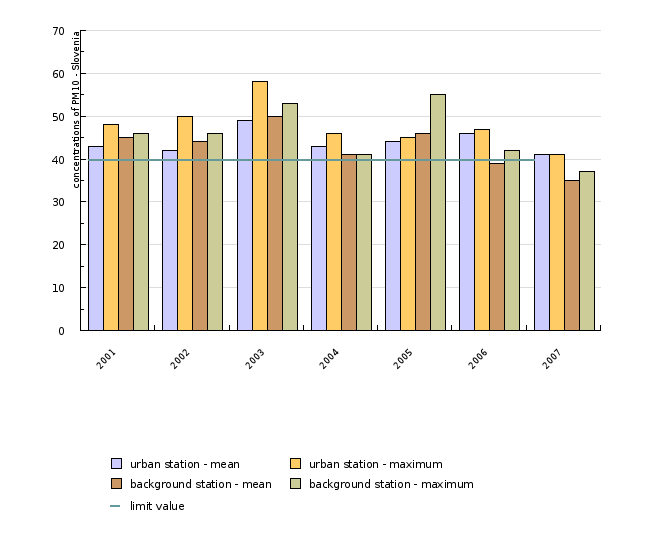
Figure PR07-2: Missing title
Sources:
Environmental Agency of the Republic of Slovenia, 2005
| 2001 | 2002 | 2003 | 2004 | 2005 | 2006 | 2007 | ||
|---|---|---|---|---|---|---|---|---|
| Maribor (DMKZ) | µg/m3 | 48 | 50 | 58 | 46 | 43 | 45 | 40 |
| Celje (EIS Celje) | µg/m3 | 37 | 34 | 39 | 40 | 45 | 47 | 41 |
| urban station - mean | µg/m3 | 43 | 42 | 49 | 43 | 44 | 46 | 41 |
| urban station - maximum | µg/m3 | 48 | 50 | 58 | 46 | 45 | 47 | 41 |
| Ljubljana Bežigrad (DMKZ) | µg/m3 | 43 | 42 | 46 | 41 | 37 | 36 | 32 |
| Celje (DMKZ) | µg/m3 | 46 | 46 | 53 | 40 | 55 | 42 | 37 |
| background station - mean | µg/m3 | 45 | 44 | 50 | 41 | 46 | 39 | 35 |
| background station - maximum | µg/m3 | 46 | 46 | 53 | 41 | 55 | 42 | 37 |
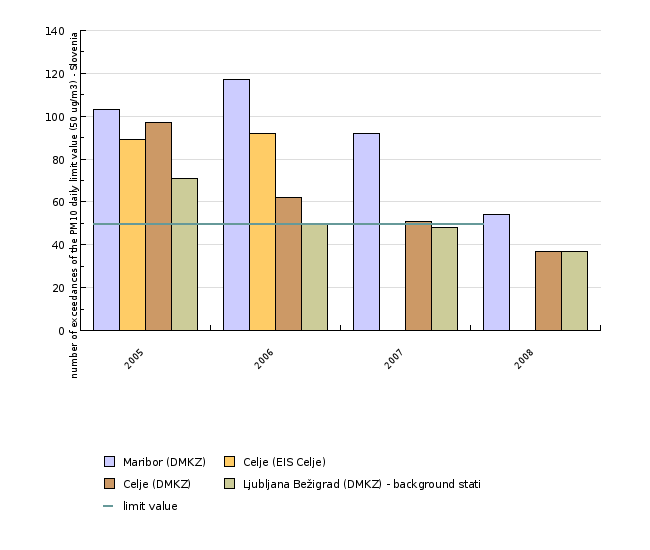
Figure PR07-3: Missing title
Show data| 2005 | 2006 | 2007 | 2008 | ||
|---|---|---|---|---|---|
| Maribor (DMKZ) | µg/m3 | 103 | 117 | 92 | 54 |
| Celje (EIS Celje) | µg/m3 | 89 | 92 | ||
| Celje (DMKZ) | µg/m3 | 97 | 62 | 51 | 37 |
| Ljubljana Bežigrad (DMKZ) - background station | µg/m3 | 71 | 50 | 48 | 37 |
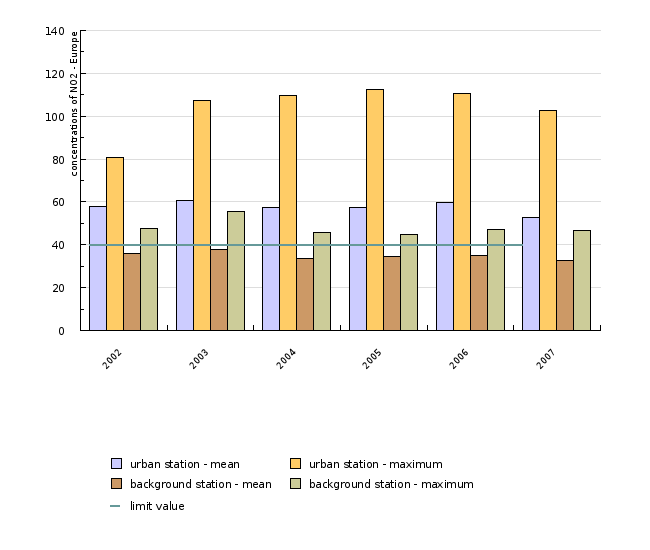
Figure PR07-4: Missing title
Show data| 2002 | 2003 | 2004 | 2005 | 2006 | 2007 | ||
|---|---|---|---|---|---|---|---|
| urban station - mean | µg/m3 | 58 | 60.7 | 57.3 | 57.5 | 59.7 | 52.9 |
| urban station - maximum | µg/m3 | 80.6 | 107.2 | 109.7 | 112.4 | 110.7 | 102.7 |
| background station - mean | µg/m3 | 36 | 37.7 | 33.6 | 34.3 | 34.9 | 32.8 |
| background station - maximum | µg/m3 | 47.7 | 55.7 | 45.7 | 44.8 | 47.1 | 46.4 |
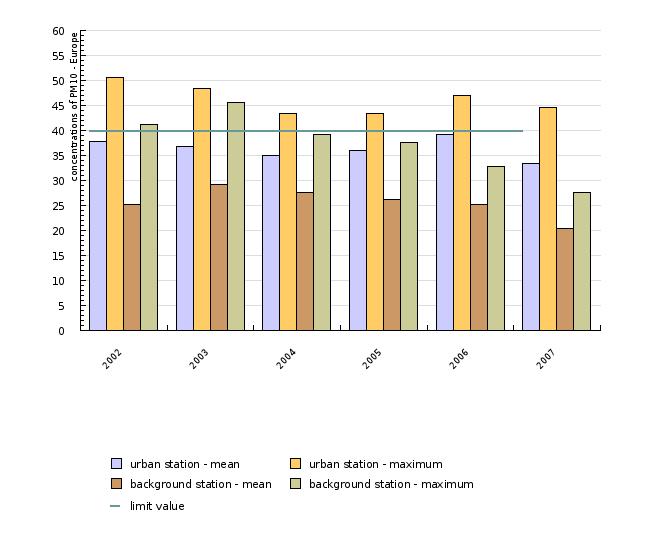
Figure PR07-5: Povprečne in povprečne maksimalne letne koncentracije PM10 za prometne in primestne postaje v Evropi
Sources:
TERM 2009 04 EEA32 – Transport Contribution to Air Quality. European Environment Agency, 2009
| 2002 | 2003 | 2004 | 2005 | 2006 | 2007 | ||
|---|---|---|---|---|---|---|---|
| urban station - mean | µg/m3 | 37.8 | 36.8 | 34.9 | 36.1 | 39.2 | 33.5 |
| urban station - maximum | µg/m3 | 50.5 | 48.3 | 43.3 | 43.4 | 46.9 | 44.7 |
| background station - mean | µg/m3 | 25.2 | 29.1 | 27.6 | 26.1 | 25.2 | 20.4 |
| background station - maximum | µg/m3 | 41.2 | 45.7 | 39.2 | 37.6 | 32.9 | 27.6 |
Comment
Methodology
Related indicators
Last modified
22.10.2007
Author(s)
Aljaž Plevnik, Urban planning Institute of the Republic of Slovenia


