[PR07] Exceedances of air quality objectives due to traffic

Key message

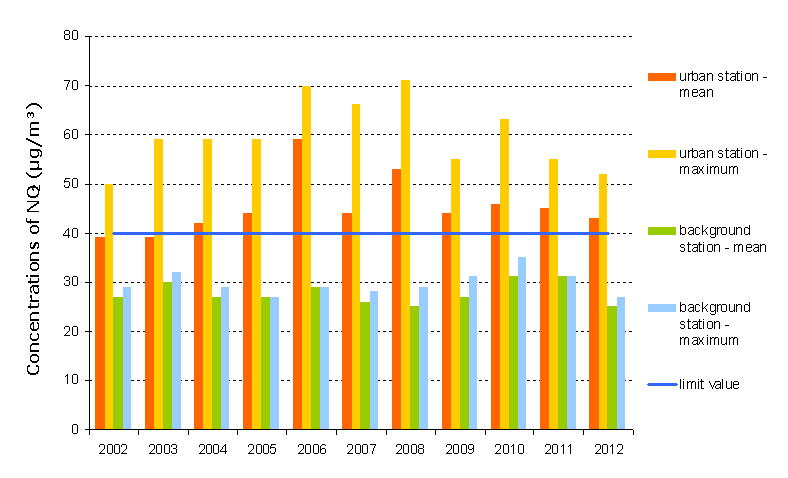
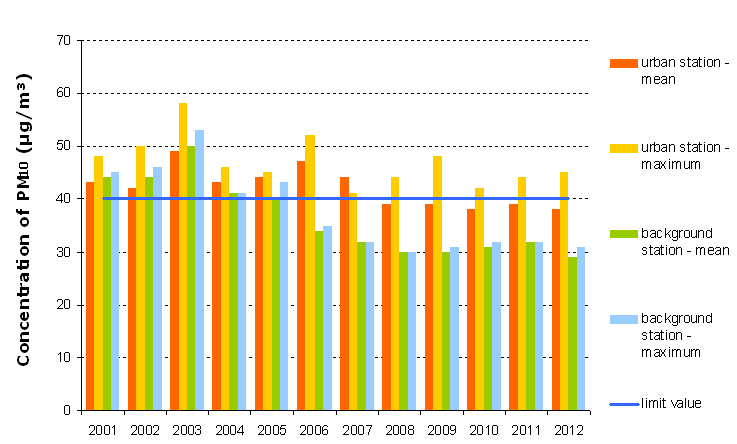
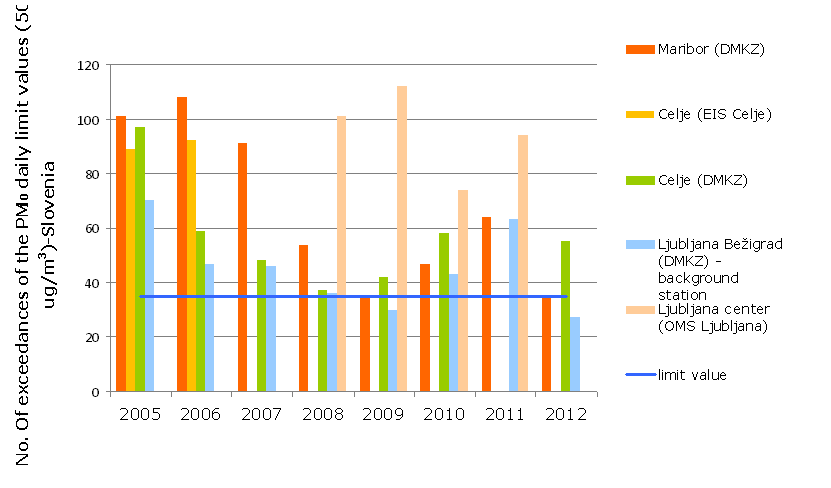
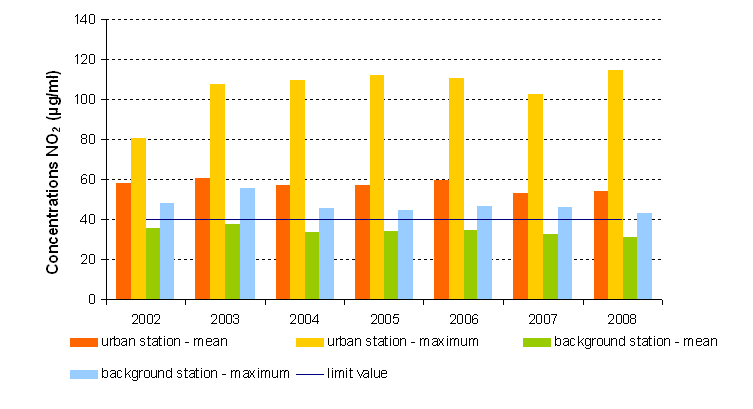
Data on air pollution shows that slovenian cities are overe-polluted with NO2 and PM10. transport is one of the main causes of this pollution.
Definition
Charts
Database of automatic readings from the national network for monitoring air quality (DMKZ). Hydrology and State of the Environment office, Slovenian Environment Agency, 2012.
| 2002 | 2003 | 2004 | 2005 | 2006 | 2007 | 2008 | 2009 | 2010 | 2011 | ||
|---|---|---|---|---|---|---|---|---|---|---|---|
| Maribor (DMKZ) | µg/m3 | 36 | 37 | 31 | 33 | 39 | 37 | 34 | 32 | 34 | 34 |
| Ljubljana center (OMS Ljubljana) | µg/m3 | 50 | 59 | 59 | 59 | 70 | 66 | 71 | 55 | 63 | 55 |
| Celje (EIS Celje) | µg/m3 | 30 | 22 | 36 | 40 | 67 | 29 | np | np | np | np |
| urban station - mean | µg/m3 | 39 | 39 | 42 | 44 | 59 | 44 | 53 | 44 | 46 | 45 |
| urban station - maximum | µg/m3 | 50 | 59 | 59 | 59 | 70 | 66 | 71 | 55 | 63 | 55 |
| Ljubljana Bežigrad (DMKZ) | µg/m3 | 29 | 32 | 29 | 27 | 29 | 28 | 29 | 31 | 35 | 31 |
| Celje (DMKZ) | µg/m3 | 24 | 27 | 24 | 26 | 28 | 23 | 21 | 22 | 26 | |
| background station - mean | µg/m3 | 27 | 30 | 27 | 27 | 29 | 26 | 25 | 27 | 31 | 31 |
| background station - maximum | µg/m3 | 29 | 32 | 29 | 27 | 29 | 28 | 29 | 31 | 35 | 31 |
| 2012 | |||||||||||
| Maribor (DMKZ) | µg/m3 | 33 | |||||||||
| Ljubljana center (OMS Ljubljana) | µg/m3 | 52 | |||||||||
| Celje (EIS Celje) | µg/m3 | np | |||||||||
| urban station - mean | µg/m3 | 43 | |||||||||
| urban station - maximum | µg/m3 | 52 | |||||||||
| Ljubljana Bežigrad (DMKZ) | µg/m3 | 22 | |||||||||
| Celje (DMKZ) | µg/m3 | 27 | |||||||||
| background station - mean | µg/m3 | 25 | |||||||||
| background station - maximum | µg/m3 | 27 |
Database of automatic readings from the national network for monitoring air quality (DMKZ). Hydrology and State of the Environment office, Slovenian Environment Agency, 2012.
| 2001 | 2002 | 2003 | 2004 | 2005 | 2006 | 2007 | 2008 | 2009 | 2010 | ||
|---|---|---|---|---|---|---|---|---|---|---|---|
| Maribor (DMKZ) | µg/m3 | 48 | 50 | 58 | 48 | 43 | 43 | 40 | 34 | 30 | 33 |
| Celje (EIS Celje) | µg/m3 | 37 | 34 | 39 | 40 | 45 | 47 | 41 | np | np | np |
| Ljubljana center (OMS Ljubljana) | µg/m3 | np | np | np | no | np | 52 | 51 | 43 | 48 | 42 |
| urban station - mean | µg/m3 | 43 | 42 | 49 | 43 | 44 | 47 | 44 | 39 | 39 | 38 |
| urban station - maximum | µg/m3 | 48 | 50 | 58 | 46 | 45 | 52 | 41 | 44 | 48 | 42 |
| Ljubljana Bežigrad (DMKZ) | µg/m3 | 43 | 42 | 46 | 41 | 37 | 33 | 32 | 30 | 29 | 30 |
| Celje (DMKZ) | µg/m3 | 45 | 46 | 53 | 41 | 43 | 35 | 32 | 30 | 31 | 32 |
| background station - mean | µg/m3 | 44 | 44 | 50 | 41 | 40 | 34 | 32 | 30 | 30 | 31 |
| background station - maximum | µg/m3 | 45 | 46 | 53 | 41 | 43 | 35 | 32 | 30 | 31 | 32 |
| 2011 | 2012 | ||||||||||
| Maribor (DMKZ) | µg/m3 | 34 | 30 | ||||||||
| Celje (EIS Celje) | µg/m3 | np | |||||||||
| Ljubljana center (OMS Ljubljana) | µg/m3 | 44 | 45 | ||||||||
| urban station - mean | µg/m3 | 39 | 38 | ||||||||
| urban station - maximum | µg/m3 | 44 | 45 | ||||||||
| Ljubljana Bežigrad (DMKZ) | µg/m3 | 32 | 26 | ||||||||
| Celje (DMKZ) | µg/m3 | - | 31 | ||||||||
| background station - mean | µg/m3 | 32 | 29 | ||||||||
| background station - maximum | µg/m3 | 32 | 31 |
Database of automatic readings from the national network for monitoring air quality (DMKZ). Hydrology and State of the Environment office, Slovenian Environment Agency, 2012.
| 2005 | 2006 | 2007 | 2008 | 2009 | 2010 | 2011 | 2012 | ||
|---|---|---|---|---|---|---|---|---|---|
| Maribor (DMKZ) | number | 101 | 108 | 91 | 54 | 35 | 47 | 64 | 34 |
| Ljubljana center (OMS Ljubljana) | number | 101 | 112 | 74 | 94 | 107 | |||
| Celje (EIS Celje) | number | 89 | 92 | ||||||
| Celje (DMKZ) | number | 97 | 59 | 48 | 37 | 42 | 58 | 55 | |
| Ljubljana Bežigrad (DMKZ) - background station | number | 70 | 47 | 46 | 36 | 30 | 43 | 63 | 27 |
EEA, Exceedances of air quality objectives due to traffic, 2011.
| 2002 | 2003 | 2004 | 2005 | 2006 | 2007 | 2008 | ||
|---|---|---|---|---|---|---|---|---|
| urban station - mean | µg/m3 | 58 | 60.7 | 57.3 | 57.5 | 59.7 | 52.9 | 54 |
| urban station - maximum | µg/m3 | 80.6 | 107.2 | 109.7 | 112.4 | 110.7 | 102.7 | 115 |
| background station - mean | µg/m3 | 36 | 37.7 | 33.6 | 34.3 | 34.9 | 32.8 | 31 |
| background station - maximum | µg/m3 | 47.7 | 55.7 | 45.7 | 44.8 | 47.1 | 46.4 | 43 |
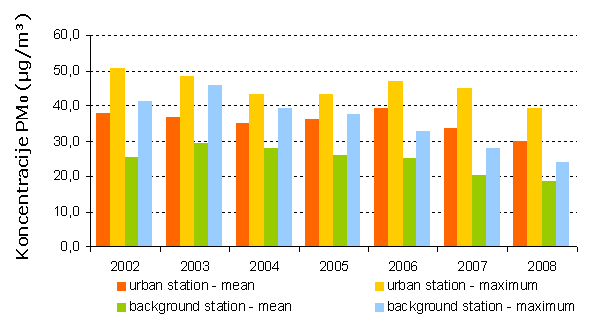
EEA, Exceedances of air quality objectives due to traffic, 2011.
| 2002 | 2003 | 2004 | 2005 | 2006 | 2007 | 2008 | ||
|---|---|---|---|---|---|---|---|---|
| urban station - mean | µg/m3 | 37.8 | 36.8 | 34.9 | 36.1 | 39.2 | 33.5 | 29.7 |
| urban station - maximum | µg/m3 | 50.5 | 48.3 | 43.3 | 43.4 | 46.9 | 44.7 | 39.1 |
| background station - mean | µg/m3 | 25.2 | 29.1 | 27.6 | 26.1 | 25.2 | 20.4 | 18.6 |
| background station - maximum | µg/m3 | 41.2 | 45.7 | 39.2 | 37.6 | 32.9 | 27.6 | 23.9 |


