[OP04] Environmental public awareness
[OP04] Environmental public awareness

Key message

.
Charts
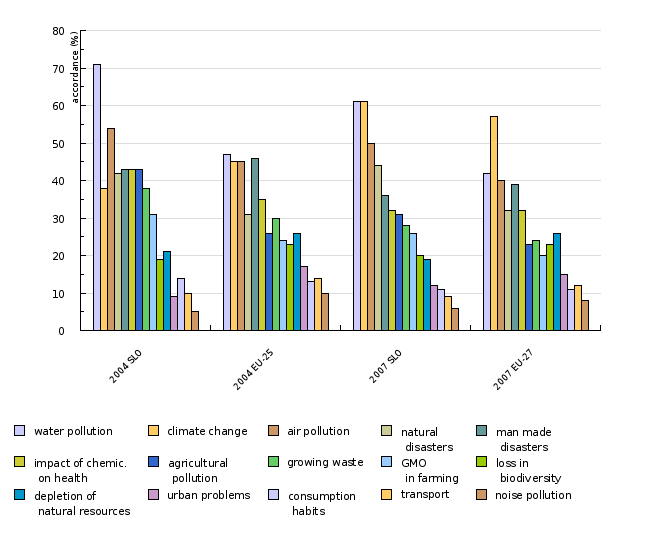
Figure OP04-1: Zaskrbljenost javnosti zaradi okoljskih problemov
Sources:
Eurobarometer: Attitudes of European citizens
towards the environment, 2004 in 2007
| 2004 SLO | 2004 EU-25 | 2007 SLO | 2007 EU-27 | ||
|---|---|---|---|---|---|
| water pollution | accordance | 71 | 47 | 61 | 42 |
| climate change | accordance | 38 | 45 | 61 | 57 |
| air pollution | accordance | 54 | 45 | 50 | 40 |
| natural disasters |
accordance | 42 | 31 | 44 | 32 |
| man made disasters |
accordance | 43 | 46 | 36 | 39 |
| impact of chemic. on health |
accordance | 43 | 35 | 32 | 32 |
| agricultural pollution |
accordance | 43 | 26 | 31 | 23 |
| growing waste | accordance | 38 | 30 | 28 | 24 |
| GMO in farming |
accordance | 31 | 24 | 26 | 20 |
| loss in biodiversity |
accordance | 19 | 23 | 20 | 23 |
| depletion of natural resources |
accordance | 21 | 26 | 19 | 26 |
| urban problems | accordance | 9 | 17 | 12 | 15 |
| consumption habits |
accordance | 14 | 13 | 11 | 11 |
| transport | accordance | 10 | 14 | 9 | 12 |
| noise pollution | accordance | 5 | 10 | 6 | 8 |
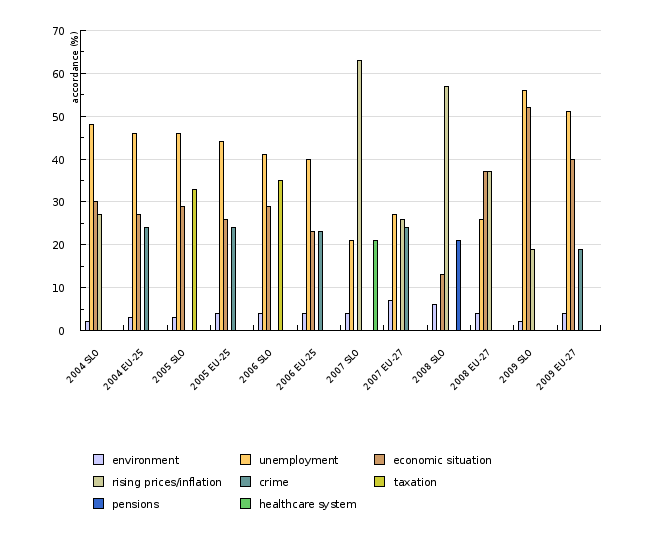
Figure OP04-2: Najpomembnejše zadeve, s katerimi se sooča Slovenija, s poudarkom na okolju
Sources:
Eurobarometer 62, 64, 66, 68, 70, 72
| 2004 SLO | 2004 EU-25 | 2005 SLO | 2005 EU-25 | 2006 SLO | 2006 EU-25 | 2007 SLO | 2007 EU-27 | 2008 SLO | 2008 EU-27 | ||
|---|---|---|---|---|---|---|---|---|---|---|---|
| environment | accordance (%) | 2 | 3 | 3 | 4 | 4 | 4 | 4 | 7 | 6 | 4 |
| unemployment | accordance (%) | 48 | 46 | 46 | 44 | 41 | 40 | 21 | 27 | 26 | |
| economic situation | accordance (%) | 30 | 27 | 29 | 26 | 29 | 23 | 13 | 37 | ||
| rising prices/inflation | accordance (%) | 27 | 63 | 26 | 57 | 37 | |||||
| crime | accordance (%) | 24 | 24 | 23 | 24 | ||||||
| taxation | accordance (%) | 33 | 35 | ||||||||
| pensions | accordance (%) | 21 | |||||||||
| healthcare system | accordance (%) | 21 | |||||||||
| 2009 SLO | 2009 EU-27 | ||||||||||
| environment | accordance (%) | 2 | 4 | ||||||||
| unemployment | accordance (%) | 56 | 51 | ||||||||
| economic situation | accordance (%) | 52 | 40 | ||||||||
| rising prices/inflation | accordance (%) | 19 | |||||||||
| crime | accordance (%) | 19 | |||||||||
| taxation | accordance (%) | ||||||||||
| pensions | accordance (%) | ||||||||||
| healthcare system | accordance (%) |
Figure OP04-3: Prednostne naloge državljanov pri varovanju okolja, kot jih vidimo Slovenci v primerjavi s povprečjem EU
Sources:
Eurobarometer: Attitudes of European citizens
towards the environment, 2004 in 2007
| 2004 SLO | 2004 EU-25 | 2007 SLO | 2007 EU-27 | ||
|---|---|---|---|---|---|
| Waste sorting | accordance (%) | 87 | 72 | 69 | 55 |
| Reduction in energy consumption | accordance (%) | 43 | 39 | 52 | 47 |
| Use of public transport | accordance (%) | 22 | 30 | 48 | 38 |
| Waste reduction | accordance (%) | 28 | 32 | 26 | 30 |
| Buying eco-friendly products | accordance (%) | 49 | 31 | 25 | 23 |
| Consider environmental aspects in the higher expenditures | accordance (%) | 29 | 24 | 15 | 15 |
| Paying higher taxes for environmental protection |
accordance (%) | 4 | 5 | 2 | 3 |
Figure OP04-4: Število dogodkov in udeležencev v Okoljskem centru ter število obiskovalcev Info točke
Sources:
Okoljski center, 2010
| February 2008 | March 2008 | April 2008 | May 2008 | June 2008 | July 2008 | August 2008 | September 2008 | October 2008 | November 2008 | ||
|---|---|---|---|---|---|---|---|---|---|---|---|
| Events in Environment centre | number | 5 | 3 | 19 | 11 | 13 | 2 | 5 | 12 | 12 | 15 |
| Event participants | number | 37 | 164 | 201 | 122 | 162 | |||||
| Info Point visitors | number | 4 | 9 | 10 | 9 | 2 | 2 | 1 | 2 | 1 | 3 |
| December 2008 | January 2009 | February 2009 | March 2009 | April 2009 | May 2009 | June 2009 | July 2009 | August 2009 | September 2009 | ||
| Events in Environment centre | number | 9 | 9 | 9 | 11 | 9 | 10 | 13 | 0 | 0 | 14 |
| Event participants | number | 84 | 99 | 61 | 213 | 66 | 67 | 160 | 302 | ||
| Info Point visitors | number | 7 | 2 | 8 | 3 | 12 | 9 | 1 | 6 | 3 | |
| October 2009 | November 2009 | December 2009 | January 2010 | February 2010 | March 2010 | ||||||
| Events in Environment centre | number | 11 | 16 | 14 | 16 | 17 | 11 | ||||
| Event participants | number | 122 | 201 | 194 | 225 | 206 | 87 | ||||
| Info Point visitors | number | 6 | 2 | 4 | 2 | 6 | 5 |


