[EN21] Energy taxes

Key message

In recent years, energy taxes, with the exception of the tax on natural gas for households, did not significantly increase. Energy for households is subject to higher tax than energy used in industry. In Slovenia, energy tax is below the average level in the EU-27; the share of taxes in the final energy price is also lower.
Definition
The indicator Energy tax shows the level of taxation of individual energy products. Electricity tax is indicated in EUR per kilowatt hour (EUR/kWh), natural gas tax in EUR per gigajoul (EUR/GJ), and liquid fuel tax in EUR per litre of fuel (EUR/l).
Electricity and natural gas taxes show the level of taxation for typical consumer groups for industrial and household consumers; however, the tax for industrial consumers does not consider the value-added tax (VAT).
Charts
Statistical Office of the RS, 2009.
| Electricity - industry | Natural gas - industry | Electricity - households | Natural gas - households | Diesel D2 - transport | Petrol UMG 95 - transport | Light fuel oil - heating | ||
|---|---|---|---|---|---|---|---|---|
| 1995-2008 | % | -61.1 | 228.8 | 173.9 | 868.5 | 85 | 101.9 | 445.2 |
| 2000-2008 | % | 0 | 31 | 30.4 | 75.1 | 10.4 | 28.3 | 24.7 |
| 1995-2000 | % | -100 | 151 | 110 | 453 | 67.5 | 57.4 | 337.4 |
| 2000-2007 | % | 0 | 31 | 30.4 | 75.1 | 10.4 | 28.3 | 24.7 |
Statistical Office of the RS, 2009.
| 1992 | 1993 | 1994 | 1995 | 1996 | 1997 | 1998 | 1999 | 2000 | 2001 | ||
|---|---|---|---|---|---|---|---|---|---|---|---|
| Electricity - industry | EUR/kWh | 0.0077 | 0.0048 | 0.0047 | 0.0051 | 0.0052 | 0.0054 | 0.0063 | 0.0061 | 0 | 0 |
| Electricity - households | EUR/kWh | 0.01 | 0.0065 | 0.0062 | 0.0068 | 0.0069 | 0.007 | 0.0082 | 0.0081 | 0.0143 | 0.0142 |
| 2002 | 2003 | 2004 | 2005 | 2006 | 2007 | 2008 | |||||
| Electricity - industry | EUR/kWh | 0 | 0 | 0 | 0 | 0 | 0 | 0.002 | |||
| Electricity - households | EUR/kWh | 0.0146 | 0.014 | 0.0141 | 0.0144 | 0.0144 | 0.014 | 0.019 |
Statistical Office of the RS, 2009.
| 1995 | 1996 | 1997 | 1998 | 1999 | 2000 | 2001 | 2002 | 2003 | 2004 | ||
|---|---|---|---|---|---|---|---|---|---|---|---|
| natural gas - industry | EUR/GJ | 0.1894 | 0.1705 | 0.3525 | 0.4265 | 0.6824 | 0.4754 | 0.629 | 0.7335 | 0.6933 | 0.6711 |
| natural gas - households | EUR/GJ | 0.2743 | 0.2528 | 0.4338 | 0.4671 | 0.7492 | 1.5168 | 2.1368 | 2.1232 | 2.0798 | 2.0204 |
| 2005 | 2006 | 2007 | 2008 | ||||||||
| natural gas - industry | EUR/GJ | 0.6612 | 0.6508 | 0.621 | 0.623 | ||||||
| natural gas - households | EUR/GJ | 2.0984 | 2.4284 | 2.441 | 2.657 |
Statistical Office of the RS, 2009; Petrol, 2009.
| 1995 | 1996 | 1997 | 1998 | 1999 | 2000 | 2001 | 2002 | 2003 | 2004 | ||
|---|---|---|---|---|---|---|---|---|---|---|---|
| Diesel D2 - transport | EUR/l | 0.2089 | 0.2087 | 0.1908 | 0.2264 | 0.2967 | 0.35 | 0.351 | 0.3383 | 0.321 | 0.3581 |
| Petrol UMG 95 - transport | EUR/l | 0.2149 | 0.2186 | 0.1978 | 0.2499 | 0.3139 | 0.3382 | 0.3948 | 0.4555 | 0.4316 | 0.4414 |
| Light fuel oil - heating | EUR/l | 0.0251 | 0.0366 | 0.0335 | 0.0503 | 0.0974 | 0.1097 | 0.1262 | 0.1118 | 0.1061 | 0.122 |
| 2005 | 2006 | 2007 | 2008 | ||||||||
| Diesel D2 - transport | EUR/l | 0.398 | 0.3733 | 0.366 | 0.386 | ||||||
| Petrol UMG 95 - transport | EUR/l | 0.4534 | 0.4208 | 0.419 | 0.434 | ||||||
| Light fuel oil - heating | EUR/l | 0.1467 | 0.1236 | 0.112 | 0.137 |
Statistical Office of the RS, 2009.
| 2000-2008 | 2007-2008 | ||
|---|---|---|---|
| Natural gas: households - taxes total | % | 7.3 | 8.8 |
| Natural gas: households - excise duty and CO2 tax | % | 19.8 | -1 |
| Natural gas: households - VAT | % | 8.8 | 12.2 |
| Natural gas: industry - excise duty and CO2 tax | % | 3.4 | 0.3 |
| Diesel D2 - transport - taxes total | % | 0.6 | -1.5 |
| Diesel D2 - transport - excise duty | % | -1.5 | -10.5 |
| Diesel D2 - transport - VAT | % | 5.1 | 18 |
| Petrol NMB 95 - transport - taxes total | % | 2.4 | -6.6 |
| Petrol NMB 95 - transport - excise duty | % | 0.9 | -14.1 |
| Petrol NMB 95 - transport - VAT | % | 6.1 | 12.4 |
| Fuel oil - heating - taxes total | % | 2.8 | 22.2 |
| Fuel oil - heating - excise duty and CO2 tax | % | -3.9 | -0.9 |
| Fuel oil - heating - VAT | % | 7.8 | 36.4 |
Statistical Office of the RS, 2009; Petrol, 2009.
| Petrol UMG 95 - transport | Diesel D2 - transport | Fuel oil - heating | Natural gas - households | Electricity - households | Natural gas - industry | Electricity - industry | ||
|---|---|---|---|---|---|---|---|---|
| 1995 | % | 49.5 | 51.8 | 11.9 | 4.8 | 9.1 | 4.8 | 9.1 |
| 2000 | % | 62.4 | 60.1 | 33.8 | 23.3 | 16 | 8.3 | 0 |
| 2006 | % | 49.1 | 44.1 | 24.1 | 21.7 | 20.6 | 6.5 | 2.7 |
Eurostat, 2008.
| EU-15 | BE | BG | CZ | DK | DE | EE | IE | GR | ES | ||
|---|---|---|---|---|---|---|---|---|---|---|---|
| industry | % | 100 | 82 | 5 | 0 | 62 | 113 | 0 | 0 | 0 | 38 |
| households | % | 100 | 94 | 30 | 45 | 375 | 137 | 31 | 52 | 16 | 59 |
| FR | IT | CY | LV | LT | LU | HU | MT | NL | AT | ||
| industry | % | 42 | 330 | 20 | 0 | 0 | 29 | 7 | 0 | 101 | 152 |
| households | % | 77 | 178 | 53 | 28 | 31 | 47 | 54 | 13 | 207 | 132 |
| PL | PT | RO | SI-08 | SK | FI | SE | UK | SI-07 | SI-00 | ||
| industry | % | 48 | 0 | 0 | 24 | 0 | 21 | 5 | 22 | 0 | 0 |
| households | % | 72 | 21 | 43 | 47 | 65 | 75 | 166 | 16 | 47 | 54 |
Eurostat, 2008.
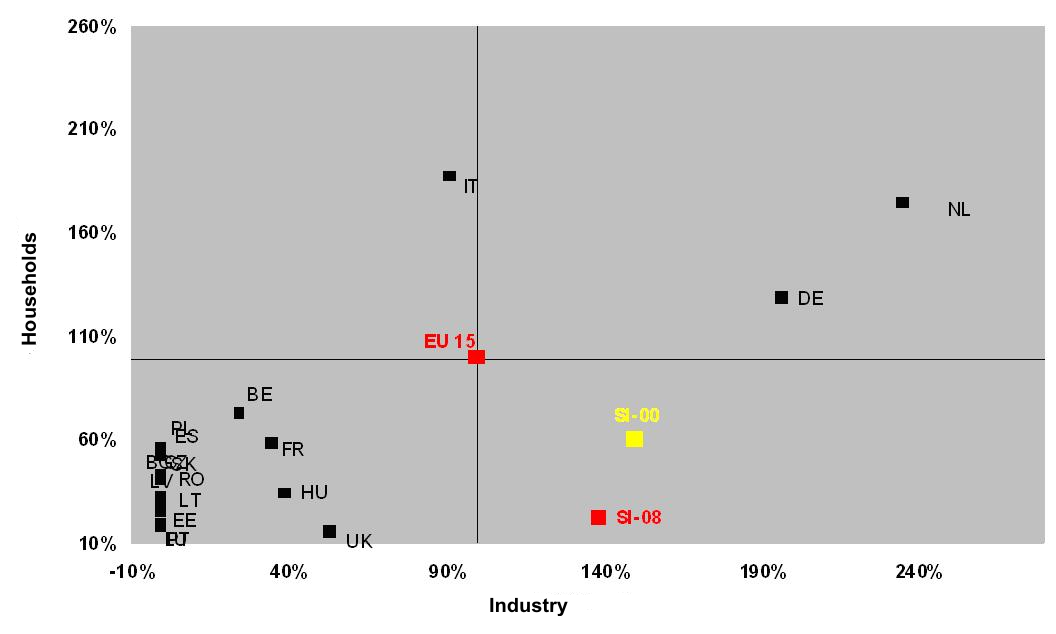
| EU-15 | BE | BG | CZ | DK | DE | EE | ES | FR | IT | ||
|---|---|---|---|---|---|---|---|---|---|---|---|
| industry | % | 100 | 25 | 0 | 0 | 132 | 196 | 0 | 0 | 35 | 91 |
| households | % | 100 | 73 | 42 | 43 | 493 | 128 | 26 | 56 | 58 | 187 |
| LV | LT | LU | HU | NL | AT | PL | PT | RO | SI-08 | ||
| industry | % | 0 | 0 | 0 | 39 | 235 | 377 | 0 | 0 | 0 | 139 |
| households | % | 33 | 31 | 19 | 34 | 175 | 144 | 55 | 19 | 41 | 22 |
| SK | SE | UK | SI-00 | SI-07 | |||||||
| industry | % | 0 | 203 | 53 | 150 | 140 | |||||
| households | % | 53 | 329 | 16 | 61 | 89 |
Oil Buletin, 2008.
| EA-15 | BE | CZ | DK | DE | EE | IE | GR | ES | FR | ||
|---|---|---|---|---|---|---|---|---|---|---|---|
| UMG 95 | % | 100 | 111 | 82.5 | 104.6 | 111.2 | 65.7 | 83.1 | 68.4 | 71.5 | 105.1 |
| D2 | % | 100 | 85.4 | 96.8 | 101.2 | 112.3 | 84 | 96.9 | 80.9 | 76.8 | 104.3 |
| IT | LV | LT | LU | HU | MT | NL | AU | PL | PT | ||
| UMG 95 | % | 101 | 58.4 | 61.2 | 78.3 | 77.6 | 60.9 | 115.5 | 87.1 | 85.6 | 105.5 |
| D2 | % | 106.5 | 69.5 | 72.8 | 73.1 | 90.4 | 67.5 | 95.5 | 97.2 | 89.6 | 103.2 |
| SI-08 | SK | FI | SE | UK | |||||||
| UMG 95 | % | 68.5 | 82.8 | 109.4 | 104.1 | 112.7 | |||||
| D2 | % | 80.4 | 105.3 | 90.7 | 115.7 | 149.9 |
Goals
Specific objectives with regard to the taxation of energy products are set by the energy policy at the EU level together with the Directive (2003/96/EC) on the taxation of fuels and electricity. The Directive stipulates minimum levels of taxation of individual energy products, which are mandatory for all Member States. The main purpose of the Directive is to establish better competitiveness between energy products and eliminate the price disparities between Member States, which happened due to differences in the levels of taxation.
The Resolution on the National Energy Programme also indicates a »green tax reform«; however, the state is still waiting for its implementation.
Comment
In the majority of countries, the basic purpose of energy taxation is of a fiscal nature, since energy taxes represent primarily a source of funds inside the national budget. However, the role of energy tax is not only of a budgetary nature. Energy taxation represents a good method of internalising external costs. By implementing energy taxation, the state influences the final level of energy prices, through which it can also directly and indirectly influence energy consumption. With higher energy taxation, the state also encourages final users to reduce their energy consumption, which again reduces the impact on the environment. On the other hand, through energy taxation the state interferes with the price relations, which also influences the replacement of environmentally-harmful fuels with fuels that are less harmful to the environment.
The current practice of shaping taxes in the area of energy indicates that energy tax is determined by the state with its fiscal policy, whereby the state energy policy plays only a side role in the shaping of taxes. Energy taxes are currently the only mechanism, available to the state, through which the state can influence the final price of individual energy products.
The green tax reform, which would encourage sustainable behaviour by producers and consumers, is one of the possible answers to the challenges of environmental pollution due to incorrect market signals. The purpose of the green tax reform is to solve the described problem by redistributing the tax burden from work tax to environment tax (on the use of energy or other resources and raw materials, environmentally dangerous substances and products) and reforming the policy of incentives (for instance, the suspension of environmentally dangerous incentives). A key characteristic of the green tax reform is that the introduction of new environmental taxes does not lead to a general increase in taxation, but that the tax burden is only redistributed. Although in Slovenia we have a developed system of environmental taxation, a comprehensive green tax reform would contribute to better energy efficiency.
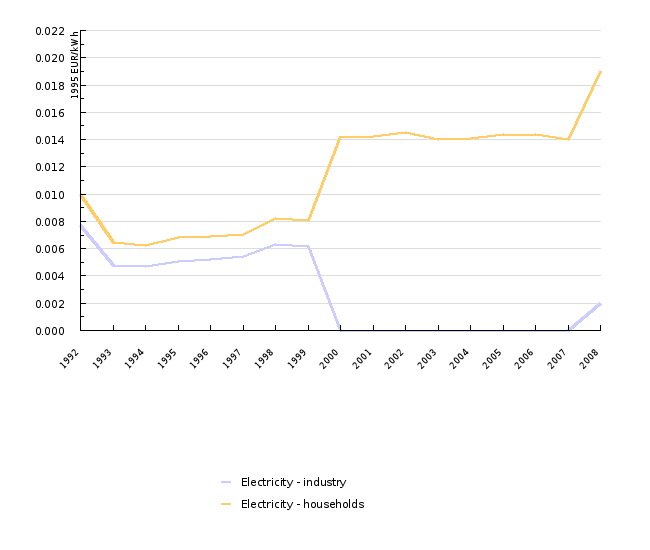
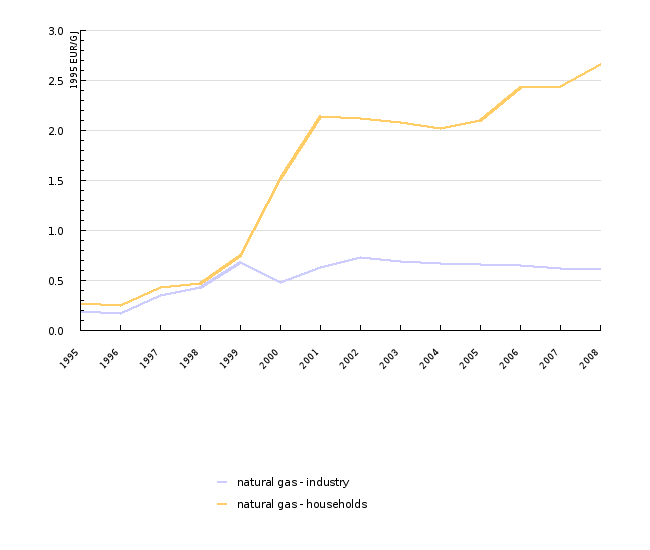
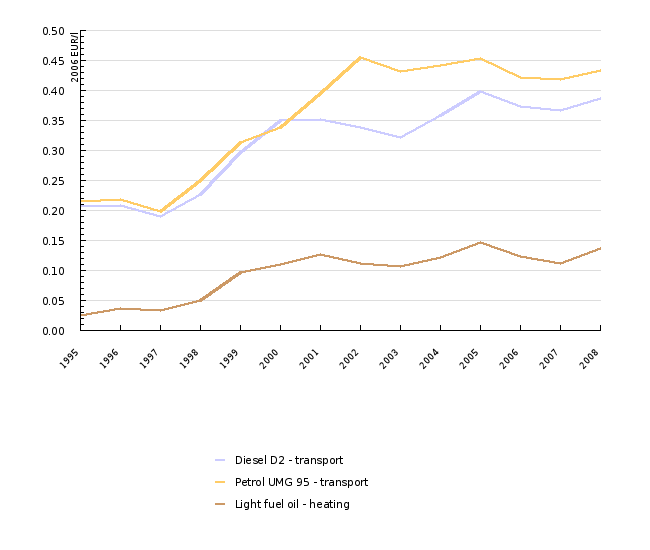
In general, energy tax has increased in real terms since 1995; the only exception is the electricity tax for industrial consumers, where the direct taxation decreased due to the introduction of VAT. The biggest taxation changes appeared for natural gas for household consumers, where the taxes increased in real terms by almost 800 % (it is necessary to consider the relatively small level of taxation in 1995), and for heating oil, where the taxes increased in real terms by almost 350 %.
Households
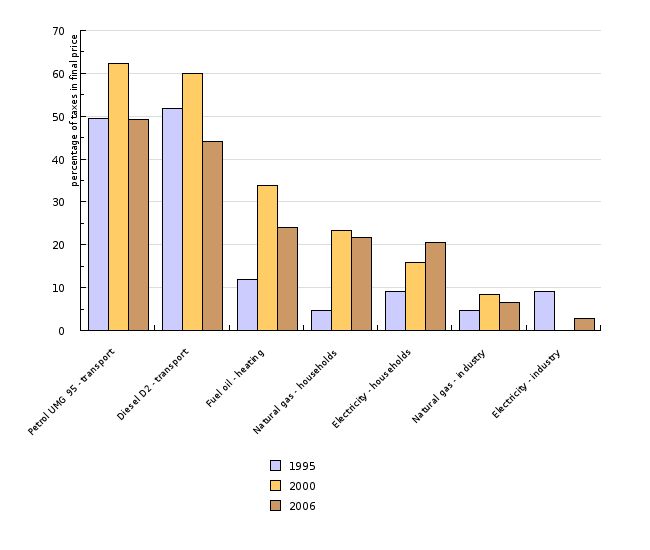
In Slovenia, approximately the same taxes were in force for electricity for households in the period 1992–2000. In 1999 VAT was introduced, due to which the taxation level in households increased by half. In 2006, VAT was the only electricity tax paid by households; however, in 2007 an excise duty on electricity was also introduced. The price for 2007 is the basic price for the first half of this year, including the excise duty, which amounts to 0 €. In the price for 2008, the excise duty is already considered and amounts to 0.002€ 1995. For natural gas in the period from 1995–2000, a moderate growth of taxes is typical, which is also the main reason for the significant increase in natural gas prices in this period. After 2000, the natural gas tax increased primarily for household consumers, mainly due to the introduction of the tax on CO2 and excise duties; the introduction of VAT was not such a significant factor (see Figure 5). The share of taxes in the final price of electricity in 2008 amounted to 20.6 %, which is more than in 2000 and 1995 when the share of taxes represented 16 % or 9.1 % of the final price. The main reason for such an increase was the introduction of VAT and an increase in the VAT level from 19 % to 20 % (1 January 2002).
Industry
With the introduction of VAT in industry, tax is no longer considered a direct tax burden, which means that after its introduction electricity for industrial consumers was not subject to tax; in 2008, the impact of excise duty could already be noticed. Taxes on natural gas in industry increased in the period 2000–2008 primarily due to the introduction of excise duties and higher taxes on CO2 (see Figure 5). In general, the share of taxes in the final price in industry is lower than in households. The share of taxes in the final price of natural gas amounted in 2008 to 6.5 %, which is more than in 1995 when this share was 4.8 % and slightly less than the share of taxes in 2000.
Oil derivatives
A relatively high level of taxes was typical for oil derivatives in the period 1995–2000. After the introduction of VAT in 1999, a period of moderate growth followed, with the exception of UMG 95 fuel where the taxes increased until 2002. In the period 1995–2000, the real growth of final prices of oil derivatives is mainly a result of higher taxes (introduction of excise duty and VAT); taxes after 2000 do not significantly influence the growth of final prices. The share of taxes in the final price of energy was in 2008, with regard to 1995, higher for UMG 95 fuel and heating oil; however, in comparison with 2000 it decreased as a result of a significant increase in basic prices, while the taxes did not significantly increase. The main reason for such a high share of taxes in the final price of oil derivatives was the introduction of the environmental tax on CO2 emissions (for heating oil), excise duty and VAT.
In general, energy tax in Slovenia is lower than the average tax in the EU-15, including the electricity tax in 2008 for industrial and household consumers. Electricity for industrial consumers in the first half of 2007 was not subject to tax; on the other hand, the average taxation in the EU-15 was 10.9 €/MWh. Electricity tax for household consumers in the EU-15 amounted to 37.6 €/MWh, and in Slovenia to 17.1 €/MWh.
Natural gas tax for industry in the EU-15 amounted on average in 2007 to 0.57 €/GJ, which represents a 28 % lower tax rate than in Slovenia. Natural gas tax for households in the EU-15 in 2007 amounted to 3.49 €/GJ, which is 12 % more than in Slovenia (3.11 €/GJ) (see Figure 7, Figure 8, Figure 9).
In Slovenia, the share of taxes on final energy is smaller than the share of taxes in the EU-15; the only exception is the tax on natural gas for industrial consumers (see Figure 6).
In comparison with the EA-15, tax on motor fuel in 2008 was by 30 % lower for UMG gasoline and 20 % lower for diesel fuel. A comparison with the neighbouring countries shows that taxes on motor fuel in 2008 in Austria, Italy and Hungary were higher than in Slovenia (see Figure 9).
Methodology
Data for Slovenia and other countries
Objectives summarised by: Resolucija o Nacionalnem energetskem programu (ReNEP)(Resolution on the National Energy Programme, Official Gazette of the RS, No. 57/04) in Directive (2003/96/EC) on the taxation of fuels and electricity.
Source database or source: The data on prices of energy products (prices before taxes, prices without VAT and prices with all taxes) are published by SORS on the SI-STAT Data Portal > Environment and natural resources > Energy > Prices of energy sources for all consumer groups.
Data administrator: Statistical Office of the Republic of Slovenia (Mojca Suvorov) and Eurostat.
Data acquisition date for the indicator: 5 December 2009.
Methodology and frequency of data collection for the indicator: The data for energy prices are published twice a year; namely, the prices in force on 1 January are published by SORS in the second week of March, and the prices of 1 July of the current year by SORS in the second week of September.
SORS has been collecting data since 1992 for electricity and since 1995 for natural gas. The prices of oil derivatives have been available since 1999; the data on prices and taxes before that year are available at Petrol.
The most representative consumer groups for industrial consumers of natural gas and electricity are I3 for consumers of natural gas and Id for consumers of electricity. For household consumers, the most representative consumer groups are D2 for consumers of natural gas and Dc for consumers of electricity.
Data processing methodology: The energy prices published by SORS are current prices. Since these are nominal categories, changes in prices do not reflect real changes. Real changes in prices and taxes are reflected only by real prices and taxes, which are calculated by the deflation of nominal prices with the GDP deflator, which is published by SORS for every previous year. The energy tax that is indicated in the data sheet is the real tax; deflators that converted nominal tax to the level of real tax of 1995 were used for the calculation. The real tax of 1995 was converted into EUR 1995 with the use of the average annual exchange rate of the Bank of Slovenia in 1995. Such a calculation enables better comparability of energy taxes in Slovenia with average taxes in the EU.
Real energy taxes are calculated as:
TRt = [(Rt*1/D1995,t)/er1995]
PR-real prices, P – current prices, D – deflator, er – exchange rate.
Geographical coverage: The EA-15 (Euro Area) is composed of: Austria, Belgium, Cyprus, Finland, France, Germany, Greece, Ireland, Italy, Luxembourg, Malta, the Netherlands, Portugal, Spain, and Slovenia. EA-16 = (From 1 January 2009 EA-15 + Slovakia). The EU-15 includes old EU Member States (Austria, Belgium, Denmark, Finland, France, Germany, Greece, Ireland, Italy, Luxembourg, the Netherlands, Portugal, Spain, Sweden, the United Kingdom). The EU-10 includes Member States that joined the EU in 2004 (Cyprus, Czech Republic, Estonia, Hungary, Lithuania, Latvia, Malta, Poland, Slovenia, Slovakia). The EU-12 includes, besides the EU-10, Bulgaria and Romania. The EU-27 includes the EU-15 and EU-12, while the EU-25 includes the EU-15 and EU-10.
Information concerning data quality:
- Advantages and disadvantages: The source of basic data for the entire time series for electricity and natural gas is SORS, which enables a more efficient and consistent analysis of individual sectors; only for fuel tax before 1999, it was necessary to obtain data from the largest fuel dealer in Slovenia (Petrol).
- Relevance, accuracy, robustness, uncertainty:
Reliability of the indicator (archive data): The data reflect the prices by individual consumer groups that were in force on the first day of January and July.
Uncertainty of the indicator (scenarios/projections): Scenarios and projections are not available.
- Overall assessment (1 = no major comments, 3 = data to be considered with reservation):
Relevance: 1
Accuracy: 2
Completeness over time: 1
Completeness over space: 1
Other sources and literature:
- Directive 2003/96/EC of restructuring the Community framework for the taxation of energy products and electricity.
- Ministry of the Economy, 2007. Letni energetski pregled za leto 2005 (Annual energy review for 2005).


