[NV02] Protected areas 

Key message

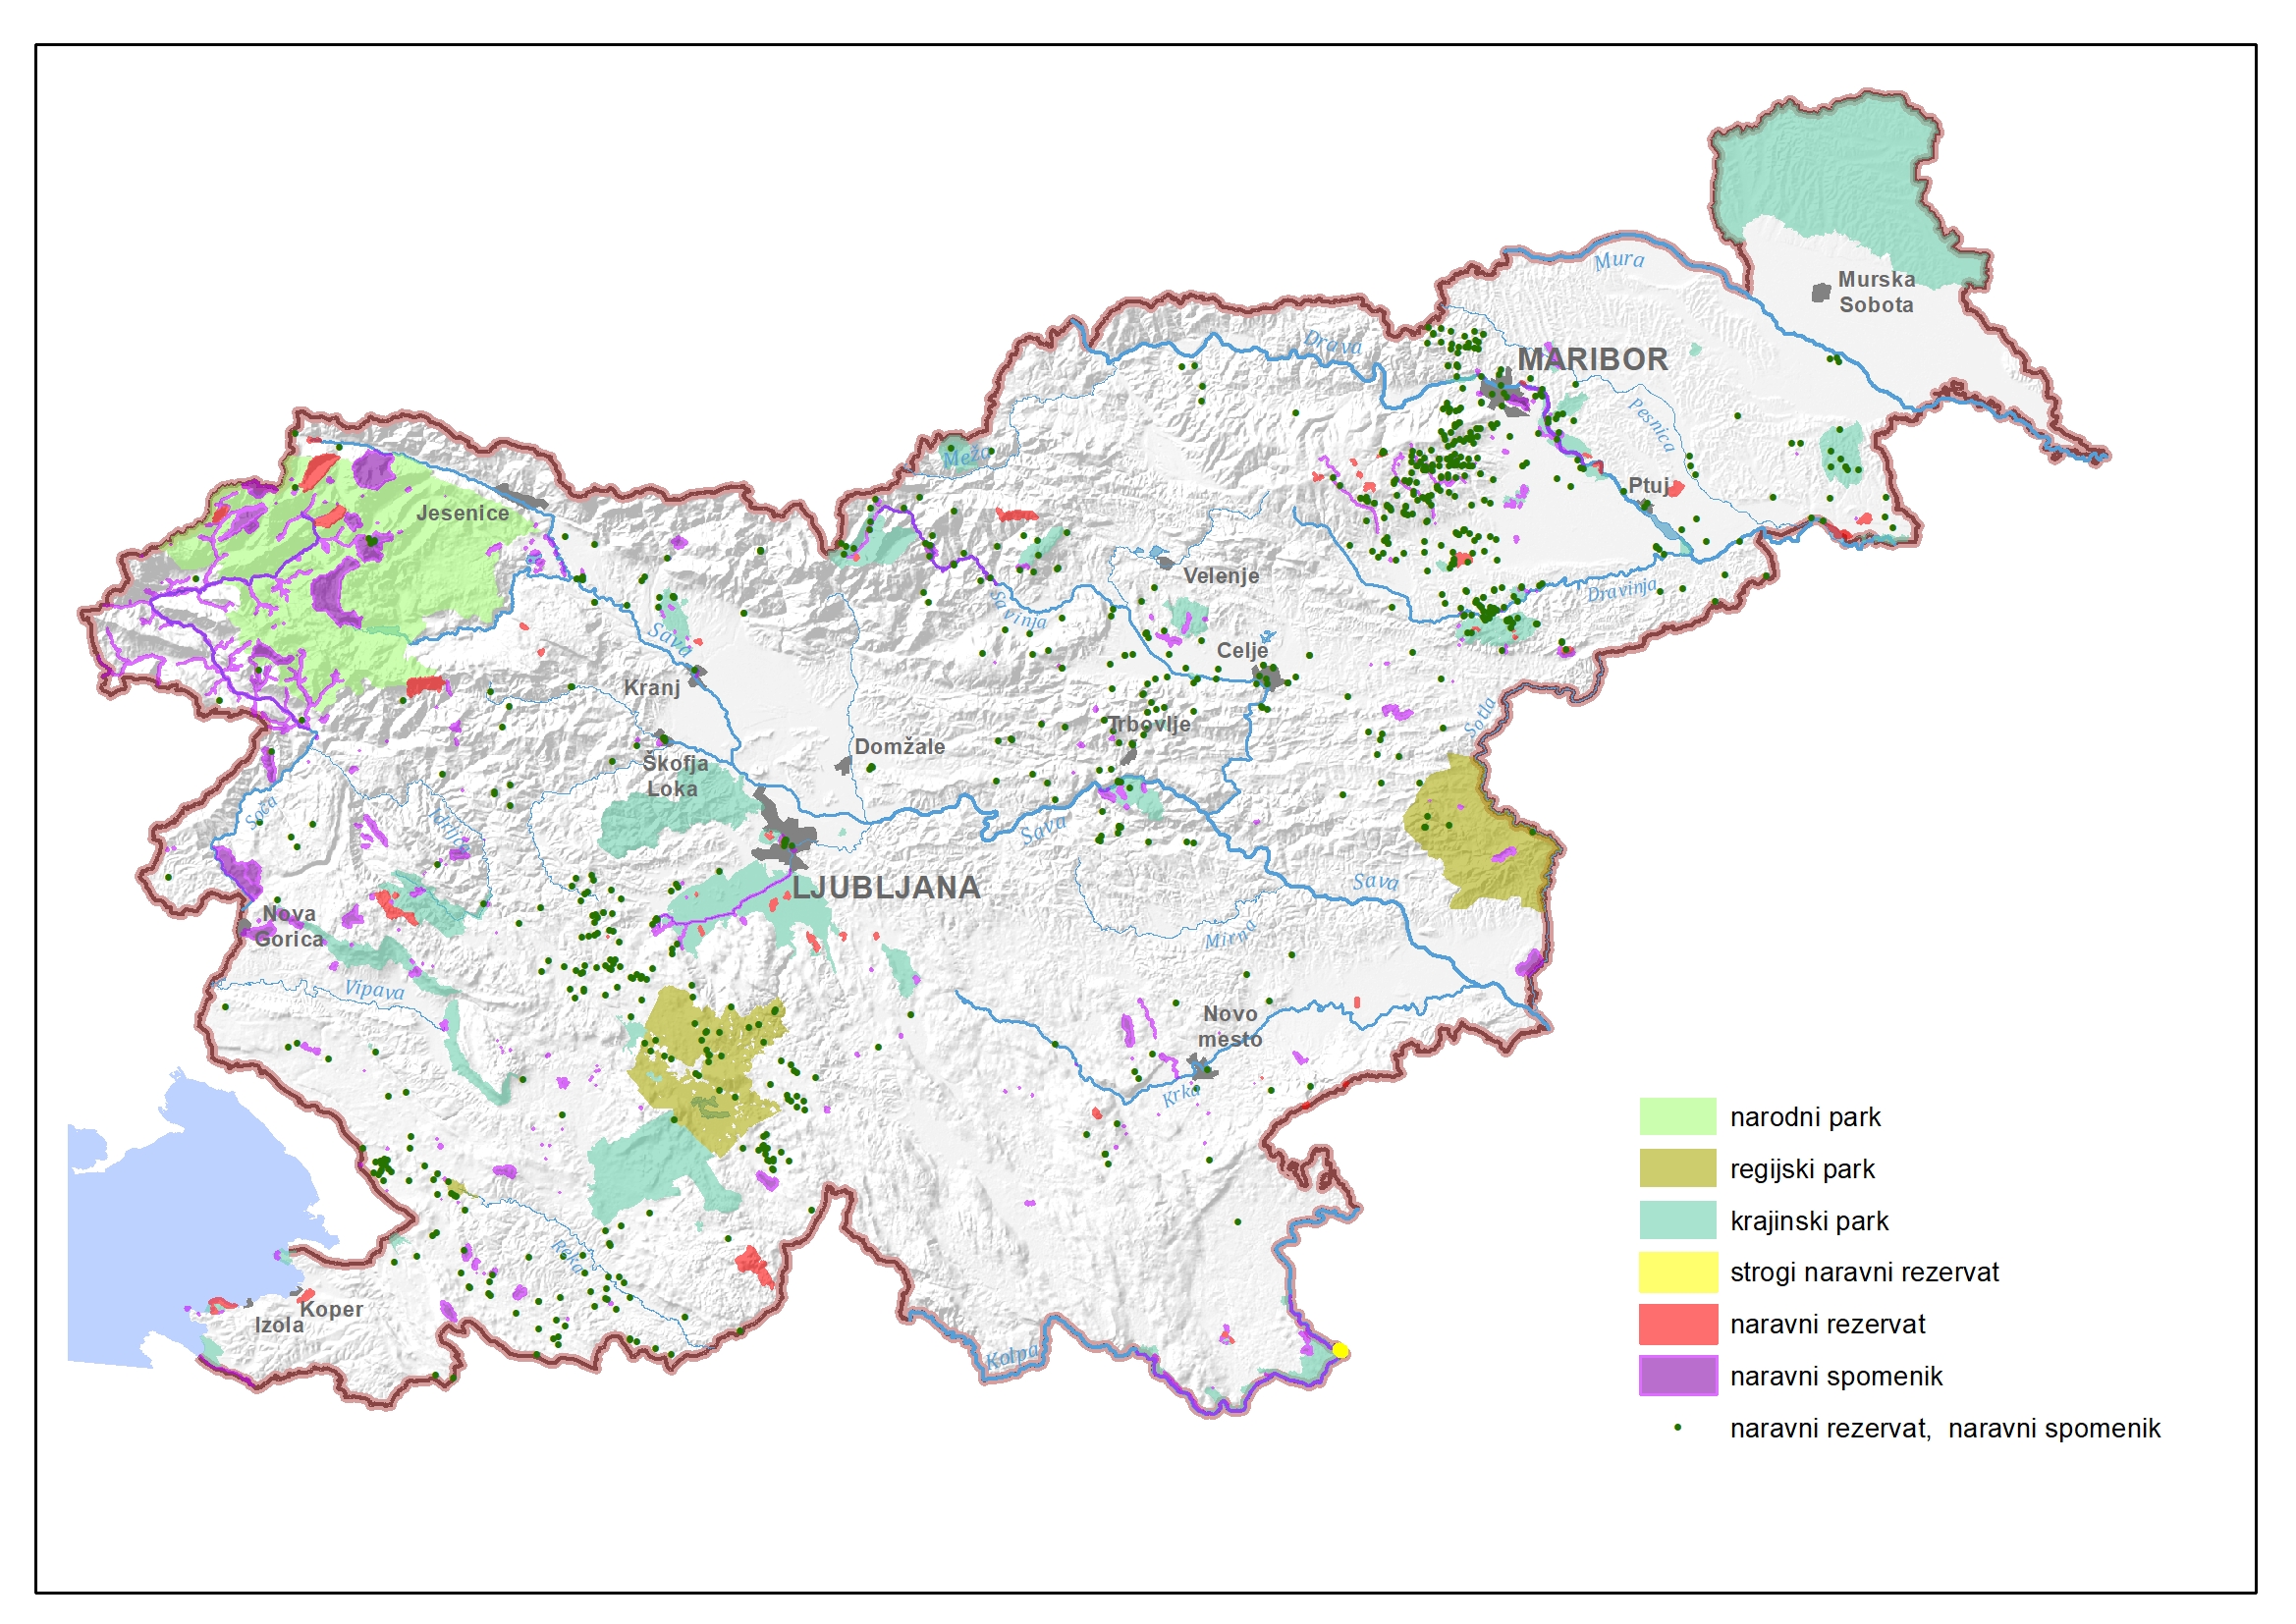
Areas of protected nature are a measure of the state to preserve natural values and biodiversity in situ. They cover more than 13% of Slovenia’s territory. The largest and the oldest protected area is Triglav National Park, covering almost 84,000 hectares. In recent years, the total surface area of protected areas has expanded largely due to the designation of three landscape parks.
Definition
This indicator shows the surface area of protected areas in Slovenia with regard to the type of protection and the category in accordance with the criteria of the International Union for Conservation of Nature (IUCN). We differentiate among large (national, regional, landscape parks) and small (strict nature reserves, nature reserves and natural monuments) protected areas where prescribed protection regimes apply.
Charts
Register of protected areas, Slovenian Environment Agency, 2021 (17. 06. 2021)
Register of protected areas, Slovenian Environment Agency, 2021 (17. 06. 2021)
| total[%] | natural monument[%] | nature reserve[%] | landscape park[%] | regional park[%] | national park[%] | total[ha] | natural monument[ha] | strict natura reserve[ha] | nature reserve[ha] | landscape park[ha] | regional park[ha] | national park[ha] | |
|---|---|---|---|---|---|---|---|---|---|---|---|---|---|
| 1992 | 7.81 | 0.50 | 0.24 | 2.19 | 1.00 | 4.13 | 158363.15 | 10200.18 | 4818.26 | 44392.35 | 20308.84 | 83808.04 | |
| - | |||||||||||||
| 2002 | 9.61 | 0.61 | 0.25 | 2.80 | 2.12 | 4.13 | 194905.65 | 12382.00 | 5007.12 | 56861.23 | 42991.40 | 83808.04 | |
| 2003 | 11.90 | 0.61 | 0.25 | 5.09 | 2.12 | 4.13 | 241173.92 | 12382.00 | 5007.12 | 103129.50 | 42991.40 | 83808.04 | |
| 2004 | 11.89 | 0.59 | 0.25 | 5.10 | 2.12 | 4.13 | 241019.64 | 11942.87 | 5072.08 | 103396.04 | 42991.40 | 83808.04 | |
| 2005 | 11.89 | 0.59 | 0.25 | 5.10 | 2.12 | 4.13 | 241019.64 | 11942.87 | 5072.08 | 103396.04 | 42991.40 | 83808.04 | |
| 2006 | 11.89 | 0.60 | 0.25 | 5.10 | 2.12 | 4.13 | 241072.45 | 12186.59 | 5072.08 | 103437.13 | 42991.40 | 83808.04 | |
| 2007 | 11.89 | 0.60 | 0.25 | 5.10 | 2.12 | 4.13 | 241072.45 | 12186.59 | 5072.08 | 103437.13 | 42991.40 | 83808.04 | |
| 2008 | 12.56 | 0.64 | 0.26 | 5.77 | 2.12 | 4.13 | 254596.16 | 13050.01 | 1.81 | 5252.81 | 117007.68 | 42991.40 | 83808.04 |
| 2009 | 12.56 | 0.64 | 0.26 | 5.77 | 2.12 | 4.13 | 254596.16 | 13050.01 | 1.81 | 5252.81 | 117007.68 | 42991.40 | 83808.04 |
| 2010 | 12.56 | 0.95 | 0.27 | 5.69 | 2.12 | 4.14 | 254677.45 | 19267.72 | 1.81 | 5472.89 | 115280.17 | 42991.40 | 83981.98 |
| 2011 | 12.56 | 0.95 | 0.27 | 5.69 | 2.12 | 4.14 | 254677.45 | 19267.72 | 1.81 | 5472.89 | 115280.17 | 42991.40 | 83981.98 |
| 2013 | 12.67 | 0.97 | 0.27 | 5.75 | 2.12 | 4.14 | 256947.79 | 19698.57 | 1.81 | 5639 | 116777.76 | 42991.40 | 83981.98 |
| 2016 | 13.28 | 0.95 | 0.27 | 6.41 | 2.12 | 4.14 | 269221.32 | 19269.16 | 1.81 | 5495.91 | 129971.21 | 42991.40 | 83981.98 |
| 2021 | 13.31 | 0.97 | 0.28 | 6.43 | 2.12 | 4.14 | 270104.22 | 19715.12 | 1.81 | 5649.27 | 130254.80 | 42991.40 | 83981.98 |
Comment
Methodology


