[KM13] Emissions of ammonia from agriculture 
[KM13] Emissions of ammonia from agriculture

Key message

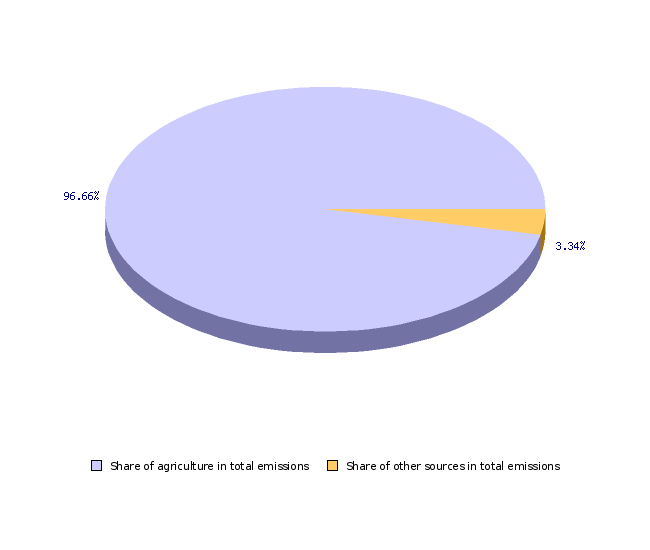
In 2009, agriculture contributed 96.7 % of total ammonia emissions. Between 1990 and 2010, ammonia emissions in Slovenia have reduced by 16.1 %. In last few years, ammonia emissions in Slovenia are about 15 % below the margin determined by the adopted international commitments (20,000 t annually).
Charts
Figure KM13-1: Share of agriculture in the total emissions of ammonia in Slovenia in 2009
Sources:
Agricultural Institute of Slovenia, 2011; Environmental Agency of the Republic of Slovenia, 2011.
| 2009 | ||
|---|---|---|
| Agriculture | t/year | 17091.9 |
| Other sources | t/year | 590.9 |
| Total | t/year | 17682.9 |
| Share of agriculture in total emissions | % | 96.7 |
| Share of other sources in total emissions | % | 3.3 |
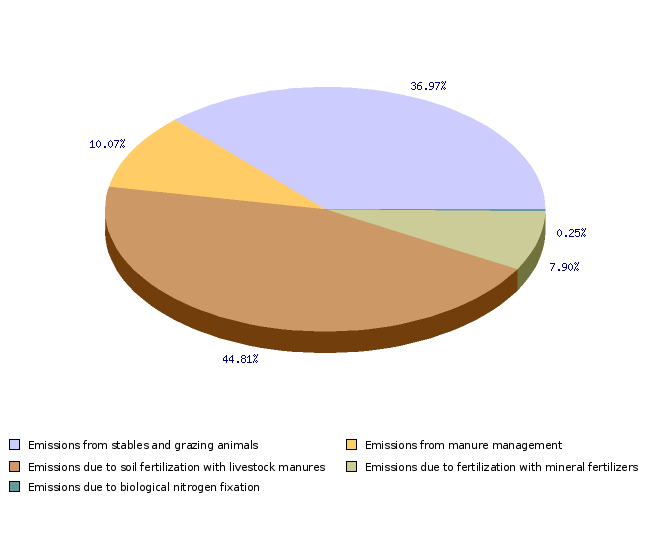
Figure KM13-2: Types of ammonia emissions in the Slovenian agriculture in 2010
Sources:
Agricultural Institute of Slovenia, 2011.
| 2010 | ||
|---|---|---|
| Emissions from stables and grazing animals | % | 37 |
| Emissions from manure management | % | 10.1 |
| Emissions due to soil fertilization with livestock manures | % | 44.8 |
| Emissions due to fertilization with mineral fertilizers | % | 7.9 |
| Emissions due to biological nitrogen fixation | % | 0.2 |
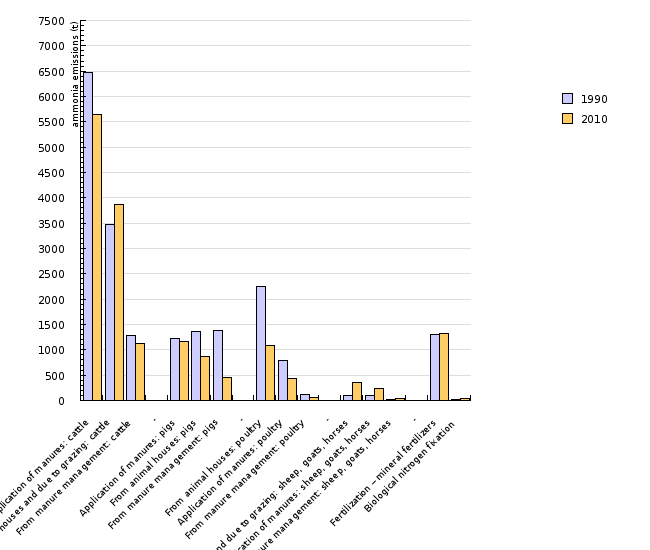
Figure KM13-3: Reduction of ammonia emissions by sources
Sources:
Agricultural Institute of Slovenia, 2009.
| Application of manures: cattle | From animal houses and due to grazing: cattle | From manure management: cattle | - | Application of manures: pigs | From animal houses: pigs | From manure management: pigs | - | From animal houses: poultry | Application of manures: poultry | ||
|---|---|---|---|---|---|---|---|---|---|---|---|
| 1990 | t | 6473.8 | 3467.8 | 1287.8 | 1214.8 | 1361.1 | 1388.9 | 2247.3 | 797.3 | ||
| 2010 | t | 5649.3 | 3868.2 | 1115.2 | 1161 | 861.2 | 461.8 | 1083.2 | 431.4 | ||
| Changes in year ammonia emissions | Index (1990=100) | 87.3 | 111.5 | 86.6 | 95.6 | 63.3 | 33.3 | 48.2 | 54.1 | ||
| Share in total emissons 2010 | % | 33.9 | 23.2 | 6.7 | 7 | 5.2 | 2.8 | 6.5 | 2.6 | ||
| From manure management: poultry | - | From animal houses and due to grazing: sheep, goats, horses | Application of manures: sheep, goats, horses | From manure management: sheep, goats, horses | - | Fertilization – mineral fertilizers | Biological nitrogen fixation | ||||
| 1990 | t | 121.1 | 89.1 | 90 | 20.3 | 1303.1 | 16 | ||||
| 2010 | t | 63.9 | 353.1 | 232.1 | 38.4 | 1318.3 | 41.5 | ||||
| Changes in year ammonia emissions | Index (1990=100) | 52.8 | 396.5 | 257.8 | 189.4 | 101.2 | 259.1 | ||||
| Share in total emissons 2010 | % | 0.4 | 2.1 | 1.4 | 0.2 | 7.9 | 0.2 |
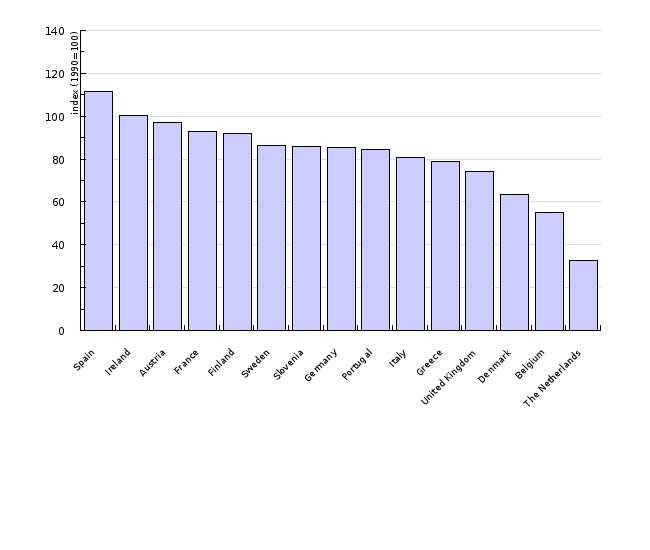
Figure KM13-4: Reduction of annual ammonia emissions in Slovenia and in some EU-15 countries in the period 1990-2009
Sources:
Agricultural Institute of Slovenia, 2011; European Environment Agency, 2011.
| Spain | Ireland | Austria | France | Finland | Sweden | Slovenia | Germany | Portugal | Italy | ||
|---|---|---|---|---|---|---|---|---|---|---|---|
| Annual ammonia emisssions | Index (1990=100) | 111.5 | 100.3 | 97.2 | 92.8 | 92 | 86.1 | 86 | 85.2 | 84.3 | 80.8 |
| Ammonia emissions - 1990 | t | 298.6 | 105.5 | 60.8 | 772.1 | 35.7 | 49 | 19.9 | 668.1 | 51.2 | 457.5 |
| Ammonia emissions - 2009 | t | 333.1 | 105.8 | 59.1 | 716.2 | 32.9 | 42.2 | 17.1 | 569.3 | 43.1 | 369.6 |
| Greece | United Kingdom | Denmark | Belgium | The Netherlands | |||||||
| Annual ammonia emisssions | Index (1990=100) | 79 | 74.4 | 63.7 | 55.1 | 32.6 | |||||
| Ammonia emissions - 1990 | t | 75.9 | 343.2 | 116 | 112.7 | 334.7 | |||||
| Ammonia emissions - 2009 | t | 60 | 255.4 | 73.8 | 62.1 | 109.2 |
Goals
- reduction of emissions NH3 to the target value of 20 thousand tonnes.


