[KM13] Ammonia Emissions in Agriculture

Key message

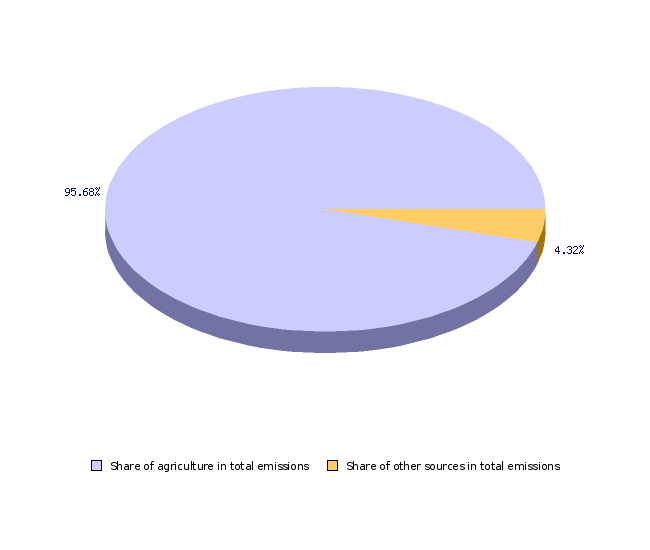
In 2007, agriculture contributed 95.7 % of total ammonia emissions. Between 1990 and 2007, ammonia emissions in Slovenia have reduced by 10.8 %. In last few years, ammonia emissions in Slovenia are just below the margin determined by the adopted international commitments (20,000 t annually).
Definition
The indicator shows ammonia emissions in agriculture. Main sources of emissions are displayed and changes between the years 1990 and 2007 in total and by individual sources.
Charts
Agricultural Institute of Slovenia, 2009; Environmental Agency of the Republic of Slovenia, 2009.
| 2007 | ||
|---|---|---|
| Agriculture | t/year | 17707 |
| Other sources | t/year | 799 |
| Total | t/year | 18506 |
| Share of agriculture in total emissions | % | 95.7 |
| Share of other sources in total emissions | % | 4.3 |
Agricultural Institute of Slovenia, 2009.
| 2007 | ||
|---|---|---|
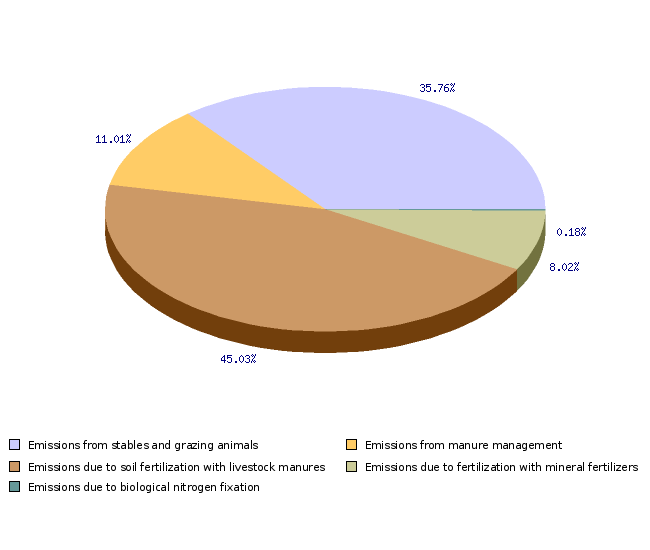
| Emissions from stables and grazing animals | % | 35.8 |
| Emissions from manure management | % | 11 |
| Emissions due to soil fertilization with livestock manures | % | 45 |
| Emissions due to fertilization with mineral fertilizers | % | 8 |
| Emissions due to biological nitrogen fixation | % | 0.2 |
Agricultural Institute of Slovenia, 2009.
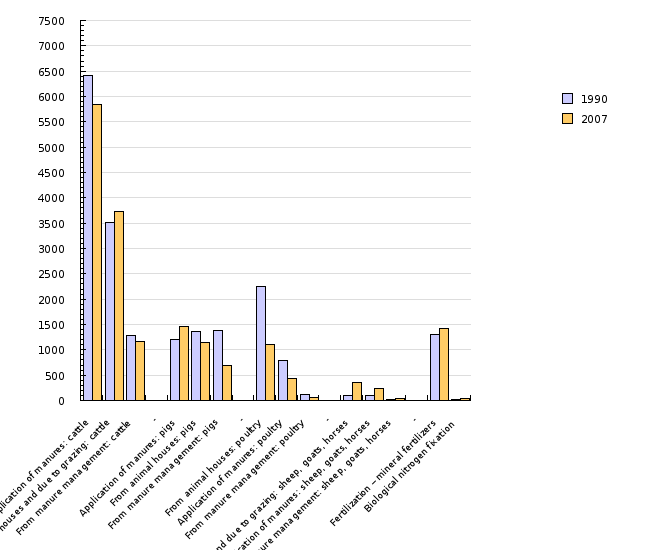
| Application of manures: cattle | From animal houses and due to grazing: cattle | From manure management: cattle | - | Application of manures: pigs | From animal houses: pigs | From manure management: pigs | - | From animal houses: poultry | Application of manures: poultry | ||
|---|---|---|---|---|---|---|---|---|---|---|---|
| 1990 | t | 6423 | 3514 | 1277 | 1213 | 1361 | 1389 | 2247 | 797 | ||
| 2007 | t | 5844 | 3724 | 1157 | 1465 | 1143 | 695 | 1113 | 433 | ||
| Changes in year ammonia emissions | Index (1990=100) | 91 | 106 | 91 | 121 | 84 | 50 | 50 | 54 | ||
| Share in total emissons 2006 | % | 33 | 21 | 6.5 | 8.3 | 6.5 | 3.9 | 6.3 | 2.4 | ||
| From manure management: poultry | - | From animal houses and due to grazing: sheep, goats, horses | Application of manures: sheep, goats, horses | From manure management: sheep, goats, horses | - | Fertilization – mineral fertilizers | Biological nitrogen fixation | ||||
| 1990 | t | 121 | 89 | 90 | 20 | 1303 | 16 | ||||
| 2007 | t | 59 | 352 | 231 | 38 | 1420 | 32 | ||||
| Changes in year ammonia emissions | Index (1990=100) | 49 | 396 | 257 | 190 | 109 | 200 | ||||
| Share in total emissons 2006 | % | 0.3 | 2 | 1.3 | 0.2 | 8 | 0.2 |
Agricultural Institute of Slovenia, 2009; European Environment Agency, 2009.
| Spain | Ireland | Austria | France | Sweden | Slovenia | Portugal | Germany | Italy | United Kingdom | ||
|---|---|---|---|---|---|---|---|---|---|---|---|
| Annual ammonia emisssions | Index (1990=100) | 122 | 94 | 93 | 93 | 91 | 89 | 87 | 87 | 86 | 78 |
| Ammonia emissions - 1990 | t | 322.6 | 100.6 | 66.1 | 772.1 | 49 | 19.9 | 52.7 | 685.5 | 457.5 | 340.2 |
| Ammonia emissions - 2007 | t | 394.7 | 94.8 | 61.7 | 714.6 | 44.3 | 17.7 | 46.1 | 595.8 | 395.5 | 264.3 |
| Finland | Denmark | Belgium | the Netherlands | ||||||||
| Annual ammonia emisssions | Index (1990=100) | 76 | 56 | 54 | 51 | ||||||
| Ammonia emissions - 1990 | t | 41.1 | 115.8 | 119.1 | 238.3 | ||||||
| Ammonia emissions - 2007 | t | 31.3 | 64.4 | 64.3 | 122 |
Goals
- reduction of emissions NH3 to the target value of 20 thousand tonnes.
Comment
Ammonia causes quite some harm to the health of the people, environment and the agriculture. In the form of salt it is transferred to large distances – tiny dust particles are shaped which cause lung diseases. It also contributes to acid rain and to soil acidification. In the form of ammonia, nitrogen is being deposited into natural ecosystems modifying them. Ammonia in high concentrations directly harms the health and the well-being of people and domestic animals and is directly poisonous for plants. And finally, by ammonia release into the atmosphere we are losing nitrogen as a precious plant nutrient.
Agriculture accounts for the largest ammonia emissions. The majority of ammonia is released upon manuring with livestock manure, and through emissions from animal houses, pastures, during the storage of livestock manure, and upon fertilising with mineral fertilisers. Large emissions from fertilisation result also from the fact that we have practically no machines for band spreading or injection of slurry into the soil. Emissions from fertilising with these machines are much lower than from the generally practised broadcast spreading of slurry. Taking into account emissions from fertilising with livestock manure, among the agricultural branches the most ammonia release come from cattle farming (60.5%) and pig production (18.7%).
Annual discharges of ammonia in agriculture between 1990 and 2007 decreased from 19,861 to 17,707 tonnes, or 10.8%. The reduction is comparable to the EU-15 countries. In cattle farming as the most important single source, emissions from stables and pastures have slightly increased, while emissions during the storage of manure and manuring have reduced. The decrease is attributed to a substantial reduction in cattle population, while the slight increase in emissions from housing are due to an increased proportion of loose housing, where emissions are higher than in traditional tied systems with a separate collection of farmyard manure and urine. The fact that reduced emissions did not completely match the herd reduction, is also due to the increased intensity of farming. Intensive breeding is characterised by extensive release of nitrogen, which also increases the release of ammonia. In absolute terms, reduced emissions are primarily due to more than halved flock of poultry in the studied period. A large relative increase of emissions from horses and small ruminants is irrelevant in absolute terms, because despite the increase, these emissions account for only 3.5% of all emissions in agriculture.
The reduction of ammonia emissions also results from some regulations aimed at protecting waters, in particular Decree on the limit input concentration values of dangerous substances and fertilisers in soil, determining the maximum allowed load of agricultural land with livestock. Reduced emissions result also from agri-environmental measures applied within the Rural Development Programme. Beneficiaries of payments under agri-environmental measures must comply with more stringent criteria as regards the burden of agricultural land with livestock than those prescribed by the legislation.
Methodology
Data for Slovenia:
Objectives summarized by:the Protocol to Abate Acidification, Eutrophication and Ground-Level Ozone (Göteborg Protocol to the Convention on Long-Range Transboundary Air Pollution, signed in December 1999, ratified in April 2004) and the Directive on national emission ceilings for certain atmospheric pollutants (2001/81/EC) - NEC Directive or the Decree on national emission ceilings for atmospheric pollutants (OG RS, No 24/05, 92/07)
Source database or source: National emission records: Records on ammonia emissions for the purpose of reporting to the LRTAP Convention (Long-range Transboundary Air Pollution Convention) are held by the Environmental Agency of the Republic of Slovenia, while the authority responsible for preparing operational programmes of reducing emissions of pollutants under the NEC directive is the Agricultural Institute of Slovenia. Records for reporting to the LRTAP Convention are elaborated with a rough method, while the preparation of operational programmes is done with a more detailed method. This data sheet presents (as regards agriculture) data from the database of the Agricultural Institute of Slovenia, and for other sources it provides data from the database of the Environmental Agency of the Republic of Slovenia.
Data administrator: Agricultural Institute of Slovenia, contact person: Jože Verbič; Environmental Agency of the Republic of Slovenia, contact person: Bojan Rode
Data acquisition date for this indicator: 15 November 2009
Methodology and frequency of data collection for the indicator: Data on ammonia emissions are prepared once a year: at the Environmental Agency before elaborating the report to the Long-range Transboundary Air Pollution Convention; and at the Agricultural Institute of Slovenia upon compiling data on the releases of greenhouse gases. Since the emissions in agriculture can only be assessed after publishing data on the number of animals, the consumption of mineral fertilizers, and the physical volume of agricultural production and breeding (RS Statistical Office), data are available for more than a year ago (for example, in early 2008 for the year 2006).
Data processing methodology: The ammonia emissions in agriculture presented in this fact sheet are calculated on the basis of EMEP/CORINAIR (2002) methodology taking into account the specificities of the Slovenian agriculture. The basis of assessment are data on the extent of the animal husbandry, fertilisers consumption, and cultivation of legumes (SORS). In determining the emission factors, a number of expert assessments are taken into account concerning the feeding, animal housing systems, methods of collecting and storing manure, and the practice of fertilising with livestock manure. For assessing nitrogen release in milking cows, the intensity of farming is also taken into account (dairy milk yield). The method is comparable with the methods applied in most European countries.
Information concerning data quality:
- Indicator advantages and disadvantages: Based on two different methods of assessing ammonia emissions (the rough and the detailed one), different documents provide data which slightly differ from each other. The weakest link in evaluating ammonia emissions is the lack of reliable quantitative data on the types of farming.
- Relevance, accuracy, robustness, uncertainty: Information is relevant, as they involve all the major sources of emissions. The method is robust, and the results quickly respond to changes in the scope and types of agricultural production and animal husbandry. Uncertainty is relatively small.
Reliability of the indicator (archival data): Data are reliable.
Uncertainty of the indicator (scenarios/projections): Projections are elaborated for 2015 and 2020. Uncertainty for projections is rather high.
- Overall assessment (1 = no major comments, 3 = data to be considered with reservation):
Relevance: 1
Accuracy: 1
Completeness over time: 1
Completeness over space: 1
Data for other countries:
Source database or source: The European Topic Centre on Air and Climate Change (Database version 1.1, 14 Jul 2009), national submissions to LRTAP Convention
Data administrator: European Environmental Agency, The air pollutant emissions data viewer (LRTAP Convention)
Data acquisition date for this indicator: 15 November 2009
Methodology and frequency of data collection for the indicator: Data are collected annually from national reports to the Long-range Transboundary Air Pollution Convention. There is no formal control over the provision of data quality in the EU records. The quality of data is mostly ensured by verifications of reports by individual countries performed by the EEA and the ETC/ACC (European Environmental Agency and the European Topic Centre on Air and Climate Change).
Data processing methodology: the recommended methodology for assessing ammonia emissions in the EU is EMEP/CORINAIR.
Information concerning data quality:
- Advantages and disadvantages of the indicator: the advantage of the indicator is that it relies on official reports of EU Member States, that the general method of assessment is determined, and that the principal sources of emissions to be considered in making records are also determined. The disadvantage of the indicator is that the EU Member States do not dispose of their own measured emission coefficients.
- Relevance, accuracy, robustness, uncertainty: Data are relevant, since the principal sources of emissions in agriculture are identified and taken into account.
Reliability of the indicator (archival data): Based on data from the national reports on ammonia emissions, it is not possible to present a general estimate on indicator reliability.
Uncertainty of the indicator (scenarios/projections): projections until 2020 have been elaborated; uncertainty of projections is high.
- Overall assessment (1 = no major comments, 3 = data to be considered with reservation):
Relevance: 1
Accuracy: 1
Completeness over time: 1
Completeness over space: 2
Other sources and literature:
- European Environmental Agency, 2009. Air pollutant emissions data viewer (LRTAP Convention), resumed 15.11.2009
-Act ratifying the Protocol to Abate Acidification, Eutrophication and Ground-level Ozone to the 1979 Geneva Convention on Long-range Transboundary Air Pollution (mpzze - OG RS No 32/04)
-Directive 2001/81/EC of the European Parliament and Council of 23 October 2001 on National Emission Ceilings for certain pollutants (Official Journal of the European Communities, L300/22)
-Decree on national emission ceilings for atmospheric pollutants (OG RS, No 24/05, 92/07)


