[EN09] Emissions of air pollutants from energy sources

Key message

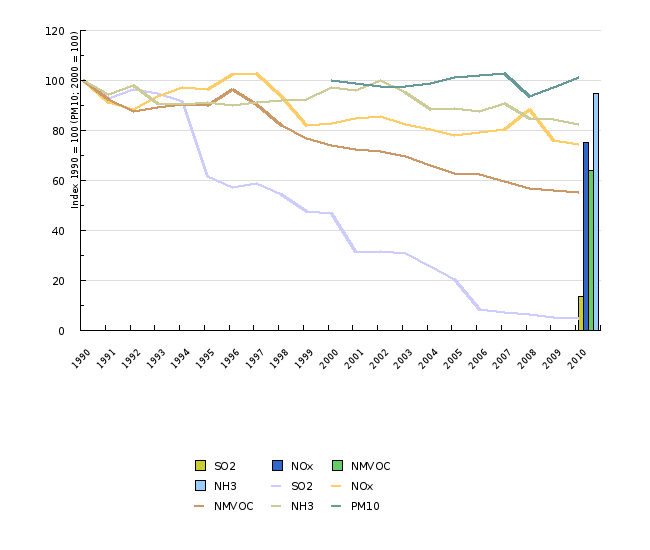
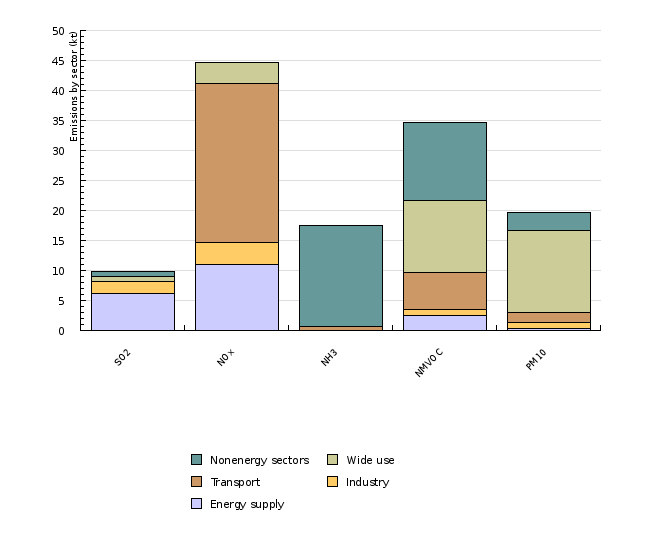
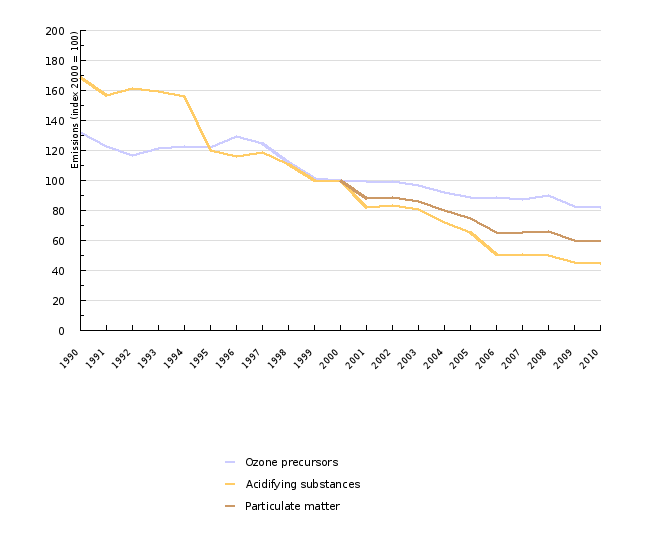
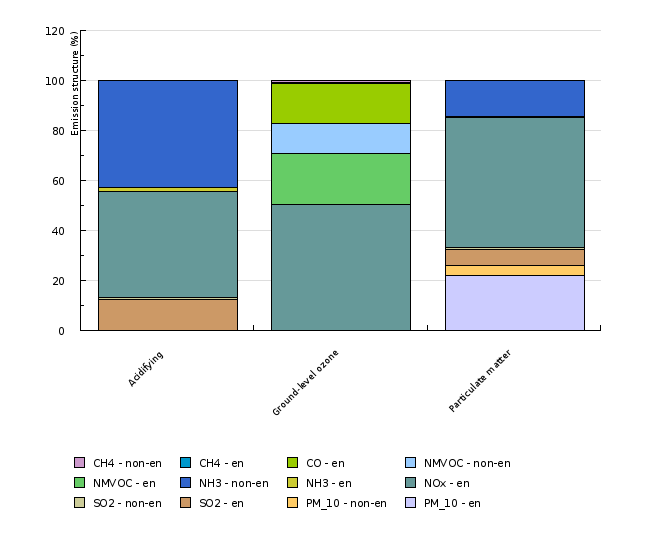
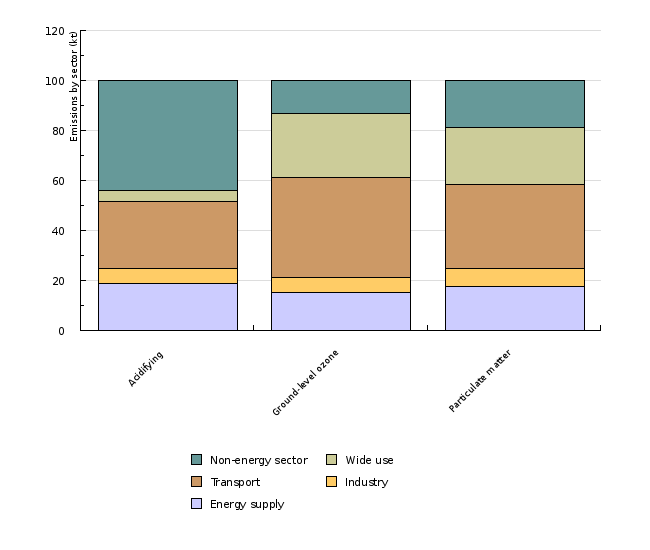
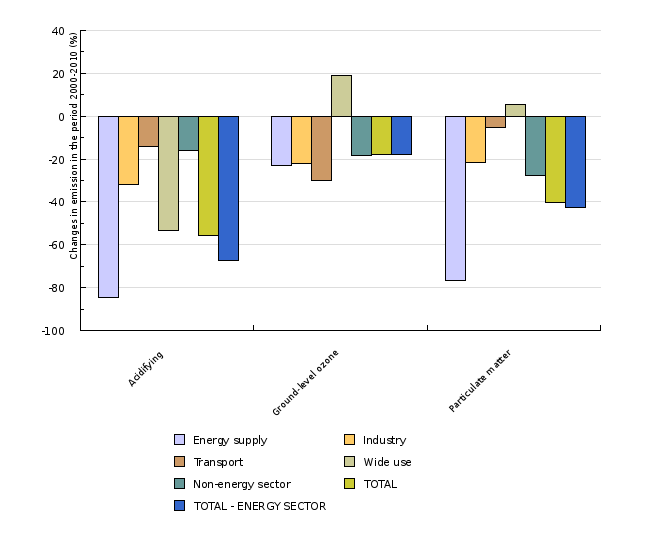
In 2010 emissions of NOx dropped below target values while SO2, NMVOC and NH3 emissions remained below 2010 target values. Greatest reductions have been achieved in emissions of SO22 followed by NMVOC and the smallest reductions have been achieved in emissions of NOx and NH3. Emissions of PM10 have slightly increased. This caused a reduction in the emission of acidifying substances, ozone precursors and particulate matter. NOx is the only substance that is present in all three groups with a substantial share. The largest source of NOx emissions is transport followed by electricity and heat production.
Definition
This indicator shows past energy-related emissions of individual substances and total emissions of ozone precursors, acidifying substances and particulate matter.
Ozone precursors are substances that contribute to the formation of ground-level ozone. Ozone precursors are nitrogen oxides (NOx), carbon monoxide (CO), methane (CH4) and non-methane volatile organic compounds (NMVOC). Tropospheric or ground-level ozone has adverse effects on both human health and the ecosystem. High concentrations of ground-level ozone have been shown to adversely affect the human respiratory system, especially the lungs, while in the environment, high concentrations of ozone decrease yields, cause leaf damage and decrease disease resistance. Ozone is also capable of causing damage to plastics and rubbers.
Acidifying substances are sulphur dioxide (SO2), nitrogen oxides (NOx) and ammonia (NH3). Acidification causes substantial damage to the ecosystem, buildings and materials (corrosion). NOx and NH3 lead to eutrophication (excess nitrogen in soil and water).
Particulate matter emissions are classified into primary PM10 (particulate matter with a diameter of 10 μm or less, emitted directly into the atmosphere), and secondary PM10 or PM10 precursors (the fraction of NOx, SO2 and NH3 emissions which, as a result of photo-chemical reactions in the atmosphere, transform into particulate matter with a diameter of 10 μm or less). The inhalation of such particles may increase the frequency and severity of a number of respiratory problems, which may increase the risk of premature death. The smaller particles, which can go deeper into the lungs, are especially dangerous.
Charts
Slovenian Environment Agency, 2012.
| 1990 | 1991 | 1992 | 1993 | 1994 | 1995 | 1996 | 1997 | 1998 | 1999 | ||
|---|---|---|---|---|---|---|---|---|---|---|---|
| SO2 | index (1990 = 100) | 100 | 92.889 | 96.532 | 94.97 | 91.739 | 61.468 | 57.203 | 58.995 | 54.478 | 47.528 |
| NOx | index (1990 = 100) | 100 | 91.243 | 88.501 | 93.681 | 97.106 | 96.328 | 102.244 | 102.881 | 93.598 | 82.071 |
| NMVOC | index (1990 = 100) | 100 | 92.304 | 87.79 | 89.333 | 90.317 | 89.976 | 96.331 | 90.326 | 81.915 | 76.728 |
| NH3 | index (1990 = 100) | 100 | 94.542 | 98.097 | 90.78 | 90.514 | 91.14 | 89.98 | 91.351 | 91.87 | 92.277 |
| PM10 | index (2000 = 100) | ||||||||||
| SO2 | index (1990 = 100) | ||||||||||
| NOx | index (1990 = 100) | ||||||||||
| NMVOC | index (1990 = 100) | ||||||||||
| NH3 | index (1990 = 100) | ||||||||||
| 2000 | 2001 | 2002 | 2003 | 2004 | 2005 | 2006 | 2007 | 2008 | 2009 | ||
| SO2 | index (1990 = 100) | 46.619 | 31.716 | 31.789 | 30.979 | 25.613 | 20.471 | 8.267 | 7.343 | 6.43 | 5.259 |
| NOx | index (1990 = 100) | 82.982 | 84.652 | 85.581 | 82.557 | 80.452 | 77.82 | 79.27 | 80.438 | 88.52 | 75.988 |
| NMVOC | index (1990 = 100) | 74.071 | 72.434 | 71.566 | 69.442 | 66.179 | 62.813 | 62.567 | 59.74 | 56.876 | 55.823 |
| NH3 | index (1990 = 100) | 97.252 | 96.172 | 100.126 | 95.158 | 88.346 | 88.635 | 87.769 | 90.771 | 84.908 | 84.496 |
| PM10 | index (2000 = 100) | 100 | 98.966 | 97.73 | 97.623 | 98.811 | 101.334 | 102.154 | 102.66 | 93.527 | 97.055 |
| SO2 | index (1990 = 100) | ||||||||||
| NOx | index (1990 = 100) | ||||||||||
| NMVOC | index (1990 = 100) | ||||||||||
| NH3 | index (1990 = 100) | ||||||||||
| 2010 | |||||||||||
| SO2 | index (1990 = 100) | 4.931 | |||||||||
| NOx | index (1990 = 100) | 74.575 | |||||||||
| NMVOC | index (1990 = 100) | 55.284 | |||||||||
| NH3 | index (1990 = 100) | 82.59 | |||||||||
| PM10 | index (2000 = 100) | 101.172 | |||||||||
| SO2 | index (1990 = 100) | 13.586 | |||||||||
| NOx | index (1990 = 100) | 75.037 | |||||||||
| NMVOC | index (1990 = 100) | 63.933 | |||||||||
| NH3 | index (1990 = 100) | 94.832 |
Slovenian Environment Agency, 2012.
| SO2 | NOx | NH3 | NMVOC | PM10 | ||
|---|---|---|---|---|---|---|
| Energy supply | kt | 6.17 | 11 | 0 | 2.56 | 0.36 |
| Industry | kt | 1.97 | 3.74 | 0 | 0.93 | 0.91 |
| Transport | kt | 0.06 | 26.48 | 0.59 | 6.2 | 1.8 |
| Wide use | kt | 0.87 | 3.49 | 0 | 11.94 | 13.67 |
| Nonenergy sectors | kt | 0.73 | 0.01 | 16.83 | 12.95 | 2.95 |
| TOTAL | kt | 9.8 | 44.72 | 17.42 | 34.59 | 19.69 |
Slovenian Environment Agency, 2012; Jožef Stefan Institute, 2012.
| 1990 | 1991 | 1992 | 1993 | 1994 | 1995 | 1996 | 1997 | 1998 | 1999 | ||
|---|---|---|---|---|---|---|---|---|---|---|---|
| Ozone precursors | Index (2000 = 100) | 132 | 122.5 | 116.4 | 121.1 | 122.9 | 122.2 | 129.5 | 124.6 | 112.2 | 101.2 |
| Acidifying substances | Index (2000 = 100) | 168.9 | 156.9 | 161.4 | 159.1 | 156 | 119.7 | 115.8 | 118.4 | 110.8 | 99.7 |
| Particulate matter | Index (2000 = 100) | ||||||||||
| Ozone precursors | [kt] | 174.2 | 161.7 | 153.6 | 159.9 | 162.2 | 161.3 | 171 | 164.5 | 148.1 | 133.5 |
| Acidifying substances | [kt] | 8.8 | 8.1 | 8.4 | 8.2 | 8.1 | 6.2 | 6 | 6.1 | 5.7 | 5.2 |
| Particulate matter | [kt] | ||||||||||
| 2000 | 2001 | 2002 | 2003 | 2004 | 2005 | 2006 | 2007 | 2008 | 2009 | ||
| Ozone precursors | Index (2000 = 100) | 100 | 99.7 | 99.3 | 96.3 | 92.3 | 88.8 | 88.8 | 87.5 | 90.3 | 82.5 |
| Acidifying substances | Index (2000 = 100) | 100 | 82.3 | 83.6 | 80.7 | 72.1 | 65.3 | 50.8 | 50.8 | 50.3 | 45.6 |
| Particulate matter | Index (2000 = 100) | 100 | 87.8 | 88.5 | 86 | 80 | 74.9 | 65.2 | 65.3 | 65.9 | 60.2 |
| Ozone precursors | [kt] | 132 | 131.5 | 131 | 127.2 | 121.8 | 117.2 | 117.2 | 115.6 | 119.2 | 108.9 |
| Acidifying substances | [kt] | 5.2 | 4.3 | 4.3 | 4.2 | 3.7 | 3.4 | 2.6 | 2.6 | 2.6 | 2.4 |
| Particulate matter | [kt] | 126.4 | 110.9 | 111.8 | 108.7 | 101.1 | 94.7 | 82.4 | 82.6 | 83.3 | 76 |
| 2010 | |||||||||||
| Ozone precursors | Index (2000 = 100) | 81.9 | |||||||||
| Acidifying substances | Index (2000 = 100) | 44.4 | |||||||||
| Particulate matter | Index (2000 = 100) | 59.7 | |||||||||
| Ozone precursors | [kt] | 108.1 | |||||||||
| Acidifying substances | [kt] | 2.3 | |||||||||
| Particulate matter | [kt] | 75.5 |
Slovenian Environment Agency, 2012; Jožef Stefan Institute, 2012.
| Acidifying | Ground-level ozone | Particulate matter | ||
|---|---|---|---|---|
| PM_10 - en | kt | 0 | 0 | 16.73 |
| PM_10 - non-en | kt | 0 | 0 | 2.95 |
| SO2 - en | kt | 0.28 | 0 | 4.9 |
| SO2 - non-en | kt | 0.02 | 0 | 0.39 |
| NOx - en | kt | 0.97 | 54.54 | 39.34 |
| NH3 - en | kt | 0.03 | 0 | 0.37 |
| NH3 - non-en | kt | 0.99 | 0 | 10.77 |
| NMVOC - en | kt | 0 | 21.64 | 0 |
| NMVOC - non-en | kt | 0 | 12.95 | 0 |
| CO - en | kt | 0 | 17.31 | 0 |
| CH4 - en | kt | 0 | 0.28 | 0 |
| CH4 - non-en | kt | 0 | 1.08 | 0 |
| TOTAL | kt | 2.3 | 107.8 | 75.47 |
| PM_10 - en | % | 22.17 | ||
| PM_10 - non-en | % | 3.91 | ||
| SO2 - en | % | 12.31 | 6.49 | |
| SO2 - non-en | % | 0.99 | 0.52 | |
| NOx - en | % | 42.21 | 50.6 | 52.13 |
| NH3 - en | % | 1.5 | 0.5 | |
| NH3 - non-en | % | 43 | 14.27 | |
| NMVOC - en | % | 20.07 | ||
| NMVOC - non-en | % | 12.01 | ||
| CO - en | % | 16.06 | ||
| CH4 - en | % | 0.26 | ||
| CH4 - non-en | % | 1 | ||
| TOTAL | % |
Slovenian Environment Agency, 2012; Jožef Stefan Institute, 2012.
| Acidifying | Ground-level ozone | Particulate matter | ||
|---|---|---|---|---|
| Energy supply | kt | 0.43 | 16.42 | 13.37 |
| Industry | kt | 0.14 | 6.42 | 5.27 |
| Transport | kt | 0.61 | 43.24 | 25.51 |
| Wide use | kt | 0.1 | 27.69 | 17.21 |
| Non-energy sector | kt | 1.01 | 14.36 | 14.13 |
| TOTAL | kt | 2.3 | 108.13 | 75.48 |
| TOTAL - ENERGY SECTOR | kt | 1.29 | 93.77 | 61.35 |
| Energy supply | % | 18.75 | 15.19 | 17.71 |
| Industry | % | 6.21 | 5.94 | 6.98 |
| Transport | % | 26.57 | 39.99 | 33.79 |
| Wide use | % | 4.47 | 25.61 | 22.8 |
| Non-energy sector | % | 44 | 13.28 | 18.72 |
| TOTAL | % | 100 | 100 | 100 |
| TOTAL - ENERGY SECTOR | % | 56 | 86.72 | 81.28 |
Slovenian Environment Agency, 2012; Jožef Stefan Institute, 2012.
| Acidifying | Ground-level ozone | Particulate matter | ||
|---|---|---|---|---|
| Energy supply | % | -84.8 | -22.9 | -76.5 |
| Industry | % | -31.7 | -22 | -21.4 |
| Transport | % | -13.9 | -29.8 | -5.1 |
| Wide use | % | -53.4 | 19.1 | 5.6 |
| Non-energy sector | % | -16.1 | -18.4 | -27.7 |
| TOTAL | % | -55.6 | -18.1 | -40.3 |
| TOTAL - ENERGY SECTOR | % | -67.6 | -18 | -42.6 |
| Energy supply | kt | 2.8 | 21.3 | 57 |
| Industry | kt | 0.2 | 8.2 | 6.7 |
| Transport | kt | 0.7 | 61.6 | 26.9 |
| Wide use | kt | 0.2 | 23.2 | 16.3 |
| Non-energy sector | kt | 1.2 | 17.6 | 19.5 |
| TOTAL | kt | 5.2 | 132 | 126.4 |
| TOTAL - ENERGY SECTOR | kt | 4 | 114.4 | 106.9 |
| Energy supply | kt | 0.4 | 16.4 | 13.4 |
| Industry | kt | 0.1 | 6.4 | 5.3 |
| Transport | kt | 0.6 | 43.2 | 25.5 |
| Wide use | kt | 0.1 | 27.7 | 17.2 |
| Non-energy sector | kt | 1 | 14.4 | 14.1 |
| TOTAL | kt | 2.3 | 108.1 | 75.5 |
| TOTAL - ENERGY SECTOR | kt | 1.3 | 93.8 | 61.3 |
Goals
A reduction in emissions of air pollutants:
- reduction of SO2 emissions to target values of 27 thousand tonnes,
- reduction of NOx emissions to target values of 45 thousand tonnes,
- reduction of NMVOC emissions to target values of 40 thousand tonnes,
- reduction of NH3 emissions to target values of 20 thousand tonnes,
- reduction of CH4 emissions within the framework of an 8 percent reduction in greenhouse gas emissions in the 2008-2012 period or within the framework of a 20 % or 30 % reduction of greenhouse gas emissions by 2020 from the base year.
There is no quantified objective for CO and PM10 emissions.
Until 2020 Slovenia is obliged to further reduce emissions of SO2 for 63 %, NH3 for 1 %, NOx for 39 %, NMVOC for 23 % and PM2.5 25 %. A revision of Directive 2001/81/EC on National Emission Ceilings for Certain Atmospheric Pollutants is being prepared. The amended Directive will set additional targets for SO2, NOx, NMVOC, NH3 and PM2.5 emissions for the year 2020.
Methodology
Data for Slovenia
Objectives summarised by: Resolucija o Nacionalnem programu varstva okolja 2005-2012 (Resolution on the National Environmental Action Plan 2005-2012, Official Gazette of the Republic of Slovenia, No. 2/06), the proposal of the climate and energy package, Protocol to the 1979 Convention on long-range transboundary air pollution to abate acidification, eutrophication and ground-level ozone and Directive 2001/81/EC of 23 October 2001 on national emission ceilings for certain atmospheric pollutants (the NEC directive).
Source database or source: Official data on emissions of air pollutants were used as sent to the United Nations and as located in the Central Data Repository (CDR) under Slovenia/United Nations/UNECE – CLRTAP air emission inventories/, and GHG emissions as sent to UNFCCC and as located in the Central Data Repository (CDR) under Slovenia/United Nations/UNFCCC – UN Framework Convention on Climate Change data/.
Upon preparing new records, data for previous years are often corrected.
Data administrator: The Environmental Agency of the Republic of Slovenia, the Environment Office, Air Quality Sector, contact person: Bojan Rode, Tajda Mekinda-Majaron.
Data acquisition date for the indicator:
Methodology and frequency of data collection for the indicator: Data are prepared on an annual basis and on the basis of data on activities (the use of fuels, number of animals, quantity of waste, industrial manufacturing, etc.), calorific value of fuels and emission factors. For air pollutants, the recommended methodology has been prepared by the UNECE/EMEP task force on emissions inventories and projections and for GHG emissions by the Intergovernmental Panel on Climate Change (IPCC).
Energy-related emissions or emissions from energy sources (CRF 1, NRF 1) include emissions arising from fuel combustion activities (CRF 1.A, NFR 1.A) that are further divided into emissions from energy and heat production – transformations (CRF 1.A.1, NFR 1.A.1), emissions from manufacturing industries and construction (CRF 1.A.2, NFR 1.A.2), transport emissions (CRF 1.A.3, NFR 1.A.3) and emissions from other sectors (CRF 1.A.4, NFR 1.A.4) that include emissions from households, the services sector and fuel combustion in agriculture and forestry. In addition to emissions arising from fuel combustion activities, energy-related emissions also include fugitive emissions from fuels (CRF 1.B, NFR 1.B) that are further classified into fugitive emissions from solid fuels (CRF 1.B.1, NFR 1.B.1) and fugitive emissions from oil and natural gas (CRF 1.B.2., NFR 1.B.2) that originate in the production of fuels (coal mines) or the transmission and distribution of oil and natural gas. Transmissions or the production of electricity and heat in the text includes emissions from energy industries and fugitive emissions.
Non-energy related GHG emissions include emissions from industry (CRF 2, NFR 2) (i.e. processes in manufacturing industries and construction without fossil fuel combustion including the production and consumption of fluorinated gases), agriculture (CRF 4, NFR 4) (i.e. domestic livestock (manure management and enteric fermentation) and emissions from the use of fertilisers), emissions from waste (CRF 6, NFR 6) (i.e. emissions from landfill sites and incineration plants and waste water treatment) and emissions from the use of solvents and other products (CRF 3, NFR 3).
Indicator EN09 – Emissions of Air Pollutants was introduced in 2009 and originates in the combination of three related indicators: EN02 – Energy-Related Emissions of Ozone Precursors, EN03 – Energy-Related Emissions of Acidifying Substances and EN04 – Energy-Related Particulate Matter Emissions.
Data processing methodology: Total emissions have been calculated as a weighted sum of individual emissions. We used the same weights as used by the European Environment Agency in its calculations. Ground-level ozone weights were calculated on the basis of the potential of each of the air pollutants to contribute to ozone formation in the troposphere (TOFP – Tropospheric Ozone Forming Potential).
Total emissions of ozone precursors have been calculated as a weighted sum of individual emissions (NOx, NMVOC, CO, CH4). The TOFP factors used are as follows: NOx – 1.22; NMVOC – 1.0; CO – 0.11; CH4 – 0.014. Results are expressed in NMVOC equivalents (ktonnes) (NMVOC eq.). Total emissions of acidifying substances are calculated using weighting factors that are calculated on the basis of acid equivalents (SO2, NOx, NH3). The weighting factors used are as follows: SO2 – 2/64 acid eq/g; NOx – 1/46 acid eq/g; NH3 – 1/17 acid eq/g. Results are expressed in kt equivalents of acidifying substances. The indicator for particulate matter emissions shows past emissions of particulate matter separately for primary and secondary particulate matter (SO2, NOx, NH3, PM10) (a weighted sum of individual emissions). The factors used in the estimation of emissions are based on assumptions about the deposition and reactions of the precursor pollutants – aerosol formation factors - and are as follows: SO2 – 0.54; NOx – 0.88; NH3 – 0.64; PM10 – 1.00. Results are expressed in PM10 equivalents (kt).
Average annual rate of growth is calculated as: [(last year / base year)(1 / number of years) –1] x 100.
Annual growth is occasionally shown in percentage points. A percentage point is a unit used in comparing different percentages. In percentage points, we are dealing with an absolute comparison calculated using the following formula: (nthis year)–(nlast year)=16 % – 15 % = 1 pp (e.g. if there was a 15 % growth last year and a 16 % growth this year, then this year growth is 1 percentage point higher). The difference in growth can also be expressed by relative comparison using the following formula: [(nthis year / nlast year) * 100] – 100 = [(16 % / 15 %) * 100] – 100 = 6.7 %. In this case, growth is expressed as a percentage.
Information concerning data quality:
- Advantages and disadvantages of the indicator: Officially reported data that are calculated using internationally confirmed methods have been used to calculate the indicator. Data on PM10 emissions have a higher uncertainty level than data on the emissions of other substances.
- Relevance, accuracy, robustness, uncertainty:
Reliability of the indicator (archival data): Data reliability for greenhouse gas emissions (CH4) was estimated for 1986, 2002 and 2003. For absolute data it stands at 16 %, 13.1 % and 12 % and for trends for 2002 and 2003 at 4 % and 3 % respectively. The reliability of emission factors and activity data is estimated on the basis of an expert assessment. It is possible for data reliability for emissions of air pollutants to differ for individual substances. SO2 emissions records have the highest reliability, as they relate directly to the fuel’s sulphur content and, with flue gas treatment, also the efficiency of desulphurisation units. Data on NOx emissions are much less reliable, as there are several emission origins. Emissions depend on the amount of nitrogen in the fuel, the ratio between oxygen and fuel and the combustion temperature, which is specific for each boiler making emission factors differ from one boiler to another. The reliability of data for NH3 emissions is high, as values were almost identical upon using two different methodologies.
Uncertainty of the indicator (scenarios/projections): scenarios and projections are not available.
- Overall assessment (1 = no major comments, 3 = data to be considered with reservation):
Relevance: 1
Accuracy: 2
Completeness over time: 2
Completeness over space: 1
Other sources and literature:
- EEA, 2008. EN05 Energy-Related Emissions of Ozone Precursors.
- EEA, 2008. EN06 Energy-Related Emissions Of Acidifying Substances.
- EEA, 2008. EN07 Energy-Related Particulate Matter Emissions.
- MOP, 2007. Operativni program doseganja nacionalnih zgornjih mej emisij onesnaževal zunanjega zraka /Revizija operativnega programa doseganja nacionalnih zgornjih mej emisij onesnaževal zunanjega zraka iz leta 2005/ (Operational Programme for Complying with National Emission Ceilings for Atmospheric Pollutants /Revision of Operational Programme for Complying with National Emission Ceilings for Atmospheric Pollutants from 2005/).


