[EN12] Electricity Consumption
[EN12] Electricity Consumption

Definition
Charts
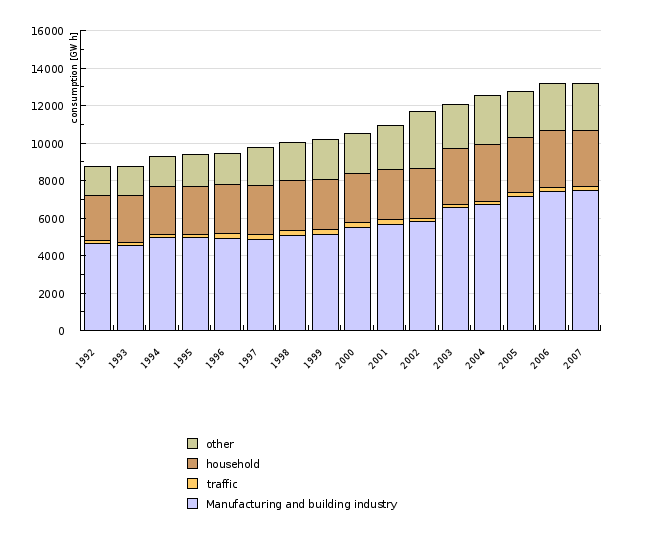
Figure EN12-1: Missing title
Sources:
Statistical Office of the Republic of Slovenia, 2008; Statistical Office of the European Communities, 2008.
| 1992 | 1993 | 1994 | 1995 | 1996 | 1997 | 1998 | 1999 | 2000 | 2001 | ||
|---|---|---|---|---|---|---|---|---|---|---|---|
| Manufacturing and building industry | GWh | 4660 | 4553 | 4956 | 4943 | 4921 | 4853 | 5055 | 5099 | 5490 | 5648 |
| traffic | GWh | 147 | 146 | 147 | 170 | 258 | 264 | 268 | 271 | 265 | 256 |
| household | GWh | 2404 | 2490 | 2585 | 2553 | 2594 | 2637 | 2658 | 2692 | 2601 | 2675 |
| other | GWh | 1516 | 1561 | 1597 | 1718 | 1641 | 2028 | 2059 | 2151 | 2166 | 2348 |
| TOTAL | GWh | 8727 | 8750 | 9285 | 9384 | 9414 | 9782 | 10040 | 10213 | 10522 | 10927 |
| 2002 | 2003 | 2004 | 2005 | 2006 | 2007 | ||||||
| Manufacturing and building industry | GWh | 5790 | 6543 | 6710 | 7172 | 7440 | 7468 | ||||
| traffic | GWh | 172 | 179 | 189 | 197 | 198 | 195 | ||||
| household | GWh | 2704 | 3008 | 3012 | 2951 | 3055 | 3021 | ||||
| other | GWh | 3023 | 2335 | 2637 | 2423 | 2472 | 2512 | ||||
| TOTAL | GWh | 11689 | 12065 | 12548 | 12743 | 13165 | 13196 |
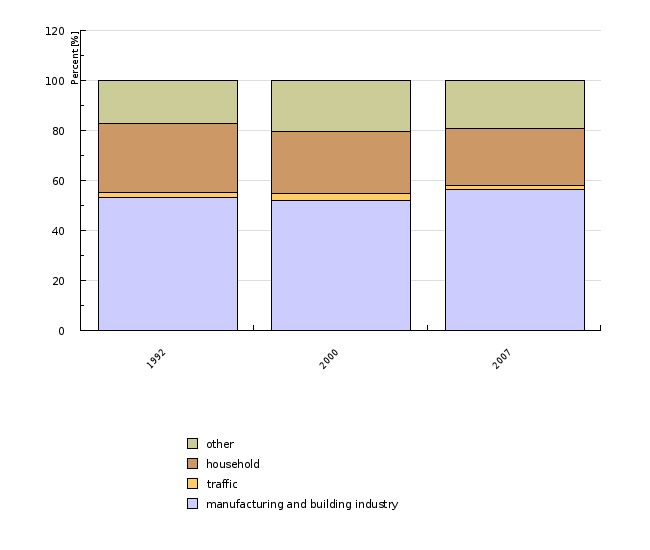
Figure EN12-2: Missing title
Sources:
Statistical Office of the Republic of Slovenia, 2008; Statistical Office of the European Communities, 2008.
| 1992 | 2000 | 2007 | ||
|---|---|---|---|---|
| manufacturing and building industry | GWh | 4660 | 5490 | 7468 |
| traffic | GWh | 147 | 265 | 195 |
| household | GWh | 2404 | 2601 | 3021 |
| other | GWh | 1516 | 2166 | 2512 |
| manufacturing and building industry | % | 53.4 | 52.2 | 56.6 |
| traffic | % | 1.7 | 2.5 | 1.5 |
| household | % | 27.5 | 24.7 | 22.9 |
| other | % | 17.4 | 20.6 | 19 |
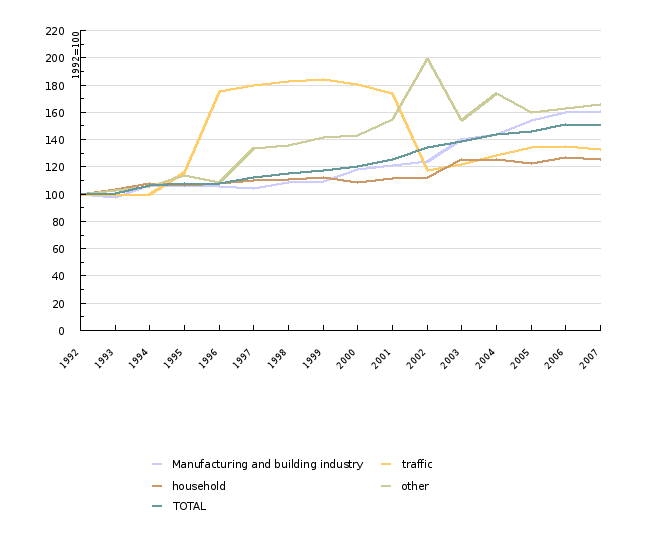
Figure EN12-3: Missing title
Sources:
Statistical Office of the Republic of Slovenia, 2008; Statistical Office of the European Communities, 2008.
| 1992 | 1993 | 1994 | 1995 | 1996 | 1997 | 1998 | 1999 | 2000 | 2001 | ||
|---|---|---|---|---|---|---|---|---|---|---|---|
| Manufacturing and building industry | GWh | 100 | 97.7 | 106.4 | 106.1 | 105.6 | 104.1 | 108.5 | 109.4 | 117.8 | 121.2 |
| traffic | GWh | 100 | 99.3 | 100 | 115.6 | 175.5 | 179.6 | 182.3 | 184.4 | 180.3 | 174.1 |
| household | GWh | 100 | 103.6 | 107.5 | 106.2 | 107.9 | 109.7 | 110.6 | 112 | 108.2 | 111.3 |
| other | GWh | 100 | 103 | 105.3 | 113.3 | 108.2 | 133.8 | 135.8 | 141.9 | 142.9 | 154.9 |
| TOTAL | GWh | 100 | 100.3 | 106.4 | 107.5 | 107.9 | 112.1 | 115 | 117 | 120.6 | 125.2 |
| 2002 | 2003 | 2004 | 2005 | 2006 | 2007 | ||||||
| Manufacturing and building industry | GWh | 124.2 | 140.4 | 144 | 153.9 | 159.7 | 160.3 | ||||
| traffic | GWh | 117 | 121.8 | 128.6 | 134 | 134.7 | 132.7 | ||||
| household | GWh | 112.5 | 125.1 | 125.3 | 122.8 | 127.1 | 125.7 | ||||
| other | GWh | 199.4 | 154 | 173.9 | 159.8 | 163.1 | 165.7 | ||||
| TOTAL | GWh | 133.9 | 138.2 | 143.8 | 146 | 150.9 | 151.2 |
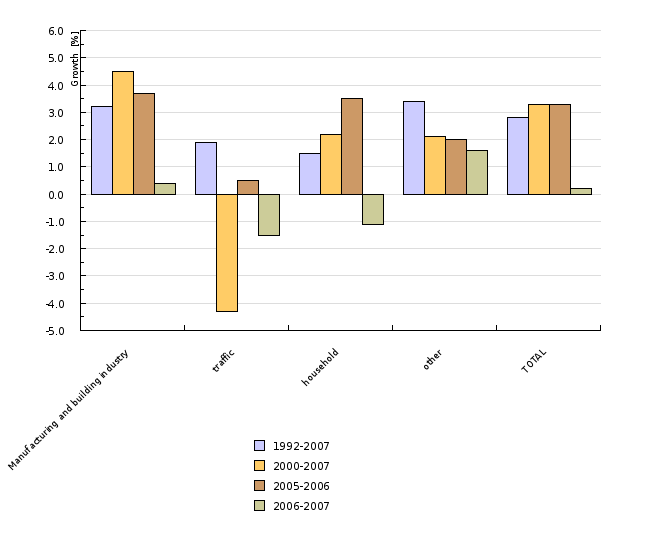
Figure EN12-4: Missing title
Sources:
Statistical Office of the Republic of Slovenia, 2008; Statistical Office of the European Communities, 2008.
| Manufacturing and building industry | traffic | household | other | TOTAL | ||
|---|---|---|---|---|---|---|
| 1992-2007 | % | 3.2 | 1.9 | 1.5 | 3.4 | 2.8 |
| 2000-2007 | % | 4.5 | -4.3 | 2.2 | 2.1 | 3.3 |
| 2005-2006 | % | 3.7 | 0.5 | 3.5 | 2 | 3.3 |
| 2006-2007 | % | 0.4 | -1.5 | -1.1 | 1.6 | 0.2 |
Figure EN12-5: Missing title
Sources:
Statistical Office of the Republic of Slovenia, 2008; Statistical Office of the European Communities, 2008.
| Sweden | United Kingdom | Denmark | Poland | Belgium | Slovakia | The Netherlands | Germany | Bolgaria | France | ||
|---|---|---|---|---|---|---|---|---|---|---|---|
| 2000-2006 | % | 0.3 | 0.7 | 0.8 | 1 | 1.1 | 1.2 | 1.3 | 1.5 | 1.8 | 1.9 |
| 2005-2006 | % | -1.2 | -0.6 | 1.8 | 4.2 | 3 | 3.2 | 1.4 | 2 | 4.6 | 1 |
| EU-15 | EU-25 | EU-27 | Hungary | Austria | EU-10 | Italy | Luxembourg | Finland | Czech Republik | ||
| 2000-2006 | % | 1.9 | 1.9 | 1.9 | 2 | 2 | 2 | 2.1 | 2.2 | 2.2 | 2.4 |
| 2005-2006 | % | 1.8 | 1.9 | 2 | 2.8 | 3 | 3.9 | 2.6 | 6 | 6 | 3.1 |
| Malta | Romania | Greece | Portugal | Slovenia | Ireland | Estonia | Spain | Lithuania | Latvia | ||
| 2000-2006 | % | 2.8 | 3.2 | 3.3 | 3.7 | 3.8 | 4.1 | 4.5 | 4.8 | 5.3 | 5.4 |
| 2005-2006 | % | 7.7 | 5.4 | 3.2 | 3.1 | 3.3 | 6.3 | 7.5 | 3.2 | 5.9 | 7 |
| Cyprus | |||||||||||
| 2000-2006 | % | 5.7 | |||||||||
| 2005-2006 | % | 5.3 |
Figure EN12-6: Missing title
Sources:
Statistical Office of the European Communities, 2008.
| Romania | Lithuania | Latvia | Poland | Hungary | EU-10 | Bolgaria | Slovakia | Portugal | Malta | ||
|---|---|---|---|---|---|---|---|---|---|---|---|
| consumption | MWh/per capita | 1.9 | 2.5 | 2.7 | 2.7 | 3.3 | 3.3 | 3.5 | 4.4 | 4.5 | 4.6 |
| Greece | Estonia | Italy | Cyprus | Czech Republic | EU-27 | United Kingdom | Spain | EU-25 | Ireland | ||
| consumption | MWh/per capita | 4.7 | 4.8 | 5.2 | 5.4 | 5.6 | 5.6 | 5.7 | 5.7 | 5.8 | 6.1 |
| Denmark | EU-15 | Germany | The Netherlands | Slovenia | France | Austria | Belgium | Luxembourg | Sweden | ||
| consumption | MWh/per capita | 6.3 | 6.3 | 6.4 | 6.5 | 6.6 | 6.8 | 7 | 7.8 | 13.8 | 14.4 |
| Finland | |||||||||||
| consumption | MWh/per capita | 16.3 |


