[NB07] Compensation for damage caused by protected animal species

Key message

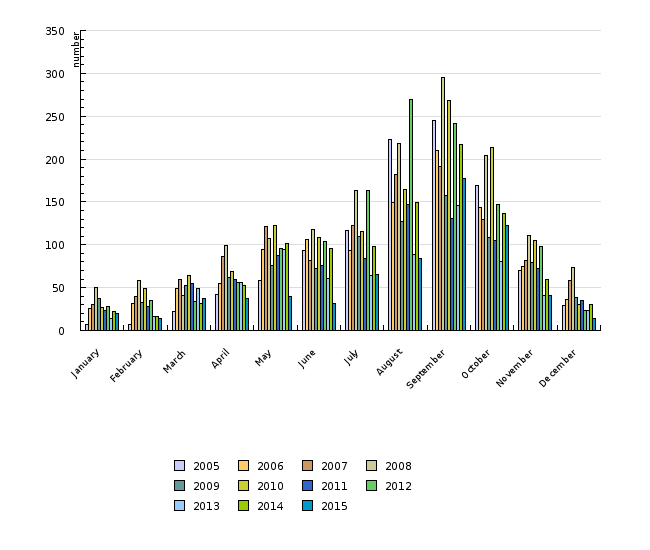
In 2015, 754 loss events were considered. For 657 loss events, compensation in the amount of €300,194.74 was fully or partially granted. Compensation may be claimed for damage caused by 20 protected animal species. The most common perpetrators of harm are large carnivores. Damage is often caused to sheep and goats and most incidents happen in the period from July to October.
Definition
This indicator shows the damage incurred in a given time period, and the number of loss events for which compensation for damage from the national budget of the Republic of Slovenia was approved. Compensation is granted where animals of an endangered species cause damage to private property.
The success rate is measured by a decrease in the number of loss events, as defined in the Resolution on the National Programme of Environmental Protection 2005–2012 (Official Gazette of the Republic of Slovenia, No. 2/06).
Charts
Analiza odškodninskih zahtevkov za škodo, ki so jo povzročile živali zavarovanih prostoživečih živalskih vrst, Slovenian environment agency, 2016; ODSEV, Slovenian environment agency, 2016
ODSEV, Slovenian Environment Agency, 2016.
| January | February | March | April | May | June | July | August | September | October | ||
|---|---|---|---|---|---|---|---|---|---|---|---|
| 2005 | number | 7 | 7 | 22 | 42 | 58 | 93 | 117 | 223 | 245 | 169 |
| 2006 | number | 26 | 31 | 49 | 55 | 94 | 106 | 93 | 149 | 210 | 144 |
| 2007 | number | 30 | 40 | 59 | 86 | 121 | 82 | 123 | 182 | 191 | 130 |
| 2008 | number | 50 | 58 | 41 | 99 | 107 | 118 | 163 | 218 | 295 | 204 |
| 2009 | number | 37 | 33 | 52 | 62 | 76 | 72 | 110 | 127 | 158 | 109 |
| 2010 | number | 27 | 49 | 64 | 69 | 122 | 108 | 115 | 165 | 268 | 214 |
| 2011 | number | 23 | 28 | 55 | 59 | 88 | 76 | 84 | 147 | 131 | 105 |
| 2012 | number | 28 | 35 | 34 | 56 | 96 | 104 | 163 | 269 | 242 | 147 |
| 2013 | number | 14 | 16 | 49 | 56 | 94 | 61 | 64 | 89 | 146 | 80 |
| 2014 | number | 22 | 16 | 31 | 52 | 101 | 96 | 98 | 149 | 217 | 137 |
| 2015 | number | 20 | 14 | 37 | 37 | 40 | 31 | 65 | 84 | 177 | 122 |
| November | December | ||||||||||
| 2005 | number | 70 | 29 | ||||||||
| 2006 | number | 75 | 36 | ||||||||
| 2007 | number | 82 | 58 | ||||||||
| 2008 | number | 111 | 73 | ||||||||
| 2009 | number | 79 | 38 | ||||||||
| 2010 | number | 105 | 30 | ||||||||
| 2011 | number | 72 | 35 | ||||||||
| 2012 | number | 98 | 23 | ||||||||
| 2013 | number | 41 | 23 | ||||||||
| 2014 | number | 60 | 30 | ||||||||
| 2015 | number | 41 | 14 |
ODSEV, Slovenian Environemnt Agency, 2016.
| 2005 | 2006 | 2007 | 2008 | 2009 | 2010 | 2011 | 2012 | 2013 | 2014 | ||
|---|---|---|---|---|---|---|---|---|---|---|---|
| brown bear | number | 817 | 589 | 294 | 578 | 353 | 568 | 293 | 592 | 364 | 519 |
| wolf | number | 61 | 165 | 354 | 397 | 410 | 535 | 434 | 347 | 149 | 205 |
| lynx | number | 28 | 16 | 7 | 17 | 16 | 7 | 7 | 2 | 0 | 0 |
| ferret | number | 28 | 23 | 17 | 38 | 44 | 41 | 24 | 51 | 42 | 55 |
| raven | number | 102 | 185 | 282 | 361 | 32 | 27 | 30 | 33 | 22 | 40 |
| other | number | 25 | 19 | 144 | 58 | 42 | 60 | 69 | 119 | 82 | 114 |
| total | number | 1061 | 997 | 1098 | 1449 | 897 | 1238 | 857 | 1144 | 659 | 933 |
| 2015 | |||||||||||
| brown bear | number | 339 | |||||||||
| wolf | number | 102 | |||||||||
| lynx | number | 1 | |||||||||
| ferret | number | 38 | |||||||||
| raven | number | 40 | |||||||||
| other | number | 108 | |||||||||
| total | number | 628 |
ODSEV, Slovenian environment agency, 2016
| 2005 | 2006 | 2007 | 2008 | 2009 | 2010 | 2011 | 2012 | 2013 | 2014 | ||
|---|---|---|---|---|---|---|---|---|---|---|---|
| brown bear | EUR | 194865.6 | 145159.8 | 81866.4 | 170678.5 | 154314.3 | 252496.7 | 113703.1 | 232339.1 | 145066 | 192206.1 |
| wolf | EUR | 30050.3 | 87841.6 | 203336 | 280580.2 | 271870.3 | 333485.4 | 251486.7 | 191879.8 | 89246.2 | 139494 |
| lynx | EUR | 6501.3 | 3280.8 | 1161.5 | 3712.2 | 3856.3 | 1263.8 | 975 | 150 | 0 | 0 |
| ferret | EUR | 4268 | 5031 | 4750 | 14680.6 | 20888.5 | 9956.1 | 3254.8 | 6047.3 | 4388.5 | 4768.5 |
| raven | EUR | 15075.3 | 39380.8 | 52639.9 | 67172.2 | 13745.7 | 12377.6 | 36156.7 | 9393 | 13229.8 | 24107.3 |
| other | EUR | 9313.6 | 8099.8 | 11732.7 | 42918.5 | 15501.9 | 29063.5 | 37499.4 | 130512.3 | 59401.6 | 90115.1 |
| total | EUR | 260074 | 288793.8 | 355486.4 | 580076.9 | 480177 | 638642.9 | 443075.8 | 570321.5 | 311332.2 | 450690.9 |
| brown bear | % | 74.9 | 50.3 | 23 | 29.4 | 32.1 | 39.5 | 25.7 | 40.7 | 46.6 | 42.6 |
| wolf | % | 11.6 | 30.4 | 57.2 | 48.4 | 56.6 | 52.2 | 56.8 | 33.6 | 28.7 | 31 |
| lynx | % | 2.5 | 1.1 | 0.3 | 0.6 | 0.8 | 0.2 | 0.2 | 0 | 0 | 0 |
| ferret | % | 1.6 | 1.7 | 1.3 | 2.5 | 4.4 | 1.6 | 0.7 | 1.1 | 1.4 | 1.1 |
| raven | % | 5.8 | 13.6 | 14.8 | 11.6 | 2.9 | 1.9 | 8.2 | 1.6 | 4.2 | 5.3 |
| other | % | 3.6 | 2.8 | 3.3 | 7.4 | 3.2 | 4.6 | 8.5 | 22.9 | 19.1 | 20 |
| 2015 | |||||||||||
| brown bear | EUR | 143321.2 | |||||||||
| wolf | EUR | 80014.3 | |||||||||
| lynx | EUR | 168.8 | |||||||||
| ferret | EUR | 4729.1 | |||||||||
| raven | EUR | 8059 | |||||||||
| other | EUR | 53277.5 | |||||||||
| total | EUR | 289569.8 | |||||||||
| brown bear | % | 49.5 | |||||||||
| wolf | % | 27.6 | |||||||||
| lynx | % | 0.1 | |||||||||
| ferret | % | 1.6 | |||||||||
| raven | % | 2.8 | |||||||||
| other | % | 18.4 |
ODSEV, Slovenian Environemnt Agency, 2016.
| goats and sheep | fruit cultivation | forage production (bales) | agriculture | poultry | beekeeping | other | ||
|---|---|---|---|---|---|---|---|---|
| 2005 | number of incidents | 353 | 139 | 120 | 225 | 32 | 79 | 113 |
| 2006 | number of incidents | 526 | 138 | 86 | 76 | 25 | 73 | 73 |
| 2007 | number of incidents | 726 | 67 | 59 | 34 | 25 | 13 | 174 |
| 2008 | number of incidents | 824 | 165 | 106 | 162 | 55 | 48 | 201 |
| 2009 | number of incidents | 517 | 100 | 81 | 70 | 50 | 16 | 111 |
| 2010 | number of incidents | 708 | 171 | 97 | 92 | 49 | 46 | 125 |
| 2011 | number of incidents | 558 | 67 | 61 | 26 | 38 | 20 | 110 |
| 2012 | number of incidents | 556 | 139 | 89 | 48 | 73 | 70 | 221 |
| 2013 | number of incidents | 286 | 67 | 43 | 19 | 52 | 61 | 165 |
| 2014 | number of incidents | 328 | 119 | 69 | 53 | 78 | 68 | 326 |
| 2015 | number of incidents | 201 | 85 | 72 | 32 | 51 | 51 | 176 |
ODSEV, Slovenian Environemnt Agency, 2016.
| 2005 | 2006 | 2007 | 2008 | 2009 | 2010 | 2011 | 2012 | 2013 | 2014 | ||
|---|---|---|---|---|---|---|---|---|---|---|---|
| goats and sheep | EUR | 104732.7 | 171839.9 | 279044.3 | 347837.6 | 331633.3 | 454851.2 | 296576.2 | 291436.8 | 135365.6 | 158094 |
| fruit cultivation | EUR | 18804.4 | 20813.5 | 13260.4 | 46712.5 | 25718.2 | 38309.1 | 19053.1 | 29892.6 | 17459.4 | 22901.6 |
| forage production (bales) | EUR | 20277.8 | 17298.9 | 9491.4 | 18263.5 | 15277.5 | 15868.1 | 20448 | 14412.8 | 6695 | 11676.9 |
| agriculture | EUR | 27698.6 | 10736.2 | 5099.3 | 20647.3 | 15264.7 | 20670.2 | 13740.1 | 55990.2 | 4089.1 | 7764.4 |
| poultry | EUR | 4297.4 | 5121.3 | 5221.9 | 15017.6 | 20997 | 10988.9 | 4815.4 | 9538.4 | 4372 | 6468.4 |
| beekeeping | EUR | 43352.8 | 34406.7 | 7908 | 32411.2 | 11396.9 | 37461 | 11186.8 | 38016.6 | 35723.4 | 62095.7 |
| other | EUR | 40910.2 | 28577.8 | 35461.2 | 98852.2 | 59889 | 60494.9 | 77256 | 131034.1 | 107627.7 | 181689.6 |
| total | EUR | 260074 | 288794.3 | 355486.4 | 579741.9 | 480177 | 638642.9 | 443075.6 | 570321.5 | 311332.3 | 450690.7 |
| goats and sheep | % (EUR) | 40.3 | 59.5 | 78.5 | 60 | 69.1 | 71.2 | 66.9 | 51.1 | 43.5 | 35.1 |
| fruit cultivation | % (EUR) | 7.2 | 7.2 | 3.7 | 8 | 5.4 | 6 | 4.3 | 5.2 | 5.6 | 5.1 |
| forage production (bales) | % (EUR) | 7.8 | 6 | 2.7 | 3.1 | 3.2 | 2.5 | 4.6 | 2.5 | 2.2 | 2.6 |
| agriculture | % (EUR) | 10.7 | 3.7 | 1.4 | 3.6 | 3.2 | 3.2 | 3.1 | 9.8 | 1.3 | 1.7 |
| poultry | % (EUR) | 1.7 | 1.8 | 1.5 | 2.6 | 4.4 | 1.7 | 1.1 | 1.7 | 1.4 | 1.4 |
| beekeeping | % (EUR) | 16.7 | 11.9 | 2.2 | 5.6 | 2.4 | 5.9 | 2.5 | 6.7 | 11.5 | 13.8 |
| other | % (EUR) | 15.7 | 9.9 | 10 | 17 | 12.5 | 9.5 | 17.4 | 23 | 34.6 | 40.3 |
| 2015 | |||||||||||
| goats and sheep | EUR | 99548.4 | |||||||||
| fruit cultivation | EUR | 16722.5 | |||||||||
| forage production (bales) | EUR | 16502.2 | |||||||||
| agriculture | EUR | 4419.2 | |||||||||
| poultry | EUR | 5614 | |||||||||
| beekeeping | EUR | 40247.9 | |||||||||
| other | EUR | 106515.7 | |||||||||
| total | EUR | 289569.8 | |||||||||
| goats and sheep | % (EUR) | 34.4 | |||||||||
| fruit cultivation | % (EUR) | 5.8 | |||||||||
| forage production (bales) | % (EUR) | 5.7 | |||||||||
| agriculture | % (EUR) | 1.5 | |||||||||
| poultry | % (EUR) | 1.9 | |||||||||
| beekeeping | % (EUR) | 13.9 | |||||||||
| other | % (EUR) | 36.8 |
Goals
· Further development of the system for damage prevention and timely payment of compensation for damage caused by animals of a protected species;
· Elaboration of measures for protection of property and prevention of further damage.
Comment
The state is responsible for property damage caused by protected animal species. The Nature Conservation Act lays down conditions under which property owners are eligible to receive compensation for property damage caused by animals of a protected species. Owners must act with due care and attention and take appropriate early preventive measures.
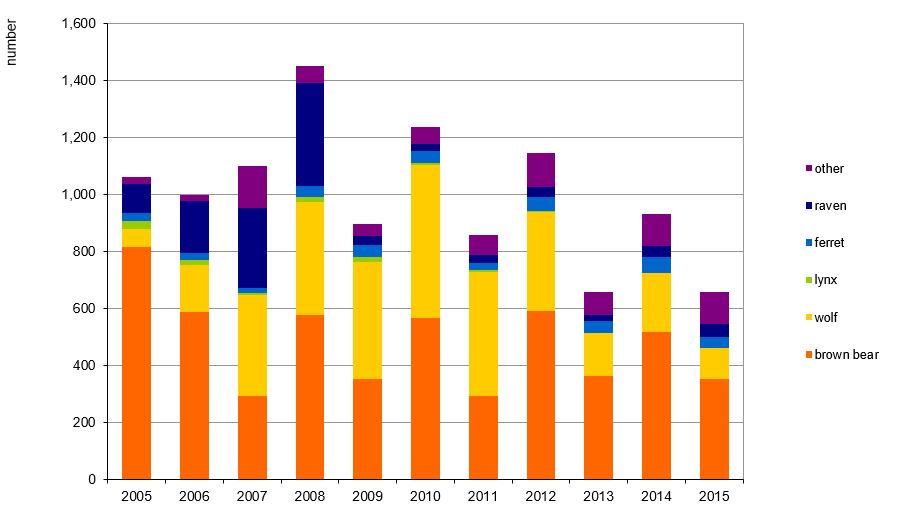
In the 2005–2007 period, the number of damage events remained more or less stable, while in 2008, it increased by more than 30%. In 2009, the number dropped by nearly 40%, followed by an equal increase in 2010 and a significant drop in 2011, comparable to that from 2009. In 2012, the number of damage events increased again (by more than 40%) and, in 2013 it dropped to its lowest level in the 9-year period. In 2014, animals of a protected species were responsible for almost 40% more damage events than in 2013. In 2015, the number of damage events decreased again, below the 2013 level. In the 2005–2008 period, the approved amount of funds for damage compensation increased by more than 100%. In 2009, the amount decreased to levels before 2005, while in 2010, it reached a record level, exceeding the 2005 amount by 150%. In 2011, the approved amount of compensation payments decreased again to a similar level as in 2009, while in 2012 it rose again by almost 30%. In 2013, the amount dropped by 45% compared to the preceding year and in 2014, it rose to EUR 450,690 of approved funds for damage compensation, followed by an almost 36% drop in 2015. Damage caused by animals of a protected species was reported by property owners primarily between July and October. Rejected compensation claims in cases where the cause of damage was identified as within reasonable doubt are taken into account as well. Compensation claims are rejected in cases in which the statutory conditions are not fulfilled (e.g. inadequate protection of property).
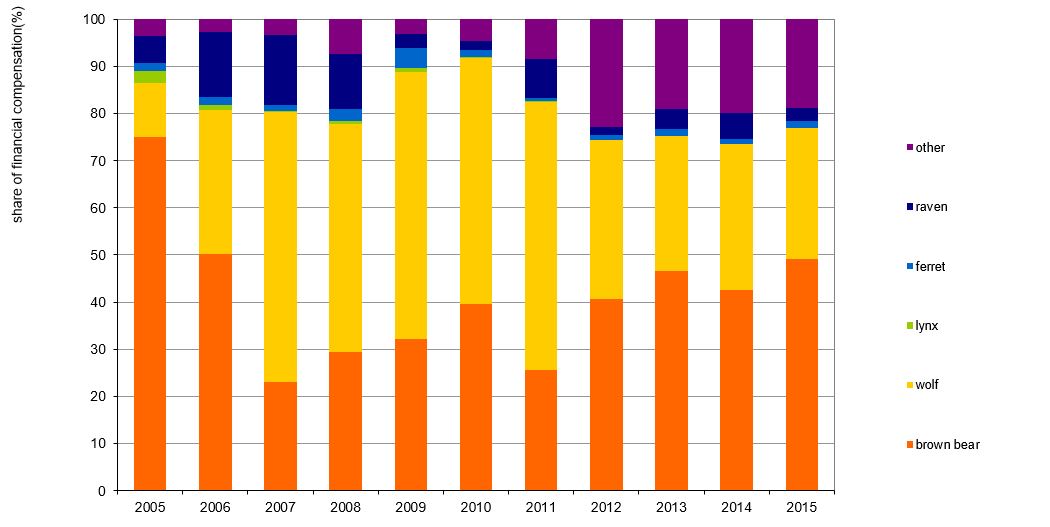
On average, large carnivores (brown bear, lynx, wolves) caused damage in 78% of all cases for which compensation payment was approved. The percentage ranges between 60% in 2007 and 90% in 2010. In the 2005–2015 period, brown bear caused damage in 27–77% of all damage events, the 11-year average being 49%. In the 2005–2014 period, wolves caused damage in 6–51 damage events, with an 11-year average of 28%.
75 to 92% of all funds earmarked for compensation of damage were paid to cover losses caused by large carnivores.
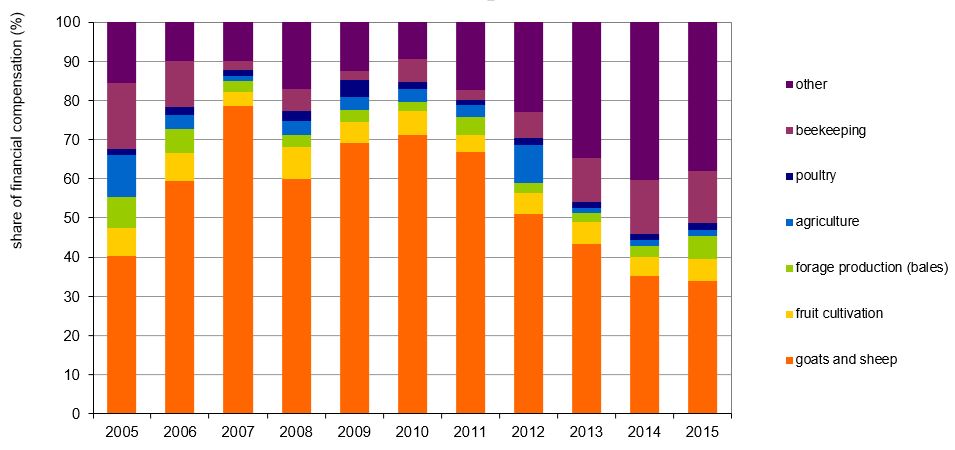
Between 34 and 78% of funds were spent for compensating damage caused to sheep and goats. In the period 2005–2012, the amount of funds for compensating damage in the area of beekeeping was reduced from 17 to 7%. In 2013, an increase to 11% was recorded, while in 2014 and 2015 compensation to beekeepers increased to 14%. The share of funds spent for compensating damage to fruit trees fluctuates between 5 and 8%, with the exception of 2007 when it amounted to 3.7% and 2011, when it was 4.3%.


