[ZR05] Air pollution with sulphur dioxide

Definition
The main sources of sulphur dioxide (SO2) emissions are large thermal power plants and heat production plants and in urban areas also small and medium-sized coal-burning boiler facilities. SO2 is also produced in certain processes in industry (e.g. cellulose production plants).
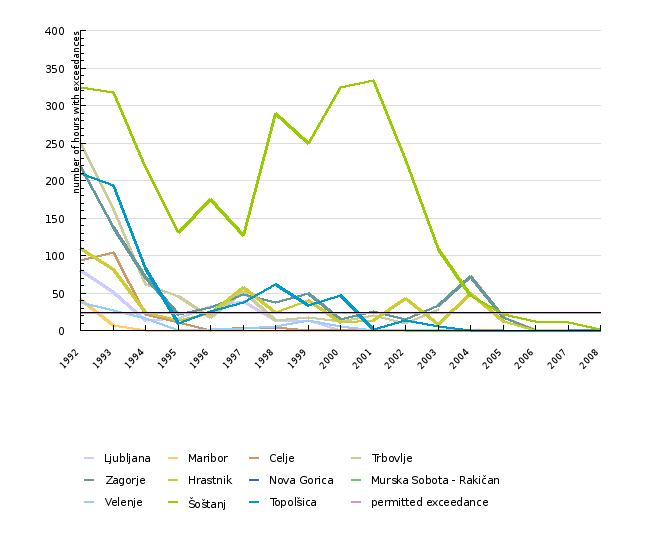
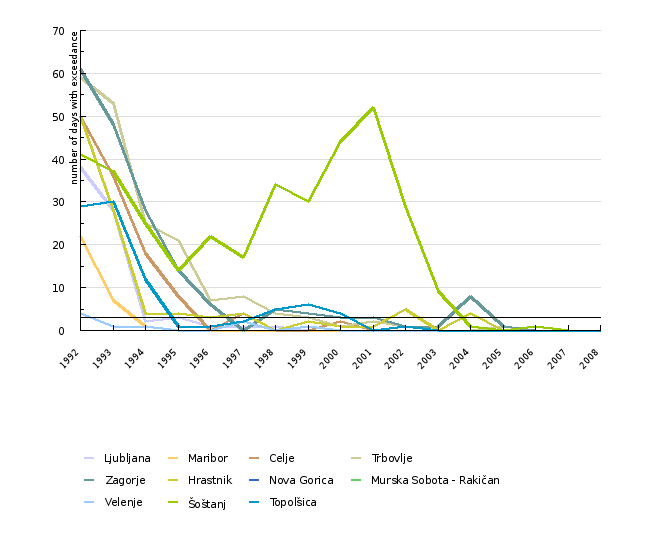
The indicator shows the frequency in exceedances of 1-hour limit concentration value (350 μg/m3) and the frequency in exceedances of 24-hour limit concentration value (125 μg/m3) for SO2 in the major Slovenian urban areas by individual year.
Charts
| 1992 | 1993 | 1994 | 1995 | 1996 | 1997 | 1998 | 1999 | 2000 | 2001 | ||
|---|---|---|---|---|---|---|---|---|---|---|---|
| Ljubljana | number of hours | 80 | 51 | 13 | 16 | 32 | 39 | 14 | 14 | 0 | 0 |
| Maribor | number of hours | 41 | 7 | 0 | 0 | 0 | 0 | 0 | 0 | 0 | 0 |
| Celje | number of hours | 94 | 104 | 22 | 11 | 0 | 4 | 4 | 0 | 1 | 1 |
| Trbovlje | number of hours | 249 | 162 | 61 | 46 | 17 | 52 | 14 | 18 | 12 | 20 |
| Zagorje | number of hours | 219 | 137 | 71 | 22 | 31 | 48 | 38 | 49 | 15 | 25 |
| Hrastnik | number of hours | 110 | 82 | 24 | 14 | 23 | 58 | 24 | 40 | 11 | 14 |
| Nova Gorica | number of hours | np | np | np | np | np | np | np | np | np | np |
| Murska Sobota - Rakičan | number of hours | np | np | np | np | np | np | np | np | np | np |
| Velenje | number of hours | 38 | 27 | 16 | 0 | 2 | 3 | 6 | 13 | 6 | 0 |
| Šoštanj | number of hours | 324 | 318 | 218 | 131 | 175 | 127 | 289 | 249 | 324 | 334 |
| Topolšica | number of hours | 209 | 194 | 83 | 9 | 26 | 38 | 62 | 33 | 47 | 2 |
| 2002 | 2003 | 2004 | 2005 | 2006 | 2007 | 2008 | |||||
| Ljubljana | number of hours | 0 | 0 | 0 | 0 | 0 | 0 | 0 | |||
| Maribor | number of hours | 0 | 0 | 0 | 0 | 0 | 0 | 0 | |||
| Celje | number of hours | 0 | 1 | 1 | 0 | 0 | 0 | 0 | |||
| Trbovlje | number of hours | 10 | 28 | np | 17 | 1 | 0 | 0 | |||
| Zagorje | number of hours | 15 | 33 | 72 | 17 | 0 | 0 | 2 | |||
| Hrastnik | number of hours | 43 | 8 | 49 | 12 | 0 | 0 | 0 | |||
| Nova Gorica | number of hours | 0 | 0 | 0 | 0 | 0 | 0 | 0 | |||
| Murska Sobota - Rakičan | number of hours | 0 | 0 | 0 | 0 | 0 | 0 | 0 | |||
| Velenje | number of hours | 1 | 1 | 0 | 0 | 0 | 0 | 0 | |||
| Šoštanj | number of hours | 228 | 108 | 47 | 22 | 12 | 11 | 1 | |||
| Topolšica | number of hours | 13 | 5 | 0 | 0 | 0 | 0 | 0 |
| 1992 | 1993 | 1994 | 1995 | 1996 | 1997 | 1998 | 1999 | 2000 | 2001 | ||
|---|---|---|---|---|---|---|---|---|---|---|---|
| Ljubljana | number of days | 38 | 28 | 2 | 3 | 1 | 1 | 1 | 0 | 0 | 0 |
| Maribor | number of days | 22 | 7 | 1 | 0 | 0 | 0 | 0 | 0 | 0 | 0 |
| Celje | number of days | 50 | 36 | 18 | 8 | 0 | 4 | 0 | 0 | 2 | 0 |
| Trbovlje | number of days | 59 | 53 | 25 | 21 | 7 | 8 | 4 | 3 | 1 | 2 |
| Zagorje | number of days | 61 | 48 | 28 | 14 | 6 | 0 | 5 | 4 | 3 | 3 |
| Hrastnik | number of days | 50 | 28 | 4 | 4 | 3 | 4 | 0 | 2 | 1 | 1 |
| Nova Gorica | number of days | np | np | np | np | np | np | np | np | np | np |
| Murska Sobota - Rakičan | number of days | np | np | np | np | np | np | np | np | np | np |
| Velenje | number of days | 4 | 1 | 1 | 0 | 0 | 2 | 0 | 1 | 0 | 0 |
| Šoštanj | number of days | 41 | 37 | 25 | 14 | 22 | 17 | 34 | 30 | 44 | 52 |
| Topolšica | number of days | 29 | 30 | 12 | 1 | 1 | 2 | 5 | 6 | 4 | 0 |
| 2002 | 2003 | 2004 | 2005 | 2006 | 2007 | 2008 | |||||
| Ljubljana | number of days | 0 | 0 | 0 | 0 | 0 | 0 | 0 | |||
| Maribor | number of days | 0 | 0 | 0 | 0 | 0 | 0 | 0 | |||
| Celje | number of days | 0 | 0 | 0 | 0 | 0 | 0 | 0 | |||
| Trbovlje | number of days | 1 | 0 | 0 | 1 | 0 | 0 | 0 | |||
| Zagorje | number of days | 1 | 1 | 8 | 1 | 0 | 0 | 0 | |||
| Hrastnik | number of days | 5 | 0 | 4 | 0 | 0 | 0 | 0 | |||
| Nova Gorica | number of days | 0 | 0 | 0 | 0 | 0 | 0 | 0 | |||
| Murska Sobota - Rakičan | number of days | 0 | 0 | 0 | 0 | 0 | 0 | 0 | |||
| Velenje | number of days | 0 | 0 | 0 | 0 | 0 | 0 | 0 | |||
| Šoštanj | number of days | 29 | 9 | 1 | 0 | 1 | 0 | 0 | |||
| Topolšica | number of days | 1 | 0 | 0 | 0 | 0 | 0 | 0 |
Goals
The main aim of air quality management is reduction of air pollution in Slovenia caused by SO2, as stated in the Decree on Sulphur Dioxide, Nitrogen Oxides, Particulate Matter and Lead in Ambient Air (OJ RS No 52/02) and the EU Directive (1999/30/EC). Legislation provides that average 24-hour concentration of SO2 may exceed the value 125 μg/m3 not more than three times per calendar year, and average 1-hour concentration of SO2 may exceed the permissible 1-hour value not more than 24 times per calendar year. Since, according to the Decree, the permissible 1-hour value will reach the target limit value 350 μg/m3 in 2005, the indicator also shows the exceedances of this target limit value for the purposes of comparison with the preceding years. The target is to ensure that the requirements of this Decree are fulfilled. Reduction of air pollution due to SO2 is also a target of the National Environmental Action Programme.
Comment
The figures clearly demonstrate that Slovenia has in some urban areas achieved the required standards. A number of individual and smaller combustion plants fuelled with coal was transferred to central power plant heating and cleaner fuels. The situation is improving in Europe as well. Exception in Slovenia is Šoštanj, where the monitoring site is influenced by emissions from the thermal power plant. The established hourly and daily limit values are exceeded too frequently, but the problem is being resolved with desulphurisation units having been installed. There are also occasional exceedances of limit values in the Zasavje urban areas, which have an unfavourable geographical position, especially in winter period when thermal inversions occur and are, in addition to local emission sources, also affected by the influence of emissions from the Trbovlje Thermal Power Plant. Particularly unfavourable conditioned occured in December 2004, when there was a long period of very strong thermal inversions.
Methodology
The data for Slovenia are taken from the National authomatic measurement air quality network database (ANAS) maintained by the Monitoring Office (Environmental Agency of the Republic of Slovenia) and Šoštanj Thermal Power Plant measurement database provided by the Electroinstitute Milan Vidmar, Ljubljana. The database is updated monthly; the data are available in their entirety upon the completion of final annual review.
Information on the ANAS automatic network monitoring sites:
Ljubljana had two monitoring sites until 2001 – Figovec and Bežigrad. By the end of that same year, it was put out of operation, since the Bežigrad monitoring site was considered representative enough for determining the impact on health of the majority of Ljubljana’s population. The monitoring site in Maribor is located directly at the carriageway in the city centre, near an intersection; therefore the air samples show a higher level of traffic-related pollution. Since traffic is not the source of SO2, the monitoring site is also representative for a wider urban area. In Celje, measurements are taken in the hospital complex located just outside the city centre. The monitoring site is representative for a wider urban area. Monitoring site in Nova Gorica is placed on the edge of the city. The Trbovlje and Zagorje monitoring sites are set up at roadside locations in the city centres. The Hrastnik monitoring site, however, is not directly affected by the influence of traffic-related emissions. All three monitoring sites are representative of the above mentioned urban areas. The Rakičan by Murska Sobota monitoring site is representative for rural area in the vicinity of a town.
Information on the Šoštanj Thermal Power Plant automatic network monitoring sites:
The Šoštanj monitoring site is located east of the city and in the event of south-western winds is exposed to the influence of emissions from lower stacks of the Šoštanj Thermal Power Plant. The measured SO2, concentrations are not representative for the Šoštanj urban area. The monitoring sites at Velenje and Topolšica are representative for the Velenje urban area and Topolšica with close surroundings.


