KAZALCI OKOLJA

Environmental indicators in Slovenia


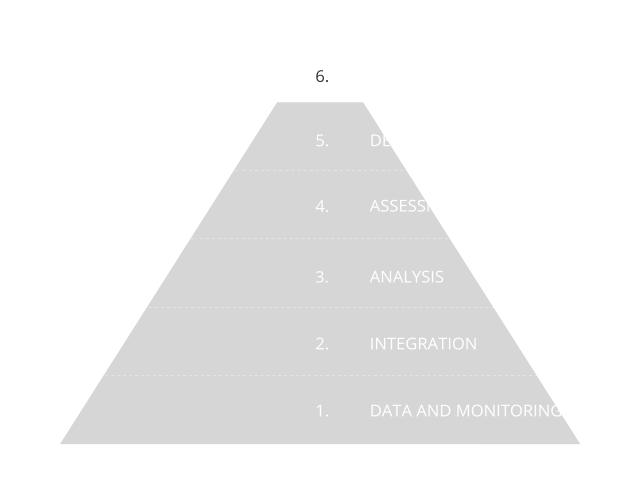
Environmental indicators are based on graphs, maps and assessments and as such present environmental trends in Slovenia. The indicators represent one of the four pillars of our environmental reporting, and are prepared in accordance with the Environmental Protection Act. The Environmental Indicators in Slovenia website enables users to browse among 180 indicators. They are based on numerical data and they indicate the state, characteristics and trends of environmental development in Slovenia. They are prepared using a systematic approach based on data and monitoring, as shown in the information pyramid.

Did you know?

Bad

The daily mobility of the population is a fundamental indicator of the performance and development trends of the transport system, and it also indirectly reflects the impact of the transport system on the environment - the greater the use of sustainable travel modes, the lower the impact of the transport system on the environment. In 2021, a resident of Slovenia made an average of 2.2 trips per day, the length of the trip was 31 km on average (27 km in the EU) and it took approximately 52 minutes (80 minutes in the EU).

Good

Slovenia has a relatively high level of energy intensity, although it has been declining, particularly rapidly in recent years. Between 2005 and 2023, energy intensity decreased at an average annual rate of 3.2%. In 2024, energy intensity increased for the first time since 2016, rising by 2.1%. In 2024, Slovenia’s energy intensity was 37% higher than the EU-27 average, which is 15 percentage points less than in 2005.

Neutral

Final energy consumption in 2024 amounted to 4,594 ktoe and increased by 2.4% compared to the previous year. A decrease occurred only in households, by 1.6%; in all other sectors, final energy consumption increased: by less than one per cent in industry, by 2.8% in services, and the most, by 5.3%, in transport. Final energy consumption was 177 ktoe (- 3.7%) , or 3.7%, lower than the 2024 indicative target value from the National Energy and Climate Plan from 2020 (NECP 2024). The indicative annual target was thus achieved.

Good

Net greenhouse gas (GHG) emissions in the LULUCF sector amounted to -4.452 kt CO2 eq in 2024, indicating that the sector was a net sink. Compared with 2005, the size of the net sink was 41% lower, mainly due to the impacts of natural disturbances in forests and increased harvesting levels over the past decade. According to the Slovenian Forest Service, timber harvesting in 2025 decreased by approximately 13% compared to 2024, while the share of sanitary fellings remained high, accounting for around 32% of total recorded harvesting.

Bad

In 2024, the share of RES in transport, after an increase in 2023, dropped again and amounted to 9,2%. With this, it was 1,6 percentage points behind the non-binding 2024 target from the updated National Energy and Climate Plan (NECP 2024).

Neutral

In 2024, greenhouse gas (GHG) emissions from sources covered by Regulation (EU) 2023/857 increased by 1.8% compared to the previous year. Nevertheless, they remained 0.4% (41 kt CO₂ eq) below the annual target set under the Regulation. The National Energy and Climate Plan from 2024 (NECP 2024) sets a more ambitious 2030 target for reducing non-ETS emissions than the EU Regulation. A comparison with the indicative trajectory towards this target, starting in 2021, shows that emissions were 5 percentage points above the trajectory in 2024.