KAZALCI OKOLJA

Environmental indicators in Slovenia


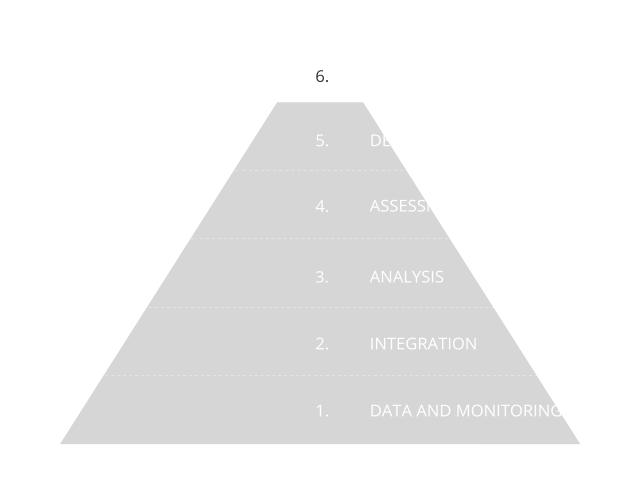
Environmental indicators are based on graphs, maps and assessments and as such present environmental trends in Slovenia. The indicators represent one of the four pillars of our environmental reporting, and are prepared in accordance with the Environmental Protection Act. The Environmental Indicators in Slovenia website enables users to browse among 180 indicators. They are based on numerical data and they indicate the state, characteristics and trends of environmental development in Slovenia. They are prepared using a systematic approach based on data and monitoring, as shown in the information pyramid.

Did you know?

Neutral

In Slovenia the concentration of dioxins in human milk is low and comparable to those in the neighboring countries. Long-term surveillance will be possible once regular national human biomonitoring is established and assured.

Neutral

Primary energy consumption amounted to 6,297 ktoe in 2024 and increased by 3.8% compared to the previous year. The increase, which occurred for all fuels, was due to both higher final energy consumption and increased electricity production. Primary energy consumption was 120 ktoe (- 1.9%) lower than the indicative target value for 2024 from the National Energy and Climate Plan from 2024 (NECP 2024). The indicative annual value was thus achieved.

Bad

The frequency of agricultural drought in Slovenia has been increasing in recent decades. Since 2000, natural disaster due to agriculture drought has been declared seven times in Slovenia, the most severe of which occurred in 2003, 2013, 2017 and 2022. Drought of higher intensity keeps occurring more frequently than before and in areas and seasons where it has not been a problem in the past. An additional risk for drought damage in agriculture present rapidly developing droughts in summer (so-called "flash droughts"), which occur during heat waves.

Neutral

In 2024, net greenhouse gas emissions in the European Union were 2.3% lower than in 2023 and 38.0% lower than in 1990. In Slovenia, greenhouse gas emissions excluding the Land Use, Land-Use Change and Forestry (LULUCF) sector increased by 4.1% compared with 2023. Emissions from non-ETS sectors were 1.8% higher in 2024 than in 2023, but still 12.1% lower than in 2005.

Neutral
Sea

In the period 1961–2024, the mean annual sea level along the Slovenian coast increased. The mean annual sea level at the Koper tide gauge station reached 233 cm in 2024 and was the second highest in the comparative period 1991–2020. The highest annual sea level of 322 cm represented the third highest sea level after 1991, while the lowest annual sea level of 142 cm was the second highest among the lowest recorded sea levels after 1991.

Neutral

The above-average water-abundant years of 2013 and 2014 were followed by the below-average year of 2015 and the average water-abundant years of 2016–2021. The year 2022 was below-average, the year 2023 was above-average, and the year 2024 was slightly above-average. According to the annual river balance, in the period 1961–2024, the years 2010, 2013, 2014, and 2023 were significantly above average, while the years 1983, 2003, 2007, 2011, 2015, and 2022 were below average. The trend in river water run-off from the Slovenian territory is decreasing.