[PP04] Precipitation and temperatures

Key message

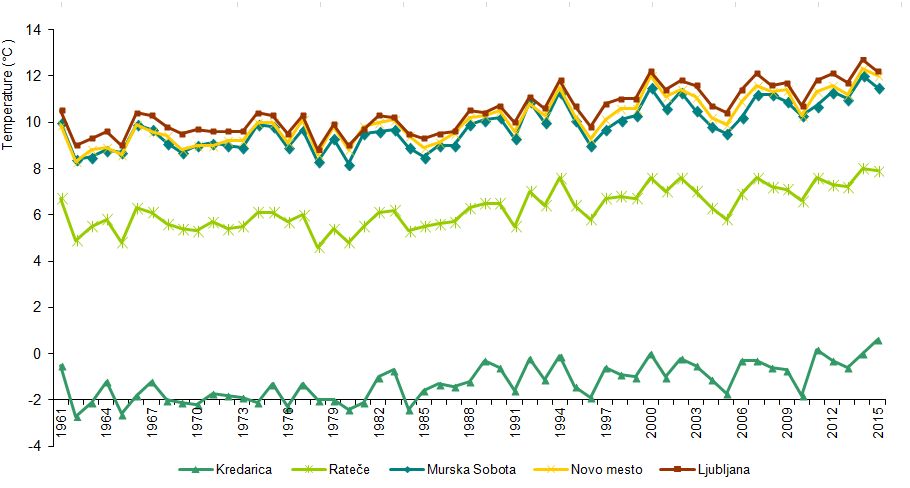
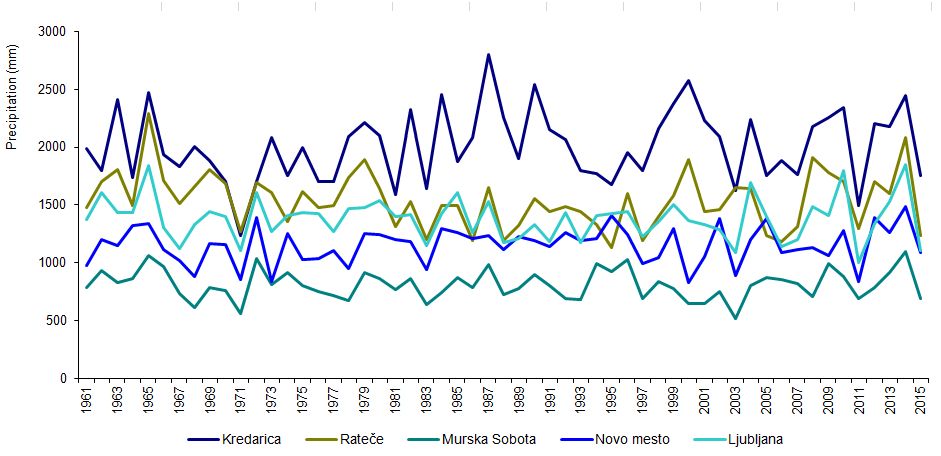
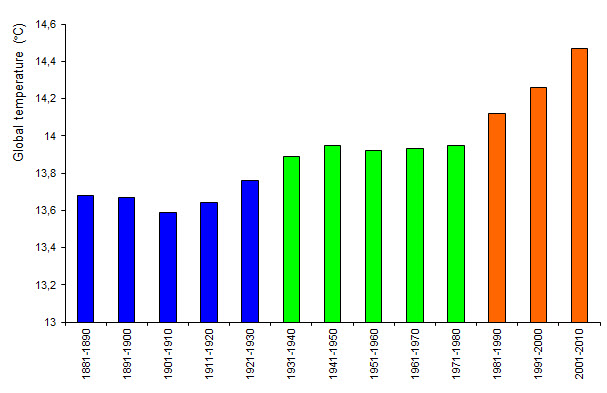
Temperatures in Slovenia are increasing at a rate faster than the global average. An increase in the annual average temperature has been most evident in the last three decades. Trends in annual precipitation are not as obvious as temperature trends, as variation between years and regions is significant. Changes in seasonal precipitation raise more concern than changes in annual precipitation. As evident from climate projections, atmospheric warming will continue, annual precipitation will not change significantly and summer precipitation is expected to decrease.
Definition
This indicator shows average annual air temperatures and annual precipitation in selected places in Slovenia in the period 1961–2015. The trend in average global temperatures is also presented, showing that 2015 was the warmest year on record. Climate projections of change in annual air temperature and annual precipitation based on indicators published by the European Environment Agency are also presented.
Charts
Meteorological Office, Slovenian Environment Agency, 2016
| 1961 | 1962 | 1963 | 1964 | 1965 | 1966 | 1967 | 1968 | 1969 | 1970 | ||
|---|---|---|---|---|---|---|---|---|---|---|---|
| Kredarica | °C | -0.5 | -2.7 | -2.1 | -1.2 | -2.6 | -1.8 | -1.2 | -2 | -2.1 | -2.2 |
| Rateče | °C | 6.7 | 4.9 | 5.5 | 5.8 | 4.8 | 6.3 | 6.1 | 5.6 | 5.4 | 5.3 |
| Murska Sobota | °C | 10 | 8.4 | 8.5 | 8.8 | 8.7 | 9.9 | 9.7 | 9.1 | 8.7 | 9 |
| Novo mesto | °C | 9.9 | 8.3 | 8.8 | 8.9 | 8.6 | 9.9 | 9.6 | 9.4 | 8.8 | 9 |
| Ljubljana | °C | 10.5 | 9 | 9.3 | 9.6 | 9 | 10.4 | 10.3 | 9.8 | 9.5 | 9.7 |
| 1971 | 1972 | 1973 | 1974 | 1975 | 1976 | 1977 | 1978 | 1979 | 1980 | ||
| Kredarica | °C | -1.7 | -1.8 | -1.9 | -2.1 | -1.3 | -2.3 | -1.3 | -2 | -2 | -2.4 |
| Rateče | °C | 5.7 | 5.4 | 5.5 | 6.1 | 6.1 | 5.7 | 6 | 4.6 | 5.4 | 4.8 |
| Murska Sobota | °C | 9.1 | 9 | 8.9 | 9.9 | 9.8 | 8.9 | 9.7 | 8.3 | 9.3 | 8.2 |
| Novo mesto | °C | 9 | 9.2 | 9.2 | 10 | 10 | 9.1 | 10.1 | 8.6 | 9.8 | 8.8 |
| Ljubljana | °C | 9.6 | 9.6 | 9.6 | 10.4 | 10.3 | 9.5 | 10.3 | 8.8 | 9.9 | 9 |
| 1981 | 1982 | 1983 | 1984 | 1985 | 1986 | 1987 | 1988 | 1989 | 1990 | ||
| Kredarica | °C | -2.1 | -1 | -0.7 | -2.4 | -1.6 | -1.3 | -1.4 | -1.2 | -0.3 | -0.6 |
| Rateče | °C | 5.5 | 6.1 | 6.2 | 5.3 | 5.5 | 5.6 | 5.7 | 6.3 | 6.5 | 6.5 |
| Murska Sobota | °C | 9.5 | 9.6 | 9.7 | 8.9 | 8.5 | 9 | 9 | 9.9 | 10.1 | 10.2 |
| Novo mesto | °C | 9.8 | 10 | 10.1 | 9.4 | 8.9 | 9.1 | 9.5 | 10.2 | 10.3 | 10.5 |
| Ljubljana | °C | 9.7 | 10.3 | 10.2 | 9.5 | 9.3 | 9.5 | 9.6 | 10.5 | 10.4 | 10.7 |
| 1991 | 1992 | 1993 | 1994 | 1995 | 1996 | 1997 | 1998 | 1999 | 2000 | ||
| Kredarica | °C | -1.6 | -0.2 | -1.1 | -0.1 | -1.4 | -1.9 | -0.6 | -0.9 | -1 | 0 |
| Rateče | °C | 5.5 | 7 | 6.4 | 7.6 | 6.4 | 5.8 | 6.7 | 6.8 | 6.7 | 7.6 |
| Murska Sobota | °C | 9.3 | 10.9 | 10 | 11.3 | 10.1 | 9 | 9.7 | 10.1 | 10.3 | 11.5 |
| Novo mesto | °C | 9.6 | 10.8 | 10.3 | 11.5 | 10.3 | 9.3 | 10.1 | 10.6 | 10.6 | 12 |
| Ljubljana | °C | 10 | 11.1 | 10.6 | 11.8 | 10.7 | 9.8 | 10.8 | 11 | 11 | 12.2 |
| 2001 | 2002 | 2003 | 2004 | 2005 | 2006 | 2007 | 2008 | 2009 | 2010 | ||
| Kredarica | °C | -1 | -0.2 | -0.5 | -1.1 | -1.7 | -0.3 | -0.3 | -0.6 | -0.7 | -1.8 |
| Rateče | °C | 7 | 7.6 | 7 | 6.3 | 5.8 | 6.9 | 7.6 | 7.2 | 7.1 | 6.6 |
| Murska Sobota | °C | 10.6 | 11.3 | 10.5 | 9.8 | 9.5 | 10.2 | 11.2 | 11.2 | 10.9 | 10.3 |
| Novo mesto | °C | 11.1 | 11.4 | 11.1 | 10.2 | 9.9 | 10.9 | 11.6 | 11.3 | 11.4 | 10.3 |
| Ljubljana | °C | 11.4 | 11.8 | 11.6 | 10.7 | 10.4 | 11.4 | 12.1 | 11.6 | 11.7 | 10.7 |
| 2011 | 2012 | 2013 | 2014 | 2015 | |||||||
| Kredarica | °C | 0.2 | -0.3 | -0.6 | 0 | 0.6 | |||||
| Rateče | °C | 7.6 | 7.3 | 7.2 | 8 | 7.9 | |||||
| Murska Sobota | °C | 10.7 | 11.3 | 11 | 12 | 11.5 | |||||
| Novo mesto | °C | 11.3 | 11.6 | 11.2 | 12.3 | 12 | |||||
| Ljubljana | °C | 11.8 | 12.1 | 11.7 | 12.7 | 12.2 |
Main characteristics of the air temperature trend,period 1961-2011, Ljubljana, September 2013,Slovenian Environment Agency
Archive of meteorological data, Slovenian Environment Agency, 2016
| 1961 | 1962 | 1963 | 1964 | 1965 | 1966 | 1967 | 1968 | 1969 | 1970 | ||
|---|---|---|---|---|---|---|---|---|---|---|---|
| Kredarica | mm | 1984 | 1796 | 2416 | 1738 | 2469 | 1939 | 1836 | 2005 | 1880 | 1702 |
| Rateče | mm | 1478 | 1706 | 1805 | 1499 | 2290 | 1711 | 1514 | 1657 | 1807 | 1682 |
| Murska Sobota | mm | 786 | 931 | 832 | 866 | 1064 | 970 | 730 | 612 | 787 | 761 |
| Novo mesto | mm | 972 | 1202 | 1146 | 1319 | 1341 | 1117 | 1019 | 882 | 1165 | 1160 |
| Ljubljana | mm | 1372 | 1606 | 1431 | 1438 | 1839 | 1300 | 1119 | 1333 | 1445 | 1395 |
| 1971 | 1972 | 1973 | 1974 | 1975 | 1976 | 1977 | 1978 | 1979 | 1980 | ||
| Kredarica | mm | 1239 | 1702 | 2081 | 1750 | 1999 | 1703 | 1700 | 2096 | 2214 | 2099 |
| Rateče | mm | 1273 | 1692 | 1607 | 1359 | 1617 | 1480 | 1495 | 1736 | 1892 | 1638 |
| Murska Sobota | mm | 563 | 1033 | 809 | 912 | 805 | 751 | 718 | 676 | 912 | 862 |
| Novo mesto | mm | 855 | 1390 | 837 | 1250 | 1025 | 1038 | 1109 | 948 | 1250 | 1247 |
| Ljubljana | mm | 1107 | 1607 | 1270 | 1412 | 1435 | 1425 | 1265 | 1469 | 1475 | 1535 |
| 1981 | 1982 | 1983 | 1984 | 1985 | 1986 | 1987 | 1988 | 1989 | 1990 | ||
| Kredarica | mm | 1588 | 2325 | 1642 | 2456 | 1874 | 2079 | 2799 | 2256 | 1900 | 2545 |
| Rateče | mm | 1312 | 1532 | 1200 | 1497 | 1494 | 1192 | 1655 | 1191 | 1319 | 1553 |
| Murska Sobota | mm | 768 | 864 | 634 | 741 | 874 | 788 | 982 | 722 | 776 | 900 |
| Novo mesto | mm | 1199 | 1181 | 944 | 1296 | 1257 | 1213 | 1232 | 1115 | 1229 | 1192 |
| Ljubljana | mm | 1402 | 1418 | 1149 | 1424 | 1611 | 1265 | 1528 | 1178 | 1211 | 1331 |
| 1991 | 1992 | 1993 | 1994 | 1995 | 1996 | 1997 | 1998 | 1999 | 2000 | ||
| Kredarica | mm | 2148 | 2066 | 1802 | 1769 | 1680 | 1951 | 1800 | 2157 | 2376 | 2573 |
| Rateče | mm | 1441 | 1483 | 1446 | 1327 | 1129 | 1597 | 1195 | 1401 | 1579 | 1891 |
| Murska Sobota | mm | 804 | 689 | 677 | 989 | 924 | 1026 | 692 | 839 | 772 | 651 |
| Novo mesto | mm | 1140 | 1264 | 1188 | 1211 | 1405 | 1245 | 991 | 1041 | 1299 | 827 |
| Ljubljana | mm | 1182 | 1433 | 1177 | 1407 | 1423 | 1446 | 1230 | 1359 | 1501 | 1363 |
| 2001 | 2002 | 2003 | 2004 | 2005 | 2006 | 2007 | 2008 | 2009 | 2010 | ||
| Kredarica | mm | 2230 | 2093 | 1623 | 2241 | 1752 | 1885 | 1761 | 2180 | 2259 | 2343 |
| Rateče | mm | 1440 | 1458 | 1653 | 1638 | 1237 | 1180 | 1311 | 1911 | 1782 | 1703 |
| Murska Sobota | mm | 643 | 754 | 515 | 804 | 869 | 852 | 817 | 708 | 989 | 876 |
| Novo mesto | mm | 1051 | 1379 | 886 | 1197 | 1382 | 1084 | 1114 | 1135 | 1066 | 1278 |
| Ljubljana | mm | 1328 | 1288 | 1091 | 1696 | 1403 | 1141 | 1196 | 1490 | 1406 | 1798 |
| 2011 | 2012 | 2013 | 2014 | 2015 | |||||||
| Kredarica | mm | 1497 | 2204 | 2176 | 2449 | 1755 | |||||
| Rateče | mm | 1293 | 1701 | 1600 | 2084 | 1233 | |||||
| Murska Sobota | mm | 693 | 782 | 912 | 1093 | 690 | |||||
| Novo mesto | mm | 834 | 1387 | 1259 | 1482 | 1085 | |||||
| Ljubljana | mm | 998 | 1339 | 1531 | 1851 | 1106 |
World Meteorological Organization, The global climate 2001-2010, Decade of Climate Extremes, 2013
| 1881-1890 | 1891-1900 | 1901-1910 | 1911-1920 | 1921-1930 | 1931-1940 | 1941-1950 | 1951-1960 | 1961-1970 | 1971-1980 | ||
|---|---|---|---|---|---|---|---|---|---|---|---|
| global temprerature (°C) | °C | 13.7 | 13.7 | 13.6 | 13.6 | 13.8 | 13.9 | 14 | 13.9 | 13.9 | 14 |
| average (°C) | °C | ||||||||||
| 1981-1990 | 1991-2000 | 2001-2010 | |||||||||
| global temprerature (°C) | °C | 14.1 | 14.3 | 14.5 | |||||||
| average (°C) | °C |
WMO:2015 is hottest year on record, 2016
Goals
- to regularly monitor temperatures and precipitation;
- to identify long-term changes in the environment;
- to collect information required to assess climate change;
- to prepare expert documents for the reduction of potential negative impacts;
- to provide expert documents for planning and providing protection, preparedness and cooperation of various sectors in adopting and carrying out appropriate adaptation measures.
Comment
Global climate is a very important factor in the development of human civilisation. Recently, the climate has been changing faster than any other time in the history of the human race and climate change is now considered to be one of the greatest challenges facing humankind (World Meteorological Organisation, 2016).
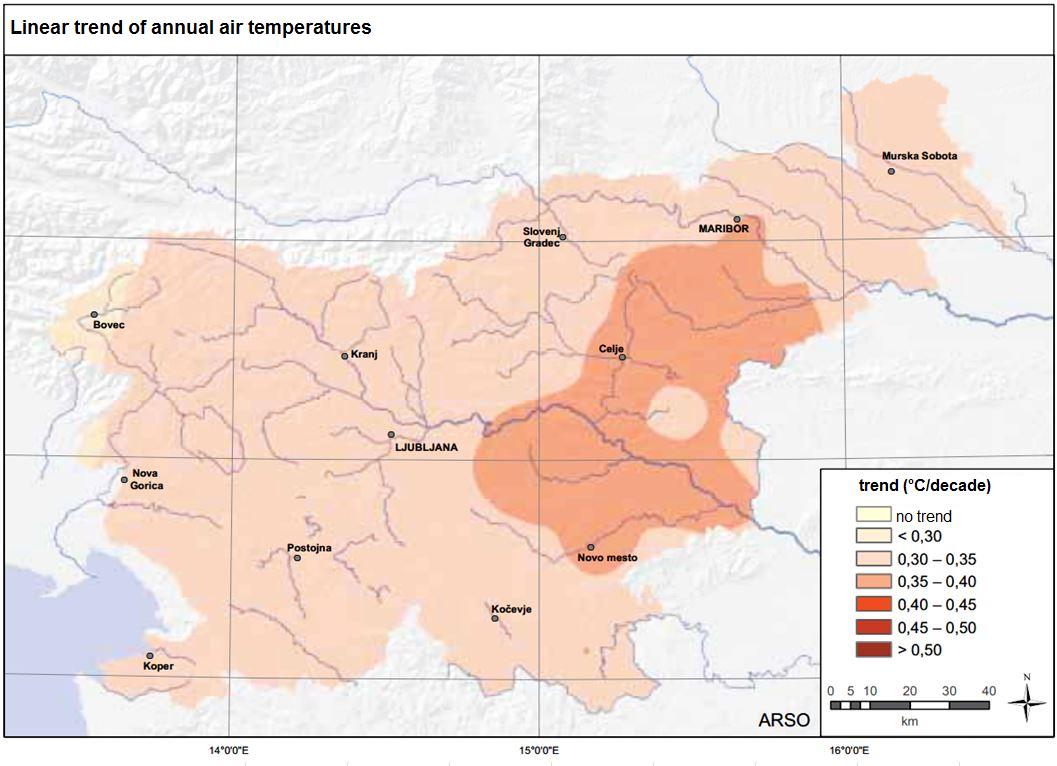
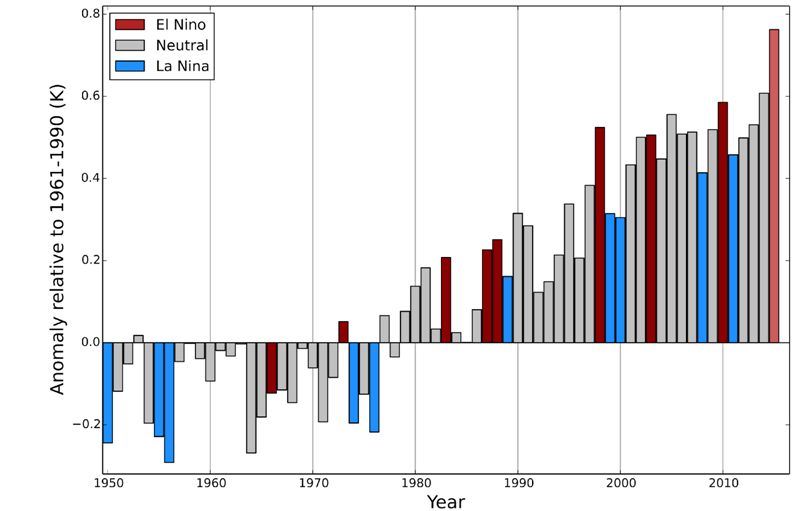
In lowland areas of Slovenia, 2015 was the second or third warmest year on record, following closely behind the warmest year of 2014. At Kredarica, average annual temperature in 2015 was 0.6 °C, which represents the highest mean annual temperature since weather conditions have been regularly recorded there. The monitoring data show that within the period 1951–2015, the greatest number of years with above-average mean annual temperatures occurred over the last three decades (Monthly bulletin of the Slovenian Environment Agency, 2016). The fastest growth trend was recorded in the last couple of decades of the previous century. This century, growth has slowed down slightly, until 2014 and 2015, when the trend of faster warming was resumed. Over the last 50 years, average annual temperature rose slightly more in the eastern part of Slovenia than in the western part. Although the rise of temperature was notable in all seasons of the year, it was highest during the summer. The growth trend is continuing and the Slovenian climate is already approximately 2 °C warmer than it was in the mid-20th century. After the exceptionally rainy year of 2014, precipitation in 2015 was mostly insufficient, except in the Bela krajina region. In Slovenia, regional differences in the amount of precipitation are very distinct. In the Julian Alps, average annual precipitation at certain locations exceeds 3,500 mm, while it rapidly decreases toward the east, with an annual average below 800 mm in the Prekmurje region. At the national level, annual precipitation in the period 1961–2011 decreased by 2–4%. The greatest decrease was recorded in western and southern Slovenia. The greatest change has been observed in spring, while in other seasons it has been less distinct. Contrary to temperature trends, precipitation trends differ considerably between regions, especially variability. More problems than variability of annual rainfall, though, are caused by deviations from average values in shorter periods of time lasting from a few days to several months, or between seasons. The effects of greater deviations from usual values can be manifested as droughts or floods, abundant precipitation can also cause landslides. During the summer months, trends differ between regions – in the north they tend to be positive, while they are negative in other parts of Slovenia, most notably along the Alpine-Dinaric barrier. In autumn, a negative trend prevails in the west, northwest, south and extreme northeast. During the winter months, trends are weak and regionally variable. Locally, natural climate variability still prevails over long-term trends. The data on climate trends in Slovenia in the period 1961–2013 is available on the Slovenian Environment Agency's website. According to the World Meteorological Organisation (WMO, 2016), it is clearly evident from average annual global temperature data that 2015 was the warmest year since average annual temperatures began being monitored. In 2015, average global temperatures exceeded the pre-industrial average temperature by approximately 1°C. Part of an exceptional deviation in 2015 can be attributed to an extremely strong El Niño. It is important to know about past changes in order to understand climate. However, it is essential to predict the future development of climate in order to be able to adapt to changes that are soon to occur. For this purpose, projections of future climate changes have been developed. According to projection results available at the National Meteorological Service of the Slovenian Environment Agency, warming will continue throughout Slovenia. By mid-century, spring seasons will be 1.5°C warmer, while other seasons will be 2°C warmer. In terms of precipitation, climate scenarios show a much greater uncertainty. For springs and autumns, both a reduction and increase in the amount of precipitation can be expected. For winters and summers, the signal is more certain. Winter precipitation is likely to increase, while summer precipitation will probably decrease, at least in the southern half of the country.
The presented results are based on the A1B scenario of greenhouse gas emissions, which represents a mid-point between the most pessimistic and the most optimistic scenarios of future economic and social changes. More detailed results are available on the Slovenian Environment Agency's website. More detailed projections for Slovenia are being developed and will be published on the Slovenian Environment Agency's website when completed.
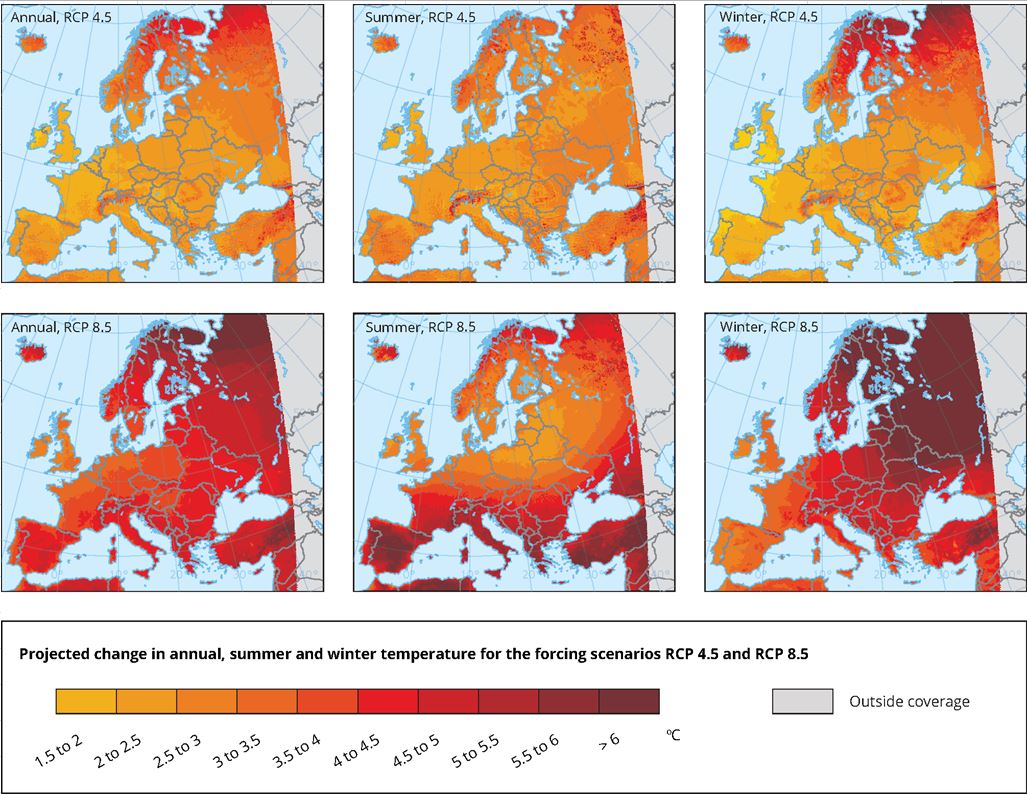
Average annual temperatures will increase throughout Europe (EEA, 2016). In Slovenia, the annual increase will be similar to the western and northern Balkans. During the summer, the temperature increase will be the greatest in southern Europe, while during the winter, it will be the greatest in the northern and north-eastern parts of the continent. The increase will depend on the growth in the concentration of greenhouse gases in the atmosphere. The figure based on the European Environment Agency data presents average annual, summer and winter deviations in the period 1971–2000 from the average for the same period according to the RCP 4.5 (upper row) and 8.5 (lower row) scenarios.
Projections for the current century show that the average annual temperature in Slovenia will exceed the average for the period 1971–2000 by 3–4.5°C (EEA, 2016) in the worst scenario and by 2.5–3.5°C in a more favourable scenario of the rise of concentrations of greenhouse gases in the atmosphere.
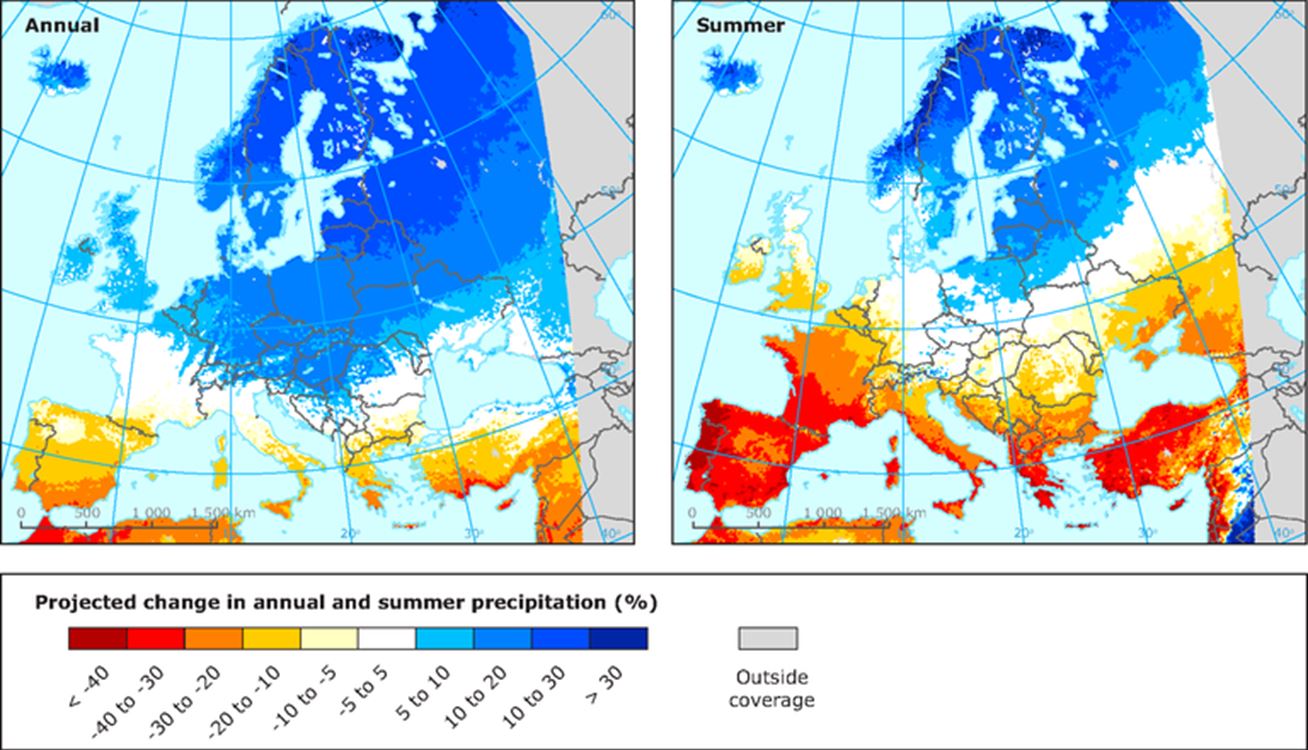
According to an EEA indicator, a change of average precipitation for the period 2071–2100 is shown in relation to the average for the same period in a more unfavourable scenario of the rise of concentrations of greenhouse gases (RCP 8.5). In the Mediterranean, annual precipitation will decrease – more notably during summers when the effects of the decrease will be felt throughout southern Europe. In northern Europe, annual as well as summer precipitation will increase. For Slovenia, these projections show a slight increase in annual precipitation and a decrease during the summer months.
We are probably most vulnerable when it comes to activities related to the effects of precipitation variability. Our vulnerability is further aggravated by ill-considered activities affecting the environment and insufficient state funded water management intended to reduce flood risks. Also, there is no national strategy on adaptation to climate change.


