[EN31] Efficiency of systems of production, transport and distribution of electricity and heat

Key message

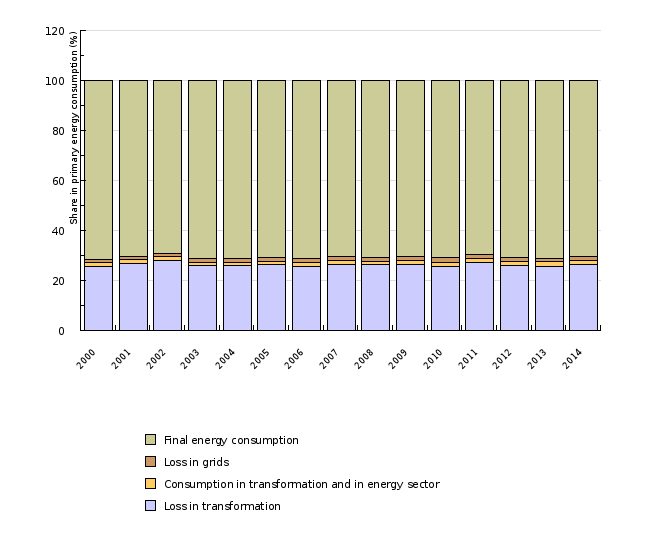
70% of the energy supply is at the disposal of final users in Slovenia. The share is largely affected by the efficiency of electricity and heat production.
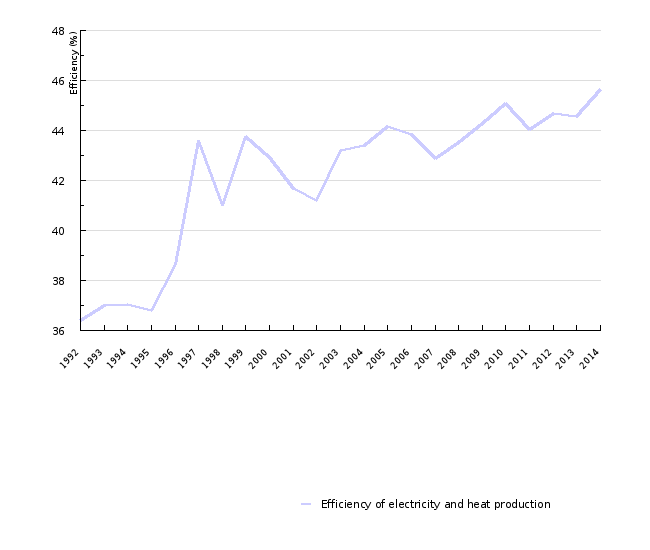
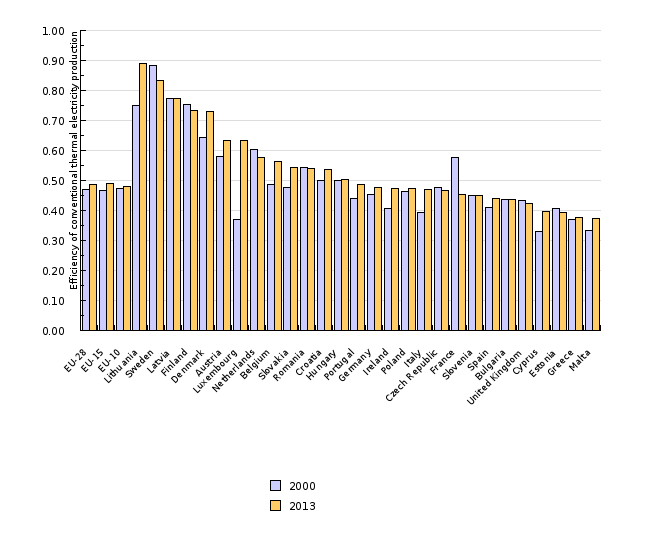
In electricity and heat production in thermal power plants and combined heat and power plants, 54% of energy input was lost in 2014. Efficiency of production is improving slowly due to the lack of new investments. In 2013, efficiency was 3% below that of the EU-28.
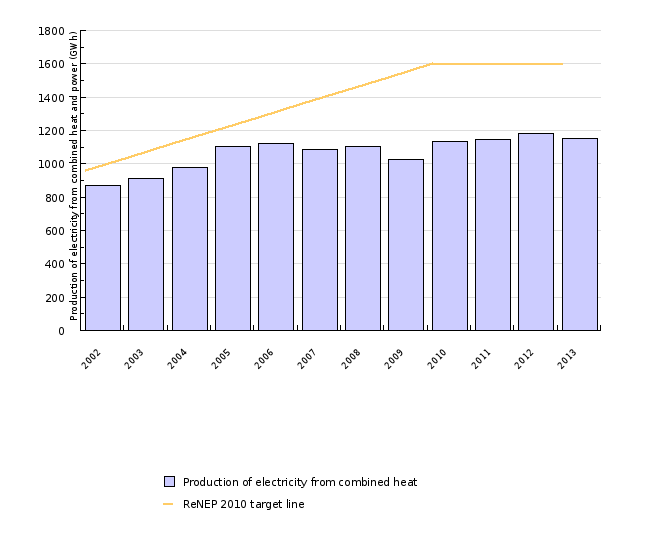
The production of electricity from combined heat and power generation decreased in 2013 and moved even further away from the 2010 goal.
Definition
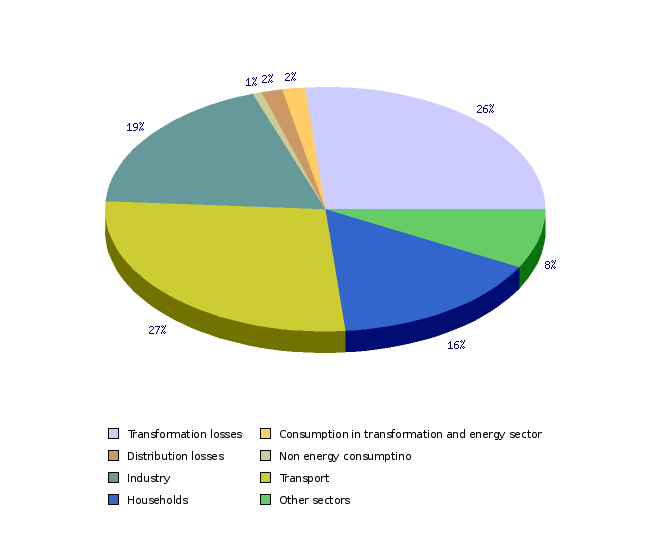
This indicator divides electricity consumption (primary energy) in Slovenia into losses in heat and power generation (dependent on production efficiency = consumed energy (fuels) minus produced energy (electricity, heat, petroleum products)), losses in transmission and distribution, consumption in the energy sector (in the data provided by the Statistical Office of the Republic of Slovenia, this includes the categories 'own use' and 'energy sector') and final energy consumption (non-energy and energy consumption). The indicator also shows the efficiency of heat and power generation in thermal power plants and combined heat and power plants, which is calculated as a quotient between electricity produced by generators and heat produced in thermal power plants and combined heat and power plants and the use of energy in the form of fossil fuels, combustible renewable sources and waste for heat and power generation in thermal power plants and combined heat and power plants. This enables the analysis of developments in the sector of heat and power generation, which is among the most important sources of emissions. The relationship between environmental impacts and the efficiency of production is inversely proportional. Higher efficiency results in lower environmental impacts. The indicator also shows heat and power cogeneration in Slovenia, which is one of the ways to increase the efficiency of electricity production, as it harnesses the heat that would otherwise be lost in thermal power plants. Electricity production in CHP (combined heat and power) units is calculated using EUROSTAT methodology.
Charts
Jožef Stefan Institute, 2015; Statistical office RS, 2015
| 2000 | 2001 | 2002 | 2003 | 2004 | 2005 | 2006 | 2007 | 2008 | 2009 | ||
|---|---|---|---|---|---|---|---|---|---|---|---|
| Loss in transformation | % | 25.5 | 27 | 28.1 | 25.9 | 25.9 | 26.2 | 25.7 | 26.5 | 26.3 | 26.4 |
| Consumption in transformation and in energy sector | % | 1.5 | 1.5 | 1.5 | 1.5 | 1.5 | 1.4 | 1.5 | 1.5 | 1.5 | 1.6 |
| Loss in grids | % | 1.5 | 1.3 | 1.3 | 1.6 | 1.5 | 1.7 | 1.5 | 1.5 | 1.3 | 1.5 |
| Final energy consumption | % | 71.5 | 70.3 | 69.1 | 71 | 71.1 | 70.6 | 71.3 | 70.5 | 70.9 | 70.6 |
| 2010 | 2011 | 2012 | 2013 | 2014 | |||||||
| Loss in transformation | % | 25.7 | 27.2 | 25.9 | 25.7 | 26.5 | |||||
| Consumption in transformation and in energy sector | % | 1.6 | 1.6 | 1.7 | 1.7 | 1.7 | |||||
| Loss in grids | % | 1.7 | 1.5 | 1.6 | 1.5 | 1.5 | |||||
| Final energy consumption | % | 71 | 69.7 | 70.9 | 71 | 70.3 |
Jožef Stefan Institute, 2015; Statistical office RS, 2015
| Transformation losses | Consumption in transformation and energy sector | Distribution losses | Non energy consumptino | Industry | Transport | Households | Other sectors | ||
|---|---|---|---|---|---|---|---|---|---|
| Share in gross inland consumption | [%] | 26.5 | 1.7 | 1.5 | 0.7 | 18.6 | 27.5 | 15.7 | 7.9 |
Statistical office RS, 2015; Jožef Stefan Institute, 2015
| 1992 | 1993 | 1994 | 1995 | 1996 | 1997 | 1998 | 1999 | 2000 | 2001 | ||
|---|---|---|---|---|---|---|---|---|---|---|---|
| Fuel consumption in thermal power plants and cogeneration plants | ktoe | 1518.1 | 1501.9 | 1429.2 | 1483.8 | 1408.1 | 1333.6 | 1511.7 | 1317.9 | 1365.7 | 1485 |
| Gross electricity production | ktoe | 404.3 | 405.3 | 397.5 | 398.5 | 387.5 | 435.8 | 450.3 | 415 | 432.4 | 465.5 |
| Gross electricity and heat production | ktoe | 552.6 | 555.9 | 529.6 | 546.3 | 544 | 581.2 | 619.5 | 576.6 | 586.1 | 619 |
| Efficiency of electricity and heat production | % | 36.4 | 37 | 37.1 | 36.8 | 38.6 | 43.6 | 41 | 43.8 | 42.9 | 41.7 |
| 2002 | 2003 | 2004 | 2005 | 2006 | 2007 | 2008 | 2009 | 2010 | 2011 | ||
| Fuel consumption in thermal power plants and cogeneration plants | ktoe | 1559.6 | 1488.9 | 1504.3 | 1507.8 | 1553.7 | 1596.2 | 1604.8 | 1538.3 | 1562.8 | 1587 |
| Gross electricity production | ktoe | 495.1 | 486.4 | 491.7 | 496.3 | 513.8 | 523 | 525.1 | 511.2 | 521.7 | 522.2 |
| Gross electricity and heat production | ktoe | 642.8 | 643.1 | 653 | 666 | 680.8 | 684.6 | 698.7 | 680.9 | 704.7 | 699.2 |
| Efficiency of electricity and heat production | % | 41.2 | 43.2 | 43.4 | 44.2 | 43.8 | 42.9 | 43.5 | 44.3 | 45.1 | 44.1 |
| 2012 | 2013 | 2014 | |||||||||
| Fuel consumption in thermal power plants and cogeneration plants | ktoe | 1530.1 | 1481.4 | 1170 | |||||||
| Gross electricity production | ktoe | 512.3 | 486.8 | 381.8 | |||||||
| Gross electricity and heat production | ktoe | 683.7 | 659.9 | 533.9 | |||||||
| Efficiency of electricity and heat production | % | 44.7 | 44.5 | 45.6 |
Eurostat, 2015
| EU-28 | EU-15 | EU-10 | Lithuania | Sweden | Latvia | Finland | Denmark | Austria | Luxembourg | ||
|---|---|---|---|---|---|---|---|---|---|---|---|
| 2000 | %/100 | 0.469 | 0.466 | 0.472 | 0.751 | 0.883 | 0.774 | 0.754 | 0.645 | 0.579 | 0.371 |
| 2013 | %/100 | 0.488 | 0.49 | 0.479 | 0.89 | 0.834 | 0.772 | 0.735 | 0.73 | 0.635 | 0.635 |
| Netherlands | Belgium | Slovakia | Romania | Croatia | Hungary | Portugal | Germany | Ireland | Poland | ||
| 2000 | %/100 | 0.604 | 0.488 | 0.475 | 0.545 | 0.499 | 0.5 | 0.441 | 0.454 | 0.407 | 0.465 |
| 2013 | %/100 | 0.576 | 0.564 | 0.545 | 0.539 | 0.536 | 0.502 | 0.488 | 0.478 | 0.474 | 0.473 |
| Italy | Czech Republic | France | Slovenia | Spain | Bulgaria | United Kingdom | Cyprus | Estonia | Greece | ||
| 2000 | %/100 | 0.394 | 0.475 | 0.576 | 0.45 | 0.408 | 0.435 | 0.434 | 0.329 | 0.408 | 0.371 |
| 2013 | %/100 | 0.471 | 0.465 | 0.452 | 0.451 | 0.44 | 0.436 | 0.424 | 0.395 | 0.393 | 0.378 |
| Malta | |||||||||||
| 2000 | %/100 | 0.334 | |||||||||
| 2013 | %/100 | 0.373 |
Statistical office RS, 2015
| 2002 | 2003 | 2004 | 2005 | 2006 | 2007 | 2008 | 2009 | 2010 | 2011 | ||
|---|---|---|---|---|---|---|---|---|---|---|---|
| Production of electricity | GWh | 14600 | 13821 | 15272 | 15117 | 15115 | 15043 | 16398 | 16403 | 16440 | 16059 |
| Production of electricity from combined heat and power | GWh | 872.6 | 909.8 | 977.4 | 1104.7 | 1123 | 1087.7 | 1106 | 1025.2 | 1134.6 | 1145.3 |
| ReNEP 2010 target line | GWh | 960 | 1040 | 1120 | 1200 | 1280 | 1360 | 1440 | 1520 | 1600 | 1600 |
| Share of electricity produced from combined heat and power | % | 6 | 6.6 | 6.4 | 7.3 | 7.4 | 7.2 | 6.7 | 6.3 | 6.9 | 7.1 |
| 2012 | 2013 | ||||||||||
| Production of electricity | GWh | 15736 | 16103 | ||||||||
| Production of electricity from combined heat and power | GWh | 1184.8 | 1149.4 | ||||||||
| ReNEP 2010 target line | GWh | 1600 | 1600 | ||||||||
| Share of electricity produced from combined heat and power | % | 7.5 | 7.1 |
Eurostat, 2015
| EU (28 countries) | Slovakia | Denmark | Latvia | Lithuania | Netherlands | Finland | Poland | Belgium | Luxembourg | ||
|---|---|---|---|---|---|---|---|---|---|---|---|
| Production of electricity | TWh | ||||||||||
| Production of electricity from CHP | TWh | ||||||||||
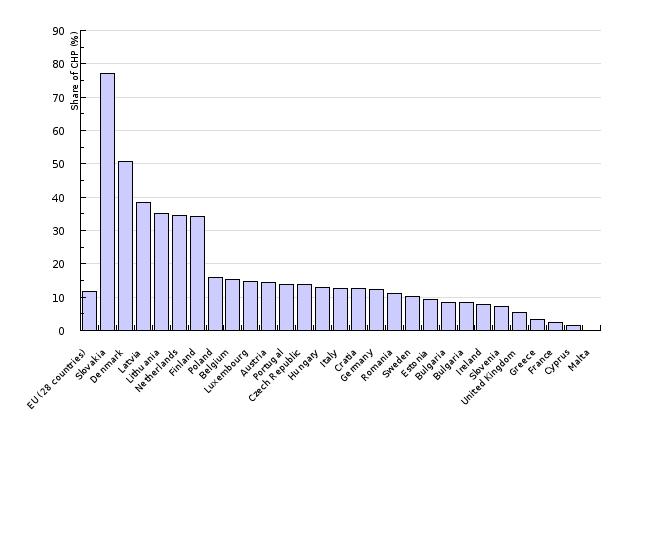
| Share of CHP in electricity production in 2013 | % | 11.7 | 77 | 50.6 | 38.3 | 35 | 34.5 | 34.1 | 15.9 | 15.2 | 14.7 |
| Austria | Portugal | Czech Republic | Hungary | Italy | Cratia | Germany | Romania | Sweden | Estonia | ||
| Production of electricity | TWh | ||||||||||
| Production of electricity from CHP | TWh | ||||||||||
| Share of CHP in electricity production in 2013 | % | 14.4 | 13.8 | 13.7 | 12.8 | 12.7 | 12.6 | 12.4 | 11.2 | 10.2 | 9.3 |
| Bulgaria | Bulgaria | Ireland | Slovenia | United Kingdom | Greece | France | Cyprus | Malta | |||
| Production of electricity | TWh | ||||||||||
| Production of electricity from CHP | TWh | ||||||||||
| Share of CHP in electricity production in 2013 | % | 8.5 | 8.5 | 7.8 | 7.1 | 5.5 | 3.4 | 2.4 | 1.4 | 0 |
Statistical office RS, 2015
| 2004 | 2005 | 2006 | 2007 | 2008 | 2009 | 2010 | 2011 | 2012 | 2013 | ||
|---|---|---|---|---|---|---|---|---|---|---|---|
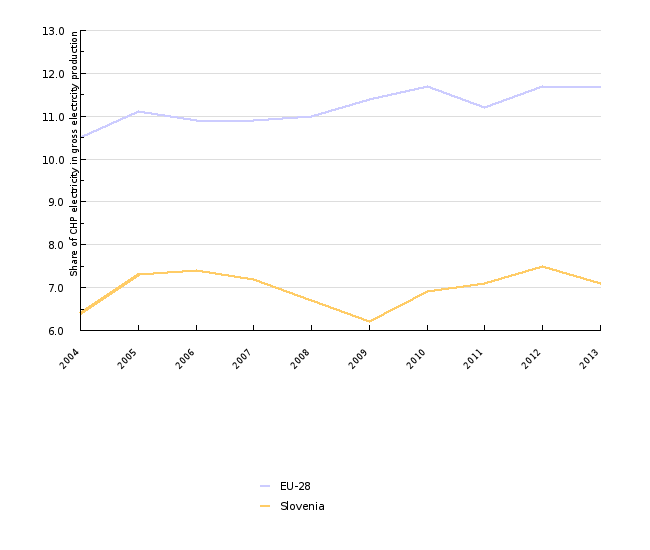
| EU-28 | % | 10.5 | 11.1 | 10.9 | 10.9 | 11 | 11.4 | 11.7 | 11.2 | 11.7 | 11.7 |
| Slovenia | % | 6.4 | 7.3 | 7.4 | 7.2 | 6.7 | 6.2 | 6.9 | 7.1 | 7.5 | 7.1 |
Goals
- to reduce energy losses in conversion and transmission;
- to improve efficiency and reduced environmental impacts of energy use,
- to improve efficiency of heat and power generation through technological renovation of the transformation sector, replacement of fuels and the increased share of heat and power cogeneration;
- in its Resolution on the National Energy Programme, Slovenia set a goal to double electricity production in CHP units in the 2000–2010 period, from 800 GWh to 1600 GWh. So far, Slovenia has not adopted a goal with regard to CHP since 2010.
Comment
Only part of the energy produced in Slovenia is available for final consumption, due to losses in the energy production and distribution system (particularly in electricity and heat generation and transmission).
In 2014, losses in conversion and transmission of electricity and heat represented 29.7% of total energy consumption in Slovenia (primary energy or energy supply). Compared to 2000, their share increased by 1.2 percentage points, while compared to the preceding year, it increased by 0.7% percentage points. The losses are subject to the following factors: efficiency of electricity and heat production, own use in power plants, use in the energy sector (mines, refineries, compression stations, etc.) and losses in the grid. The greatest losses occur in electricity and heat production or conversion. Losses in conversion amounted to 26.5% of the energy supply in 2014, 25.5% in 2000 and 25.7% in 2013. Fluctuations were much greater in the period 2000–2014, with losses between 25.5% and 28.1%. Losses are directly related to the efficiency of total electricity and heat production in Slovenia, which depends on a great number of factors, including: the efficiency of conversion in thermal power plants and combined heat and power plants and the share of their own energy use in total energy use in the conversion; the share of energy use at the nuclear power plant (constant efficiency of 33%) and the hydroelectric power plants (constant efficiency of 100%); and the efficiency of heat production in district heating plants and their share in energy use. In 2014, the average efficiency of electricity and heat production in Slovenia reached its highest value in the 1992–2014 period, amounting to 48.5%. This was a consequence of the highest share of non-combustible RES in generated electricity and the improved efficiency of energy and heat production from fossil fuels. The observations that the most efficient electricity production and the greatest share of losses in conversion in energy supply were in 2014, within the observed period, do not seem to make sense. This occurred because in 2014, final energy consumption decreased, while losses remained at a similar level as in 2013 (in absolute terms), causing an increase in the share of losses. In 2014, own energy use in electricity and heat production and the use of energy in the energy sector represented 1.7% of energy supply. In the period 2000–2014, the share was relatively constant (between 1.4% and 1.7%). In grids, 1.5% of the energy supply was lost in 2014. The values varied between 1.3% and 1.7%. Most losses occurred in electricity transmission (70%). Electricity losses in transmission represented 6% of gross electricity consumption, while losses in transmission of heat represented 16% of net heat production. In 2014, 70.3% of the energy supply remained for final consumption. Of this, 0.7% was used for non-energy purposes.
In 2014, the efficiency of electricity and heat production in power plants whose main activity was electricity production was 45.6%, which was 1.1 percentage points more than in the preceding year. In 2000, production efficiency was 42.9%. In the future, considerable improvements in efficiency are expected due to the installation of new facilities. This will lead to higher consumption of natural gas, which will additionally contribute to higher efficiency as facilities using natural gas tend to be more efficient (Urbančič, et. al., 2011a). The increasing share of heat and power cogeneration will contribute to improved efficiency as well.
In 2013, electricity production in combined heat and power systems (CHP) amounted to 1,149 GWh, which was 3% less compared to the previous year. The value is still considerably below the goal set by Slovenia in 2004 in the Resolution on the National Energy Programme. Heat production amounted to 10,826 TJ. The share of electricity produced in CHP units in total electricity production in Slovenia was 7.1%. Electricity production in CHP units increased until 2006. In the period 2006–2011 (with the exception of 2009), it was relatively constant at 1,100 GWh. In 2012, growth in electricity production was at its highest since 2005 (growth in 2010 was an exception caused by the economic recovery). In 2013, electricity production decreased despite the increase of installed power to 350 MW, which was the peak of the observed period. While the amount of power from installed CHP units until 2011 remained almost unchanged, this does not mean that new units, with mostly gas motors, were not installed – rather, it is a consequence of the fact that old units at the end of their life cycle stopped operating in the same period. The use of renewable energy sources additionally improved the environmental outlook of heat and power cogeneration. The share of renewable energy sources (RES) in total consumption of fuels in 2012 and 2013 was 17.7% and has been increasing since then. Among RES, wood biomass (63%) prevailed in 2013 (half of it was used in the Ljubljana combined heat and power plant). The rest was biogas (37%), whose use stopped growing.
One of the instruments to encourage the efficiency of electricity and heat production is the EU Emissions Trading System. The system encourages companies to invest in more efficient electricity and heat production through the purchase of additional emission rights. Currently, the price of emission allowances is too low for the instrument to be effective. Limit values for air pollutant emissions (SO2, NOx, etc.) from large combustion plants are a very important instrument as well, as they limit the operation and gradually phase out old, less efficient units through tightening of criteria. Other instruments are: environmental permits encouraging the use of the best available technologies (Industrial Emissions Directive), guaranteed purchase prices for electricity produced in heat and power cogeneration with high efficiency and support schemes (stimulation of heat and power cogeneration, stimulation of electricity production from RES).
In its reference scenario, the proposed National Energy Programme from 2011 predicts that electricity production in CHP units will increase to 2.4 TWh by 2020, while according to the intensive scenario, it will increase to 2.9 TWh, which is unattainable if the current trend continues. The highest increment of CHP units is expected in industry, which is expected to be followed by increased production in the Ljubljana combined heat and power plant due to the installation of a gas unit, while an important increase in the service sector and district heating is expected as well.
In the EU-28, 71.4% of the energy supply was available for final consumption in 2012 (22.0% was lost in conversion, 5.0% due own use and the use of the energy sector and 1.6% due to losses in grids). Among the Member States, the most energy efficient state is Luxembourg, where 94.5% of the energy supply is available for final consumption, and the least efficient is Estonia, where as much as 46.9% of the energy supply is lost. Luxembourg's high efficiency is the result of the high share of imported electricity, while Estonia's low efficiency is the result of the prevalence of electricity and heat production in steam power plants (EEA, 2015: Overview of the European energy system (ENER 036) - Assessment published Jan 2015).
In 2013, efficiency in electricity and heat production in Slovenia was 3.7 percentage points below the EU-28 average. In addition, it improved much less than in the EU-28 compared to 2000. In 2013, the most efficient state in electricity and heat production was Lithuania, followed by Sweden. An efficiency of over 80% means that heat and power cogeneration units strongly prevail. Malta has the lowest efficiency.
In 2013, the share of CHP in electricity production in the EU-28 amounted to 11.7%. With 7.1%, Slovenia was below the EU average in 2013. In the period 2004–2013, the share in the EU-28 increased by 1.2 percentage points, while in Slovenia it increased by 0.7 percentage points. Denmark had the highest share of electricity produced in CHP (50.6%).


